. 2019 Jul 1;132(13):jcs230300.
doi: 10.1242/jcs.230300.

Rho kinase-dependent apical constriction counteracts M-phase apical expansion to enable mouse neural tube closure

Affiliations

Rho kinase-dependent apical constriction counteracts M-phase apical expansion to enable mouse neural tube closure

Max B Butler et al. J Cell Sci. .

Abstract

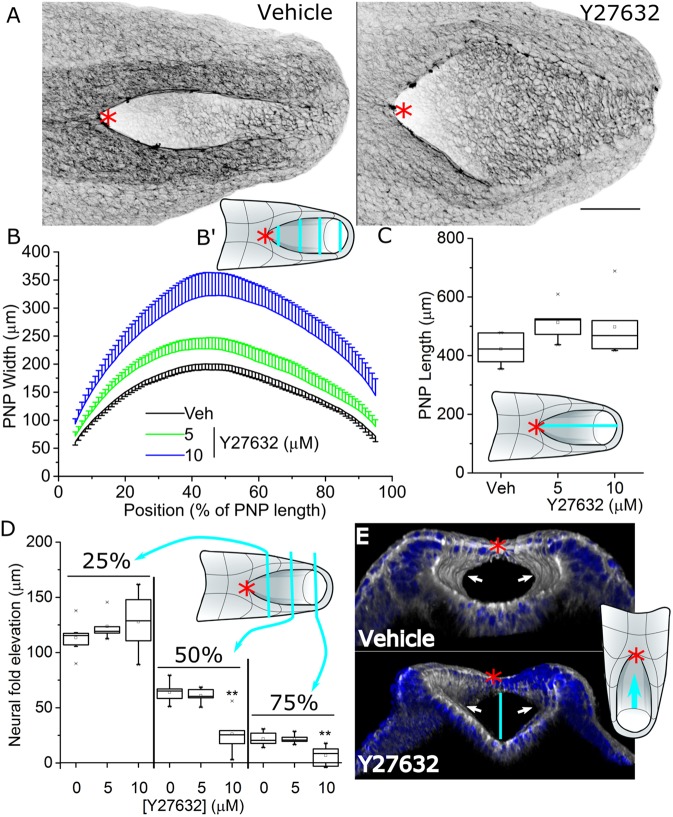
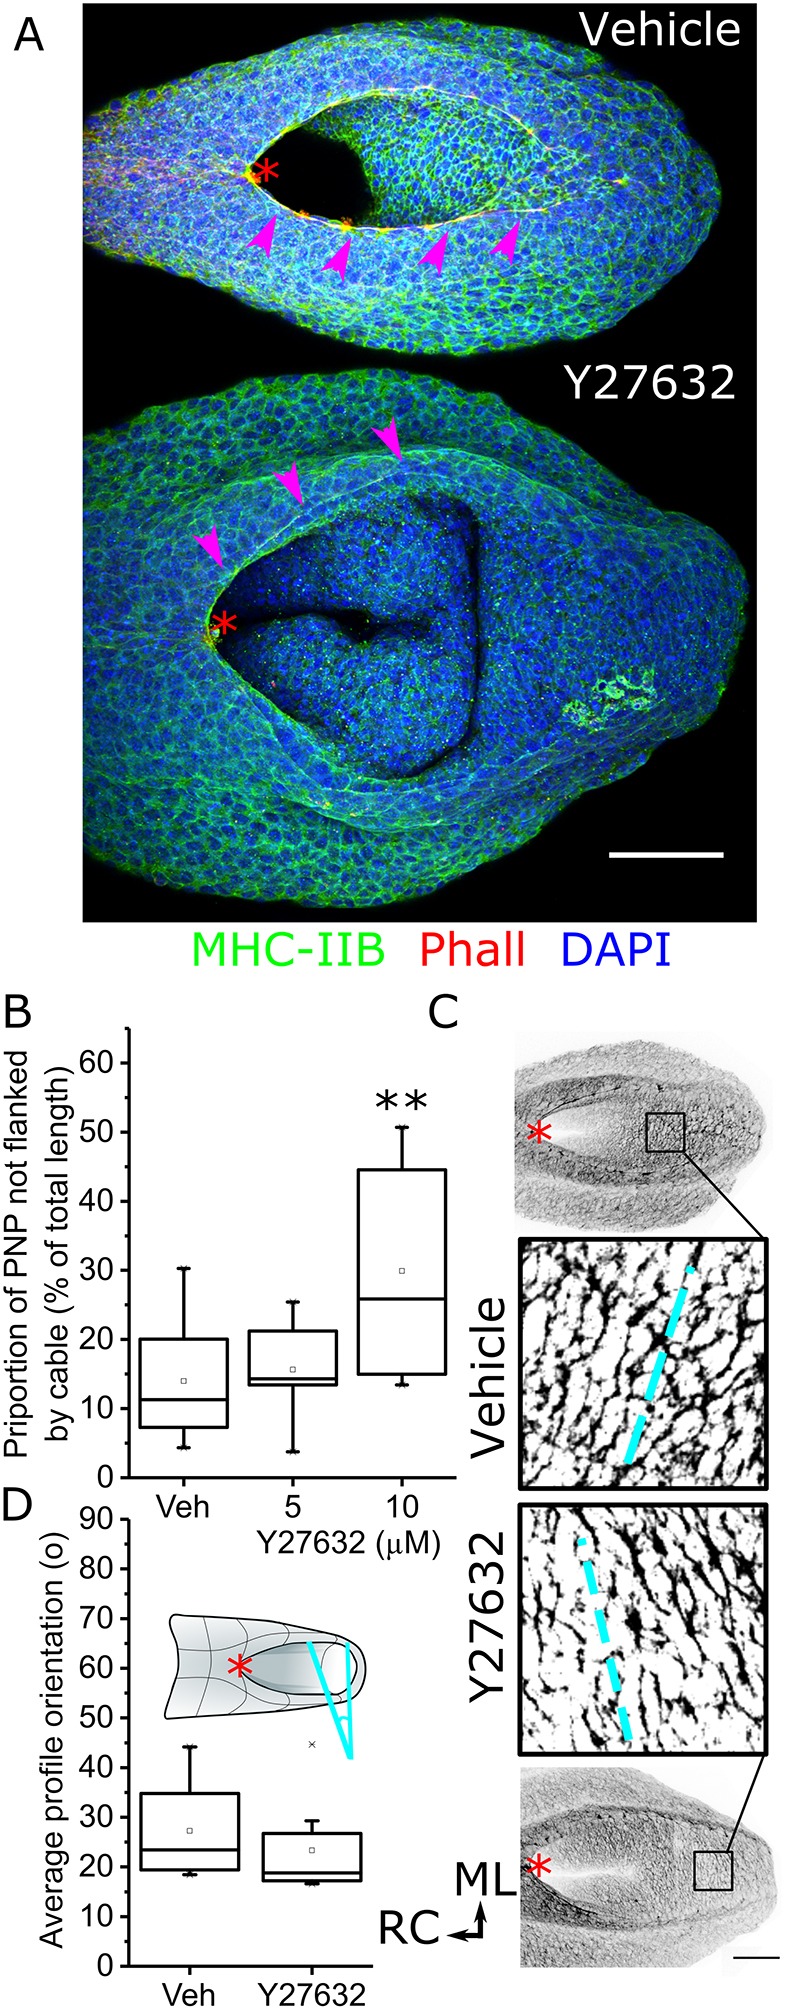
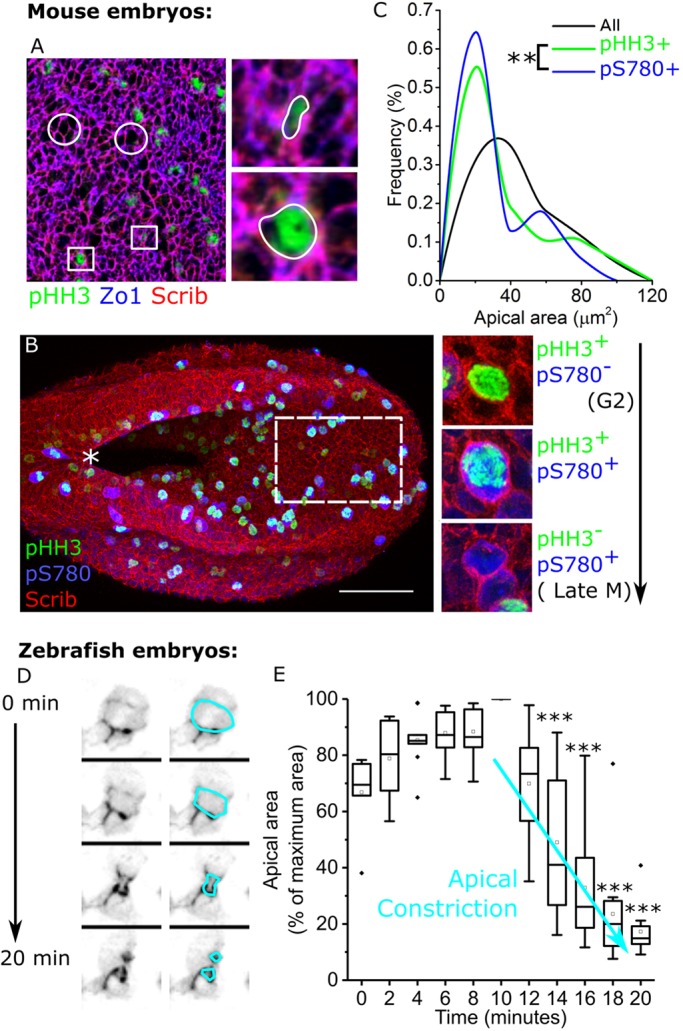
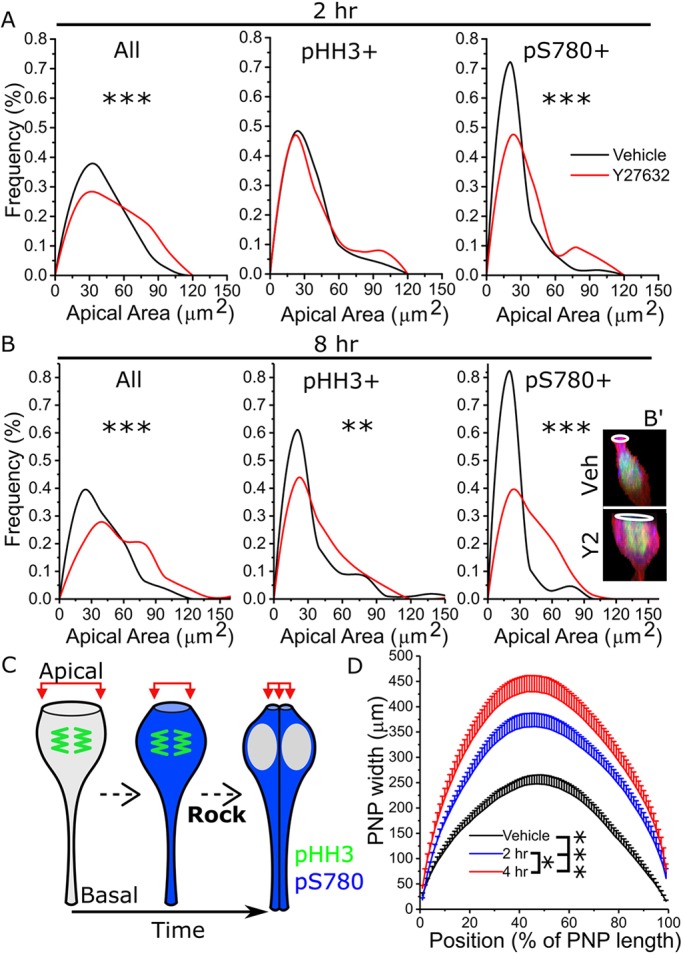
Cellular generation of mechanical forces required to close the presumptive spinal neural tube, the 'posterior neuropore' (PNP), involves interkinetic nuclear migration (INM) and apical constriction. Both processes change the apical surface area of neuroepithelial cells, but how they are biomechanically integrated is unknown. Rho kinase (Rock; herein referring to both ROCK1 and ROCK2) inhibition in mouse whole embryo culture progressively widens the PNP. PNP widening is not caused by increased mechanical tension opposing closure, as evidenced by diminished recoil following laser ablation. Rather, Rock inhibition diminishes neuroepithelial apical constriction, producing increased apical areas in neuroepithelial cells despite diminished tension. Neuroepithelial apices are also dynamically related to INM progression, with the smallest dimensions achieved in cells positive for the pan-M phase marker Rb phosphorylated at S780 (pRB-S780). A brief (2 h) Rock inhibition selectively increases the apical area of pRB-S780-positive cells, but not pre-anaphase cells positive for phosphorylated histone 3 (pHH3+). Longer inhibition (8 h, more than one cell cycle) increases apical areas in pHH3+ cells, suggesting cell cycle-dependent accumulation of cells with larger apical surfaces during PNP widening. Consequently, arresting cell cycle progression with hydroxyurea prevents PNP widening following Rock inhibition. Thus, Rock-dependent apical constriction compensates for the PNP-widening effects of INM to enable progression of closure.This article has an associated First Person interview with the first authors of the paper.

Keywords: Apical constriction; Biomechanics; F-actin; Interkinetic nuclear migration; Posterior neuropore; Rock.


Conflict of interest statement

Competing interestsA.J.C. acts as a paid consultant for ViiV Healthcare Limited, with fees going to support his research programme. No other competing interests are declared.

Figures

Fig. 1.
Fig. 1.
Rock inhibition widens the PNP and reduces neural fold elevation. E9 CD1 embryos were cultured in vehicle (Veh, n=6) or with the indicated concentrations of Y27632 (5 µM, n=5; 10 µM, n=6) for 8 h. (A) Representative wholemount phalloidin-stained vehicle and 10 µM Y27632-treated embryo PNPs (dorsal view). Scale bar: 100 µm. Image is presented after applying an inverted greyscale look-up table. (B) Sequential quantification of PNP width at every 1% of its length. The schematic in B′ illustrates sequential width measurements shown by the cyan lines across the PNP. (C) Quantification of PNP length as shown by the cyan line in the schematic. (D) PNP elevation was quantified as the dorsoventral distance between the neural fold tips and apical surface of the midline neuroepithelium (vertical line in E) at 25%, 50% and 75% of the length of the PNP. (E) 3D-reconstructed images of a vehicle and 10 µM Y27632-treated embryo PNP, illustrating the presence of dorso-lateral hinge points in both. These reconstructions are shown looking rostrally into the closure neural tube as indicated by the cyan arrow in the schematic. The red asterisks denote the zippering point throughout. **P<0.01 (tests defined in Materials and Methods); embryos were analysed at the 19–22 somite stage.
Fig. 2.
Fig. 2.
Rock inhibition diminishes the rostrocaudal neural fold F-actin cables but not mediolateral neuroepithelial profiles. E9 CD1 embryos were cultured in vehicle or the indicated concentrations of Y27632 for 8 h. (A) Representative wholemount-stained vehicle- and 10 µM Y27632-treated embryo PNPs (dorsal view). Arrowheads indicate the rostrocaudal actomyosin cables. (B) Quantification of the proportion of the PNP which extends beyond the caudal limit of the rostrocaudal cables, as previously defined (Galea et al., 2017; Hughes et al., 2018). Vehicle, n=8; 5 µM, n=5; 10 µM, n=7. (C) Visualisation of mediolateral F-actin profiles (image is presented after applying an inverted grey look-up table, which is binarised in the magnified views) in the relatively flat portion of the PNP in vehicle- and 10 µM Y27632-treated embryos. Dashed lines indicate the mean orientation quantified for those embryos. (D) Quantification of the mean orientation of binarised F-actin profiles in vehicle (n=8) and 10 µM Y27632-treated embryos (n=8) relative to the mediolateral direction (cyan angle bracket in the schematic). The red asterisks denote the zippering point throughout. Scale bars: 100 µm. **P<0.01 (ANOVA with post-hoc Bonferroni); embryos were analysed at the 19–22 somite stage.
Fig. 3.
Fig. 3.
Rock inhibition diminishes anti-closure PNP tissue tension. (A) Representative reflection live-imaged PNPs following 8 h of culture in vehicle or 10 µM Y27632. Each neuropore was imaged before and again after laser ablation (red line) of the zippering point. The white perimeter indicates the shape of the PNP before ablation, the green-shaded region indicates lateral displacement of the neural folds. Ablations of the rostrocaudal F-actin cables were performed in different embryos in the region indicated by A′. Scale bar: 100 µm. The red asterisks denote the zippering point. (B) Mediolateral change in width of the PNP in vehicle- (n=7) and 10 µM Y27632-treated embryos (n=6) at each 1% of the length of the PNPs from the zippering point (position 0%). Green lines indicate the region in which vehicle-treated embryos recoiled to a significantly greater extent than 10 µM Y27632-treated embryos (P<0.05, mixed model testing). (C) Rostrocaudal change in length (example in C′) of cell borders along the neural folds following laser ablation. n=9 per group, **P<0.01 (t-test). (D) Representative kymographs (from cell borders equivalent to the cyan box in C′) of cable ablations in vehicle- and 10 µM Y27632-treated embryos. Bright spots in each temporal slice are cell membranes on either side (left and right) of the ablation. White arrows indicate the ablated border, and temporal slices below the horizontal cyan line show displacement after laser ablation. Scale bar: 5 µm, kymographs were generated in Fiji.
Fig. 4.
Fig. 4.
Rock inhibition reduces neuroepithelial apical constriction. (A) Representative annular ablation in the region indicated by the white circle in the representative whole-PNP view, imaged before and immediately after ablation. A single ablation was performed in each embryo. The area within the ablated circle is shown by the cyan polygon between definable landmarks before ablation, which deformed to the magenta polygon immediately following ablation. Scale bar: 25 µm. (B) Representative segmented and registered cell borders before (cyan) and immediately after (magenta) annular ablation (white circle) illustrating their displacement in both vehicle- and 10 µM Y27632-treated embryos. The red arrows illustrate that the surrounding tissue also retracts away from the ablation. (C) Quantification of the constriction of the tissue within the ablated circle in vehicle- (n=8) and 10 µM Y27632-treated (n=9) embryo PNPs. (D) Surface-subtracted N-cadherin staining from a vehicle-treated embryo. Scale bar: 20 µm. Cell borders were segmented using Tissue Analyser as illustrated. (E) Quantification of median apical areas of neuroepithelial cells based on segmented N-cadherin staining in vehicle- and 10 µM Y27632-treated embryos (n=6 each) following 8 h of culture. (F) Frequency plot of observed apical areas of neuroepithelial cells in vehicle- (324 cells from 6 embryos) and 10 µM Y27632-treated embryos (244 cells from six embryos). The arrows indicate that although the majority of cells retain small apical areas despite Rock inhibition, there is a highly significant shift towards more cells having large apical areas. *P<0.05, **P<0.01, **P<0.001 (tests defined in Materials and Methods).
Fig. 5.
Fig. 5.
Neuroepithelial cells undergo apical re-constriction in late M phase. A–C represent data from non-cultured mouse PNPs, whereas D and E are from live-imaged zebrafish hindbrain neuroepithelium. (A) Representative triple-labelled neuroepithelial apical surface showing ZO-1 (apical-most tight junction marker), Scrib and the G2/M phase marker pHH3. Circles indicate cells with large apical areas that are negative for pHH3. Squares indicate pHH3+ cells with large and small apical areas, as shown in the magnified views. (B) Representative wholemount maximum projection showing the pattern of Scrib, pHH3 and pS780 staining in an uncultured embryo. The dashed white box indicates the relatively flat region of the PNP caudal to the medial hinge point in which apical areas were analysed. Optical cross-sections through pHH3/pS780 single and double positive cells (which appear cyan) are also shown. The white asterisk denotes the zippering point. Scale bar: 100 μm. (C) Frequency plot showing the distribution of apical area (based on Scrib staining) in the overall neuroepithelial cell population (‘All’, 262 cells from 5 embryos), and for pS780-positive (69 cells) and pHH3-positive cells (58 cells). **P<0.01 (Kolmogorov–Smirnov test). (D) Representative snapshots of a live-imaged zebrafish hindbrain neuroepithelium, with the apical cell surface mosaically labelled with Par3–RFP (cyan outline), undergoing apical reconstriction prior to division. The last time point shown (post-division) was not included in the apical area analyses shown in E. (E) Quantification of apical area for cells in the zebrafish hindbrain neuroepithelial over time. For each cell, its maximum size prior to division was identified (set at 100% for each cell) and 10 time points were analysed around this maximum dimension (i.e. t=10 min set at 100%). n=14 divisions from seven embryos. ***P<0.001 versus the maximum dimension (repeated measures ANOVA with Bonferroni post-hoc).
Fig. 6.
Fig. 6.
Increases in apical area of neuroepithelial cells following Rock inhibition are cell cycle stage specific. (A,B) Embryos were cultured for (A) 2 h or (B) 8 h in vehicle or 10 µM Y27632 and triple-stained for Scrib, pHH3 and pS780. Apical areas were analysed in the overall cell population (‘All’), in all pHH3+ cells and in all pS780+ cells. B′ illustrates the shape (red, Scrib-labelled cell borders) and apical area (white rings) of a pHH3/pS780 double-positive cell from a vehicle- and Y27632-treated embryo. n numbers are as follows: All, 2 h vehicle, n=310 cells from six embryos, Y27632, n=267 cells from six embryos; All, 8 h vehicle, n=253 cells from five embryos, Y27632, n=320 cells from seven embryos; pHH3+, 2 h vehicle, n=87 cells, Y27632, n=80 cells; pHH3+, 8 h vehicle, n=110 cells, Y27632, n=102 cells; pS780+, 2 h vehicle, n=118 cells, Y27632, n=97 cells; pS780, 8 h vehicle, n=68 cells, Y27632, n=84 cells. (C) Schematic of the proposed model of apical constriction of neuroepithelial cells as cells transition from early M (pHH3+/pS780) through cytokinesis into G1 (pHH3/pS780+). Rock-dependent constriction is indicated in late M phase. (D) Sequential quantification of PNP width at every 1% of its length in embryos cultured in vehicle (2 h culture) or 10 µM Y27632 for 2 h or 4 h (n=6 embryos per group analysed at the 16–20 somites stage). *P<0.05, **P<0.01, ***P<0.001 (tests defined in Materials and Methods).
Fig. 7.
Fig. 7.
Cell cycle progression is a prerequisite for PNP widening in Rock-inhibited embryos. (A) Representative 3D-rendered PNP images from embryos treated with vehicle, 10 µM Y27632 (Y2), 0.8 mM HU or HU+Y27632 after 8 h of culture. The asterisks indicate the zippering point, cyan lines approximate the mid-PNP width. The insets below the HU and HU+Y27632-treated embryos are presented after applying an inverted grey look-up table for phalloidin staining to facilitate visualisation of the rostrocaudal F-actin cables (arrows). Scale bars: 100 µm. (B) Quantification of the proportion of the PNP which extends beyond the rostrocaudal cables (as in Fig. 2B) in each treatment group. (C) Quantification of mid-PNP width in each treatment group. Embryos were analysed at the 20–23 somites stages; vehicle, n=6; Y27632, n=7; HU, n=9; HU+Y27632, n=9. (D,E) Apical areas of neuroepithelial cells were analysed in ZO-1-stained PNPs from (D) vehicle versus HU-treated and (E) 10 µM Y27632- versus HU+Y27632-treated embryos after 8 h of culture. n numbers were: vehicle, n=845 cells from six embryos, HU, n=816 cells from seven embryos; Y2, n=861 cells from six embryos, HU+Y2, n=901 cells from six embryos. NS, not significant; *P<0.05, **P<0.01, ***P<0.001 (tests defined in Materials and Methods).

References

    1. Aigouy B., Umetsu D. and Eaton S. (2016). Segmentation and quantitative analysis of epithelial tissues. Methods Mol. Biol. 1478, 227-239. 10.1007/978-1-4939-6371-3_13 - DOI - PubMed
    1. Alexandre P., Reugels A. M., Barker D., Blanc E. and Clarke J. D. W. (2010). Neurons derive from the more apical daughter in asymmetric divisions in the zebrafish neural tube. Nat. Neurosci. 13, 673-679. 10.1038/nn.2547 - DOI - PubMed
    1. Bush K. T., Lynch F. J., DeNittis A. S., Steinberg A. B., Lee H.-Y. and Nagele R. G. (1990). Neural tube formation in the mouse: a morphometric and computerized three-dimensional reconstruction study of the relationship between apical constriction of neuroepithelial cells and the shape of the neuroepithelium. Anat. Embryol. 181, 49-58. 10.1007/BF00189727 - DOI - PubMed
    1. Cavadino A., Prieto-Merino D., Addor M.-C., Arriola L., Bianchi F., Draper E., Garne E., Greenlees R., Haeusler M., Khoshnood B. et al. (2016). Use of hierarchical models to analyze European trends in congenital anomaly prevalence. Birth Defects Res. A Clin. Mol. Teratol. 106, 480-488. 10.1002/bdra.23515 - DOI - PubMed
    1. Christodoulou N. and Skourides P. A. (2015). Cell-autonomous Ca(2+) flashes elicit pulsed contractions of an apical actin network to drive apical constriction during neural tube closure. Cell Rep. 13, 2189-2202. 10.1016/j.celrep.2015.11.017 - DOI - PubMed

Publication types

MeSH terms