. 2019 Jun 10;10(1):2533.
doi: 10.1038/s41467-019-10498-1.

Neuronal cell-subtype specificity of neural synchronization in mouse primary visual cortex

Affiliations

Neuronal cell-subtype specificity of neural synchronization in mouse primary visual cortex

Ulf Knoblich et al. Nat Commun. .

Abstract

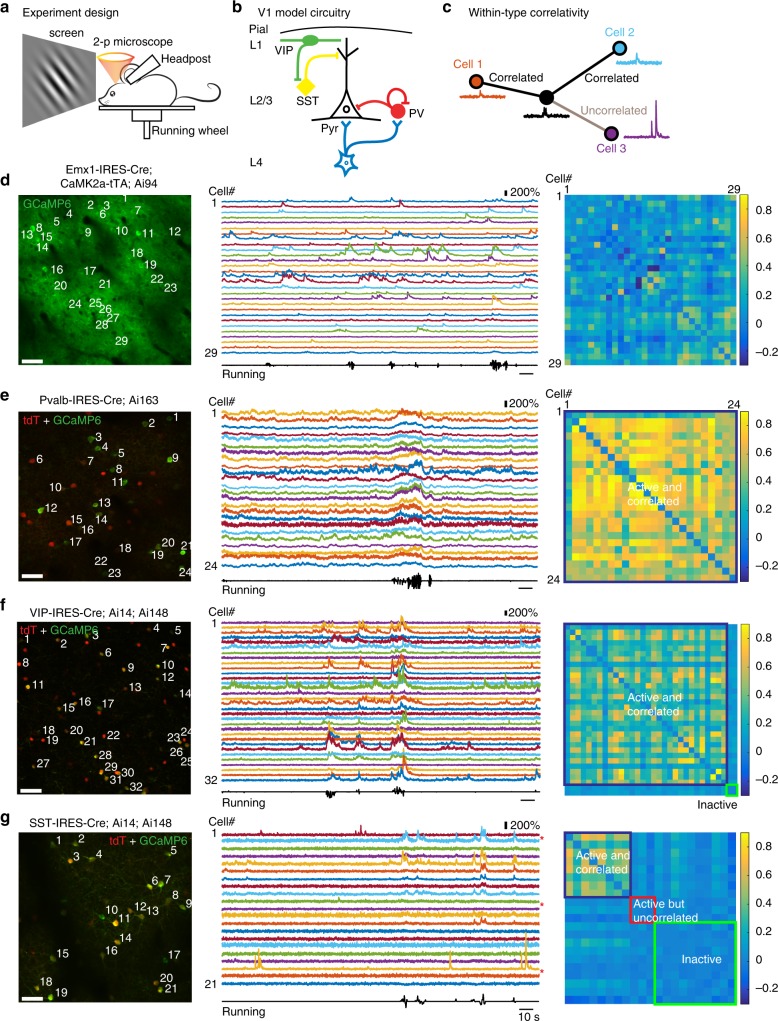
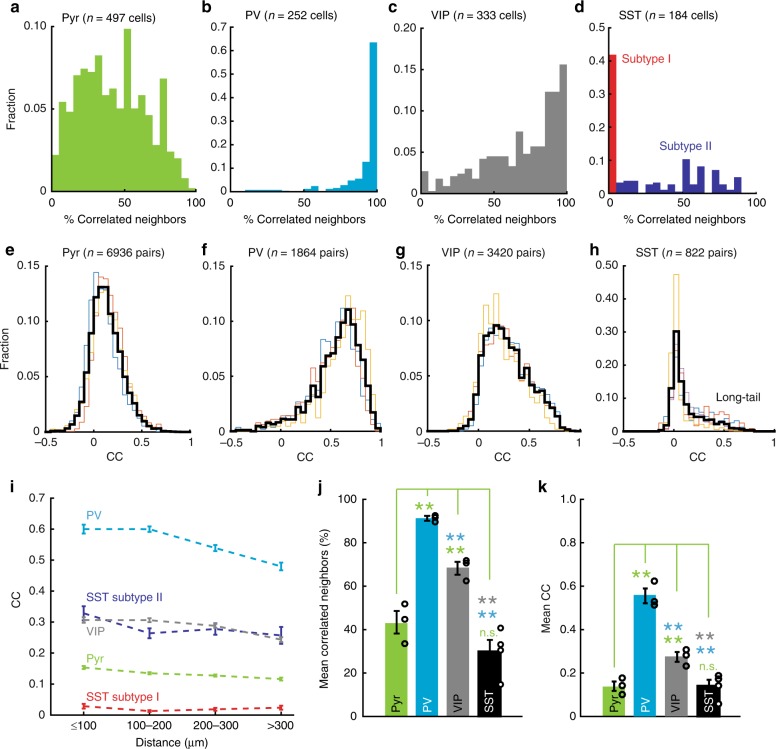
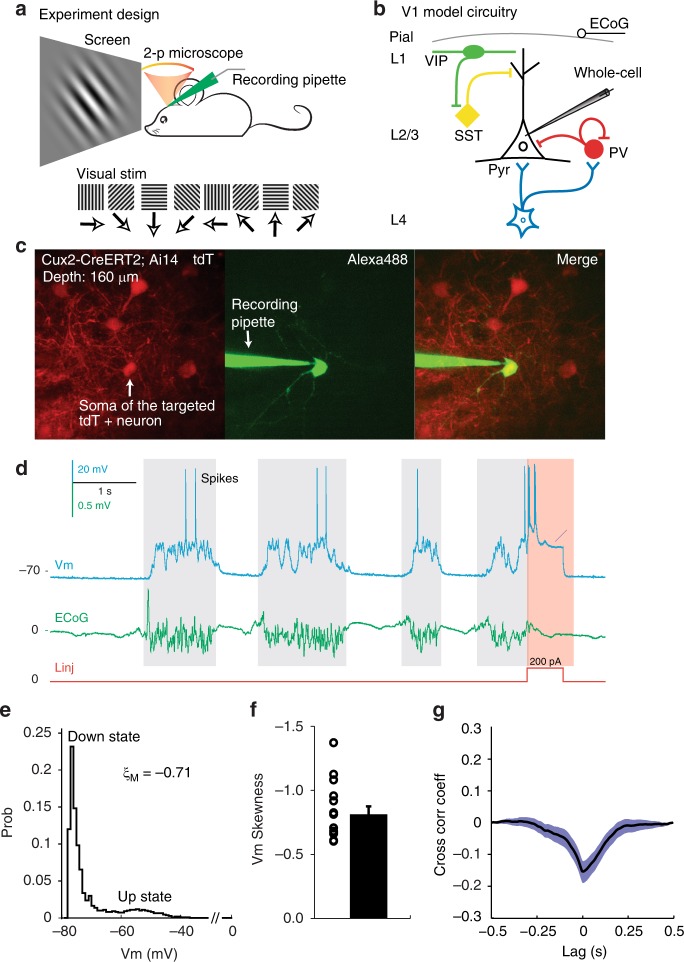
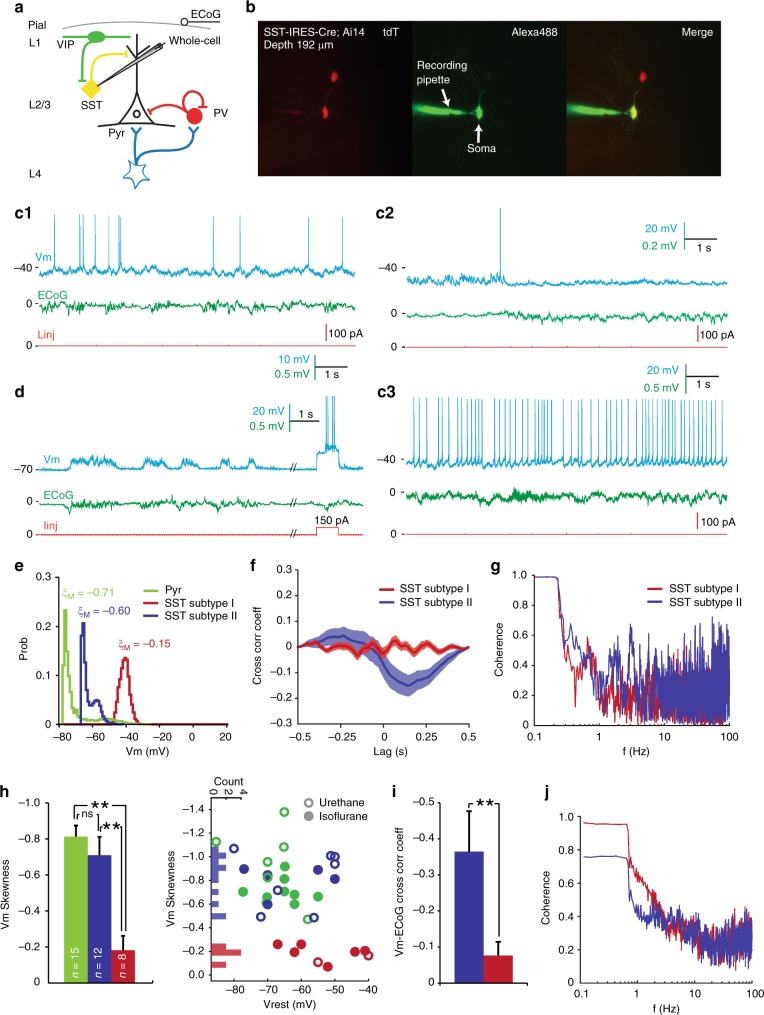
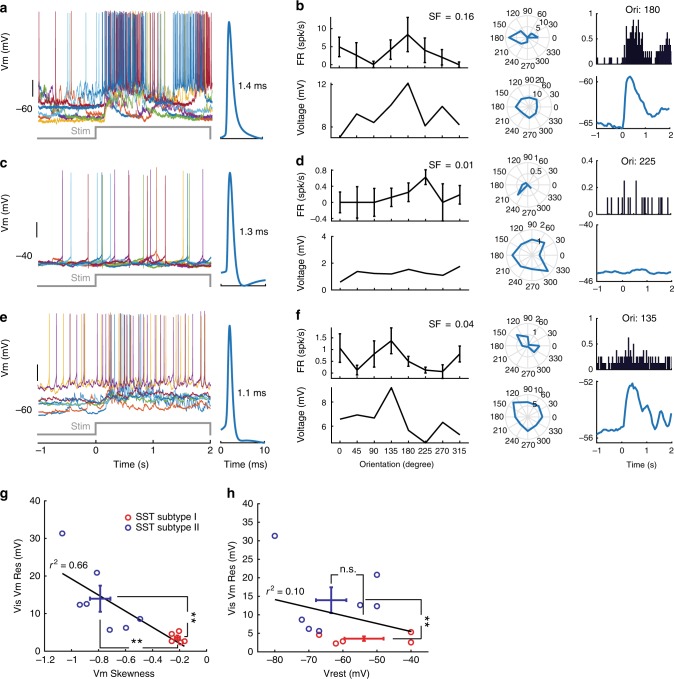
Spatiotemporally synchronised neuronal activity is central to sensation, motion and cognition. Brain circuits consist of dynamically interconnected neuronal cell-types, thus elucidating how neuron types synergise within the network is key to understand the neuronal orchestra. Here we show that in neocortex neuron-network coupling is neuronal cell-subtype specific. Employing in vivo two-photon (2-p) Calcium (Ca) imaging and 2-p targeted whole-cell recordings, we cell-type specifically investigated the coupling profiles of genetically defined neuron populations in superficial layers (L) of mouse primary visual cortex (V1). Our data reveal novel subtlety of neuron-network coupling in inhibitory interneurons (INs). Parvalbumin (PV)- and Vasoactive intestinal peptide (VIP)-expressing INs exhibit skewed distributions towards strong network-coupling; in Somatostatin (SST)-expressing INs, however, two physiological subpopulations are identified with distinct neuron-network coupling profiles, providing direct evidence for subtype specificity. Our results thus add novel functional granularity to neuronal cell-typing, and provided insights critical to simplifying/understanding neural dynamics.


Conflict of interest statement

The authors declare no competing interests.

Figures

Fig. 1
Fig. 1
Novel neuronal cell-subtype specificity of neocortical synchronisation during wakefulness. ac Experimental design. In vivo 2-p Ca imaging (a) was performed in awake, head-fixed transgenic mice to investigate excitatory and three major inhibitory neuron types (b) by characterising the pair-wise, within-type cross-correlation coefficient (CC) profiles (c) in L2/3 of mouse V1. d Example Ca imaging in an awake, head-fixed Emx1-IRES-Cre;CaMK2a-tTA;Ai94 mouse showing spontaneous CC of V1 L2/3 Pyr neurons. Left: Z-projection (time series) of green (GCaMP6s) fluorescence images within the 400 × 400 μm field of view (FOV) at 162 μm underneath the pial surface, numbers indicate individual regions of interest (ROIs) analysed. Scale bar: 50 μm. Middle: ΔF/F traces of 250 s imaging of Pyr neurons as labeled in left panel. Running velocity was displayed at the bottom. Right: Within-type CC matrix of active Pyr neurons within the FOV, constructed from the CCs at zero-time lag of corresponding Pyr pairs. (eg). Example Ca imaging of PV (24 ROIs at 280 μm), VIP (32 ROIs at 160 μm) and SST (21 ROIs at 150 μm) INs, respectively, to demonstrate the cell-subtype specificity. Left panels showed z-projected images of overlaid tdT (Red) and GECI (green) fluorescence signals, the rest were labeled as in d. Red asterisks (*) indicate fluorescently active, but network-uncoupled cells. Note that PV and VIP INs in V1 L2/3 were highly synchronised (e, f) but SST INs showed two subgroups/subtypes (g): One SST subgroup was spontaneously active but uncorrelated to any active SST neighbours (Subtype I, red box in CC matrix in g). Subtype II SST INs, however, were strongly network-coupled (dark blue box in CC matrix in g). For display purposes, CC matrices in f, g were sorted. Fluorescently inactive ROIs (green boxes in CC matrixes) were displayed here but not analysed (but see our electrophysiological data in Figs. 3–5). The mouse image in a was reproduced from Li et al. 2017 Nat Commun. 8:15604. 10.1038/ncomms15604 with permission
Fig. 2
Fig. 2
Population data of neuronal cell-subtype specific correlation. ad Population histograms showing the within-type correlation distributions in Pyr (a), PV (b), VIP (c) and SST (d) neurons, respectively. Each histogram plotted the fraction of active cells against the percentage of correlated active neighbours (see Methods). Note the difference in CC distributions between neuron types: Pyr neurons (a) exhibited a broad and continuous distribution, showing a versatile correlation profile. PV INs (b) were spontaneously active and highly synchronised, almost all PV INs was strongly correlated with every other PV IN in the same FOV. VIP INs (c) were also highly synchronised with each other, significantly stronger than Pyr neurons but weaker than PV INs. SST INs (d), on the other hand, showed a subtype specificity. One subpopulation (red, Subtype I) were spontaneously active, but uncorrelated to nearly any SST neighbours. Subtype II SST cells (dark blue), however, were strongly coupled. eh. CC distributions in Pyr (e), PV (f), VIP (g) and SST (h) neurons, respectively. Thin lines represented data from individual animals. Note the long-tailed distribution in SST INs, which was in line with the existence of two subtypes. i Relationships between CC strengths and corresponding spatial distance in Pyr (green), PV (light blue), VIP (gray) and SST subtype I (red) and II (dark blue) neurons, respectively (two-way ANOVA, p < 0.001). j Average % of correlated neighbours across animals in Pyr (green), PV (light blue), VIP(green) and SST (black) neurons, respectively. Statistical significance was colour-coded. k Average CC in Pyr (green), PV (light blue), VIP(green) and SST (black) neurons, respectively. **p < 0.01, n.s.: not significant. Error bar: s.e.m.
Fig. 3
Fig. 3
Excitatory pyramidal neurons couple strongly with local network dynamics. a, b Experiment design. a L2/3 & 4 tdT+ neurons in mouse V1 were visualised with 2-p microscopy and subjected to targeted whole-cell recordings under anaesthesia. In a subset of animals, ECoG was simultaneous recorded (see Methods). b V1 model circuitry showing four major neuron types: Pyr neurons, SST, PV and VIP INs. c, d Example targeted whole-cell recording of a V1 L2/3 tdT+ Pyr neuron (Pyr#15) in an Isoflurane anaesthetised Cux2-CreERT2;Ai14 mouse. c Z-projection images showing the targeted tdT+ Pyr neuron (left) filled with green fluorescence dye Alexa488 (middle) after whole-cell recording was achieved. The merge view (right) validated the targeted cell (yellow). Recording depth was 160 μm. d Spontaneous Vm data of the Pyr neuron in c and simultaneously recorded ECoG. Note the spontaneous Vm oscillation between the Up (gray shade regions) and Down (the rest) state and faithful correspondence between the Up state of Vm and desynchronised phase of ECoG. High spontaneous Vm-ECoG correlation indicated a dominant network influence on this Pyr neuron under our recording conditions. As a result, brief electrical perturbation by a current step (red shaded region) failed to override the network influence. e Vm skewness ξM of the Pyr neuron shown in c, d, note the skewed, bimodal distribution of Vm. f Population data of Vm skewness ξM of 15 Pyr neurons. g Spontaneous Vm-ECoG cross-correlation of the Pyr neuron shown in c, d Shade area represented s.e.m. Error bar: s.e.m. The mouse image in a was reproduced from Li et al. 2017 Nat Commun. 8:15604. doi: 10.1038/ncomms15604 with permission
Fig. 4
Fig. 4
Targeted whole-cell recording confirms SST subtype specificity in neuron-network coupling. a 2-p targeted whole-cell recording in anaesthetised SST-IRES-Cre;Ai14 mice. b Z-projection images of a L2/3 SST IN (Subtype I, SST#19) recorded at 192 μm. c1–c3 Vm Unimodality and low Vm-ECoG cross-correlation persisted in SST Subtype I INs across Vrest and recording conditions. c1 Spontaneous Vm and simultaneously recorded ECoG traces of a Subtype I SST IN (SST#17) under normal Isoflurane anaesthesia. Vrest was highly depolarised at ~−40 mV. Note the Up-Down brain states were prominent in ECoG but NOT Vm, indicating little network influence on this SST IN under our recording conditions. c2, c3 Spontaneous Vm and ECoG traces of Subtype I SST#16 and #19, respectively. Cells were recorded at different depths of Isoflurane anaesthesia, but Vm unimodality and low Vm-ECoG coupling persisted. d Spontaneous Vm and ECoG traces of a Subtype II SST IN (SST#18) recorded at the same anaesthesia depth as c1. Vrest was at ~−70 mV. Note the good Vm-ECoG correspondence, suggesting dominant network influence. Recording depth: 188 μm. Neurons in c1, c3 and d were from the same animal. e Vm skewness ξM of c1 (red) and d (blue) SST INs, note the different Vm distributions. The Pyr neuron (green) in Fig. 1e was re-plotted for comparison. f Spontaneous Vm-ECoG cross-correlation in c1, d . Shade area represented s.e.m. g Vm- ECoG coherence in c1, d. h Separation of Subtype I and II SST INs by Vm skewness ξM. Left: Population ξM of Pyr, SST Subtype I and II neurons. Right: ξM and Vrest in Pyr, Subtype I and II SST INs. SST Subtype I and II can be separated by ξM, and the separation was independent of Vrest and anaesthesia type. In some cells Vrest was slightly adjusted for display purposes. Open and solid symbols represented data acquired under urethane and Isoflurane anaesthesia, respectively. i, j Vm-ECoG cross-correlation and coherence in Subtype I and II SST neurons, respectively. Figure legends were the same for e–j. **p < 0.01, n.s.: not significant. Error bar: s.e.m.
Fig. 5
Fig. 5
SST subtypes may play different functional roles. a–f Visual responses of example Pyr (a, b), SST Subtype I (c, d) and II (e, f) neurons. a Left: Vm traces of a Cux2 Pyr neuron in response to its preferred drifting grating stimuli (eight repetitions). Time 0 marked the stimulus onset. Right: Average spike shape with FWHM value. Note that visual stimuli brought Vm to the Up state. Due to the spontaneous Up-Down Vm oscillation, the magnitude of Vm deflections depended on the pre-stim Vrest. b Spiking (top row) and Vm (bottom row) responses of the Cux2 cell shown in a. Left and Middle columns: orientation tuning curves of spiking (top) and Vm (bottom) responses at the preferred spatial frequency (SF). Right column: Peri-stimulus time histogram (PSTH) of spiking responses to the preferred grating stimuli (top) and grand average of Vm responses (bottom). Note that Vm response was more broadly tuned than spiking response. c, d Visual responses of an SST Subtype I INs. Note the unimodally distributed Vm. Subtype I usually had low responsiveness to visual stimuli but could be highly spontaneously active. e, f Visual responses of an SST Subtype II INs. Note the bimodally distributed Vm and higher visual responses compared to Subtype I. g Properties of visually evoked Vm deflections confirmed the classification of SST subtypes by Vm dynamics and Vm-ECoG coupling. Visually evoked Vm deflection magnitude (Vis Vm Res) was plotted against Vm Skewness ξM. Subtype I and II SST INs were separated as expected. h No apparent dependence of Vm deflection magnitude on Vrest. **p < 0.01, n.s.: not significant. Error bar: s.e.m.

References

    1. Singer W. Synchronization of cortical activity and its putative role in information processing and learning. Annu. Rev. Physiol. 1993;55:349–374. doi: 10.1146/annurev.ph.55.030193.002025. - DOI - PubMed
    1. Salinas E, Sejnowski TJ. Correlated neuronal activity and the flow of neural information. Nat. Rev. Neurosci. 2001;2:539–550. doi: 10.1038/35086012. - DOI - PMC - PubMed
    1. Buzsáki G, Anastassiou CA, Koch C. The origin of extracellular fields and currents–EEG, LFP and spikes. Nat. Rev. Neurosci. 2012;13:407–420. doi: 10.1038/nrn3241. - DOI - PMC - PubMed
    1. Steinmetz PN, et al. Attention modulates synchronized neuronal firing in primate somatosensory cortex. Nature. 2000;404:187–190. doi: 10.1038/35004588. - DOI - PubMed
    1. Poulet JF, Petersen CC. Internal brain state regulates membrane potential synchrony in barrel cortex of behaving mice. Nature. 2008;454:881–885. doi: 10.1038/nature07150. - DOI - PubMed

Publication types