. 2019 Oct;4(10):1661-1670.
doi: 10.1038/s41564-019-0472-z. Epub 2019 Jun 10.

RocS drives chromosome segregation and nucleoid protection in Streptococcus pneumoniae

Affiliations

RocS drives chromosome segregation and nucleoid protection in Streptococcus pneumoniae

Chryslène Mercy et al. Nat Microbiol. 2019 Oct.

Abstract

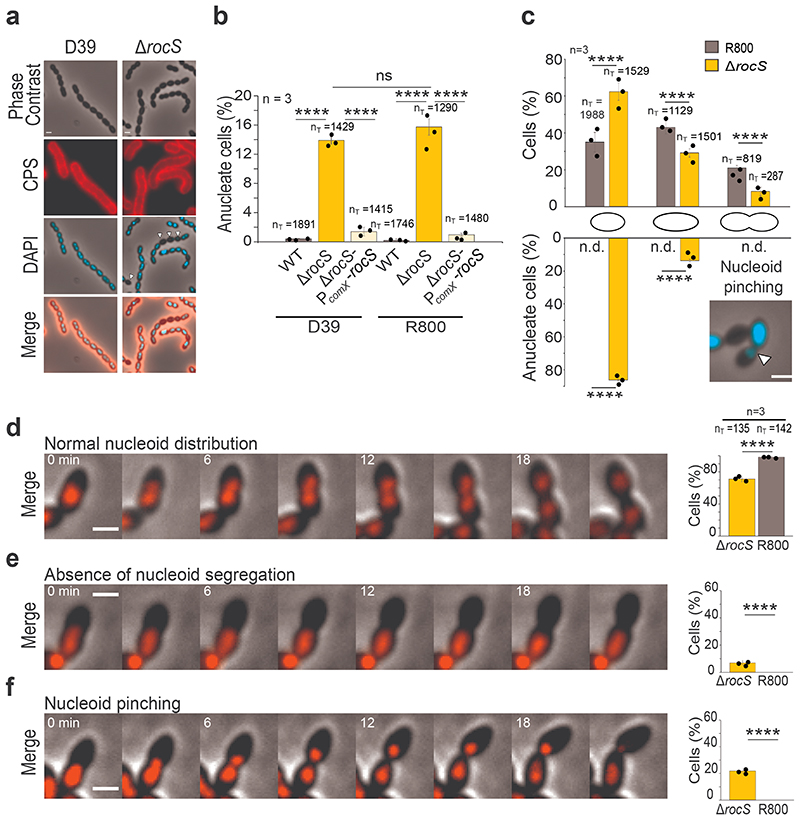
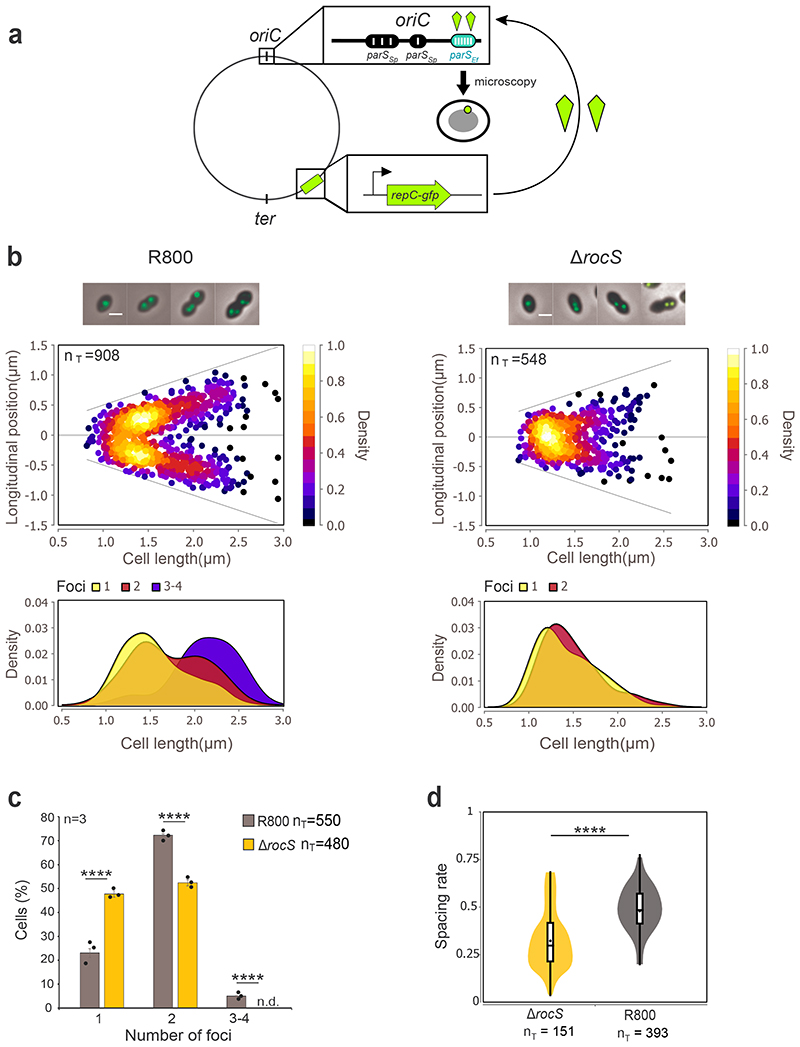
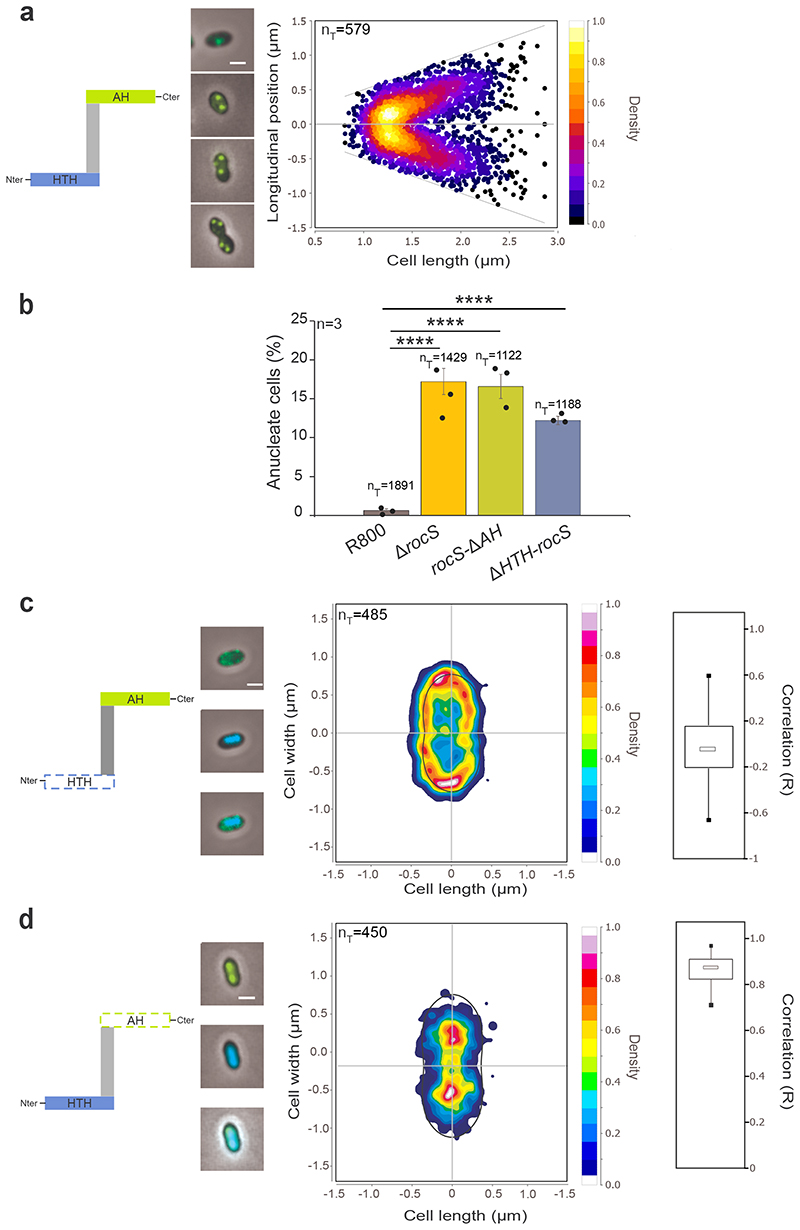
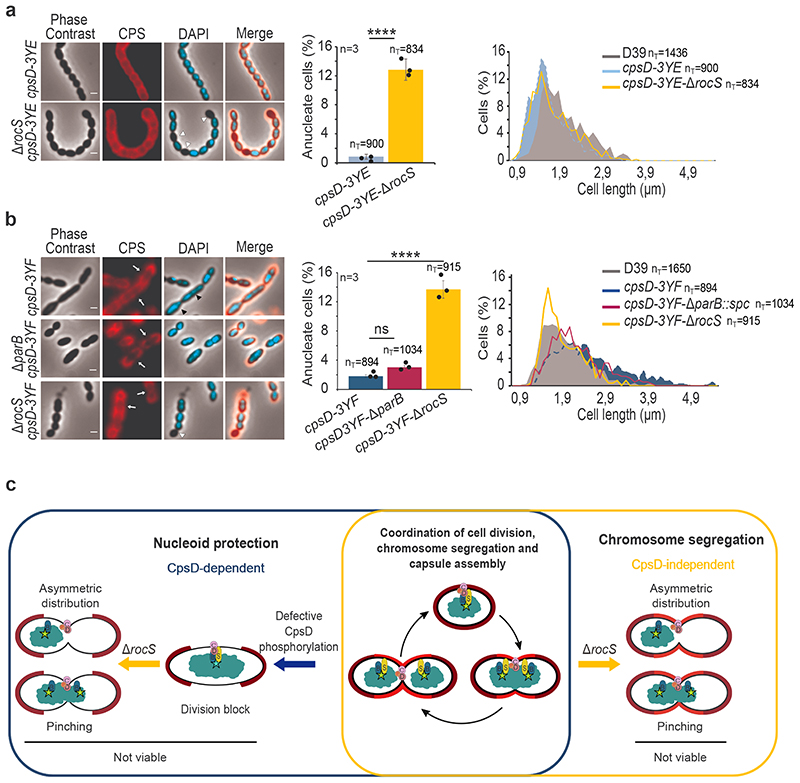
Chromosome segregation in bacteria is poorly understood outside some prominent model strains1-5 and even less is known about how it is coordinated with other cellular processes. This is the case for the opportunistic human pathogen Streptococcus pneumoniae (the pneumococcus)6, which lacks the Min and the nucleoid occlusion systems7, and possesses only an incomplete chromosome partitioning Par(A)BS system, in which ParA is absent8. The bacterial tyrosine kinase9 CpsD, which is required for capsule production, was previously found to interfere with chromosome segregation10. Here, we identify a protein of unknown function that interacts with CpsD and drives chromosome segregation. RocS (Regulator of Chromosome Segregation) is a membrane-bound protein that interacts with both DNA and the chromosome partitioning protein ParB to properly segregate the origin of replication region to new daughter cells. In addition, we show that RocS interacts with the cell division protein FtsZ and hinders cell division. Altogether, this work reveals that RocS is the cornerstone of a nucleoid protection system ensuring proper chromosome segregation and cell division in coordination with the biogenesis of the protective capsular layer.


Conflict of interest statement

Competing interests

The authors declare no competing financial interests.

Figures

Figure 1
Figure 1. Impact of rocS deletion on capsule production and nucleoid distribution.
a. Detection of capsular polysaccharides (CPS) and DNA in D39 and ΔrocS cells. Phase contrast (grey), CPS (red), DAPI (blue) and merged images are shown. Arrowheads indicate anucleate cells. Images are representative of 3 experiments repeated independently. b. Percentage of anucleate cells in D39 and R800 (grey) strains, corresponding ΔrocS mutants (orange) and complemented strains (yellow). c. Percentage of anucleate cells in the course of the cell cycle. R800 (grey) and ΔrocS (orange) cells were sorted into three size groups (small, elongated and constricting cells) as a proxy for their progression in the cell cycle. The percentage of each group and the percentage of anucleate cells in each group are shown respectively in the upper and the lower bar chart. Arrowheads indicate chromosome pinching in constricting cells. n.d.= none detected. d-f. Still images from fluorescence time-lapse microscopy (Supplementary Video 1, 2 and 3) showing (d) a normal nucleoid segregation, (e) an absence of nucleoid segregation, or (f) a nucleoid pinching event during the cell division in WT (d) or ΔrocS cells (e and f) producing HlpA-mKate2. The percentage of each event (normal, absence or pinching) in WT and ΔrocS cells are shown in the corresponding bar chart. Scale bar, 1 μm. In b-f, nT indicates the number of cells analyzed from 3 independent experiments. Bar chart, with data points overlap, represents the mean ± SEM. Two-tailed P-values derived from two-population proportion tests for the following pairs of proportions: Panel b: ‘D39-WT’ vs ‘D39-ΔrocS’ (P<0.0001); ‘D39-ΔrocS’ vs ‘D39-ΔrocS-PcomX-rocS’ (P=2,49.10-12); ‘R800-WT’ vs ‘R800-ΔrocS’ (P<0.0001); ‘R800-ΔrocS’ vs ‘R800-ΔrocS-PcomX-rocS’ (P<0.0001); ‘D39-ΔrocS’ vs ‘R800-ΔrocS’ (P=0.158). Upper panel c: ‘R800-WT’ vs ‘R800-ΔrocS’ small cells (P<0.0001), elongated cells (P<0.0001) and constricting cells (P=7.29.10-12). Lower panel c: ‘R800-WT’ vs ‘R800-ΔrocS’ for small cells (P<0.0001) and elongated cells (P<0.0001). Panel d-f: ‘R800-WT’ vs ‘R800-ΔrocS’ (d) P=2.6.10-15, (e) P=8.2.10-15 and (f) P=3.45.10-5. **** P < 0.0001. ns P > 0.05.
Figure 2
Figure 2. oriC segregation patterns in wild-type and ΔrocS cells.
a. Schematic representation of the Par system used to image the origin of replication (oriC). parS sequences from E. faecalis (parS Ef, blue oval) were inserted into the chromosome near the pneumococcal oriC while the parB homolog repC fused to gfp (RepC-GFP, green kite) is expressed ectopically under the control of the PcomX promoter. Upon loading of RepC-GFP onto parS Ef sites, the localization of oriC is followed by fluorescence microscopy (green dot). parS Sp indicates native pneumococcal parS sites. b. (upper panels) Localization heat maps of oriC (RepC-GFP) positions along the cell length in wild-type and ΔrocS R800 cells. Representative merged images between phase contrast and GFP fluorescence signal of cells with either 1, 2 or 3/4 foci are shown on the top. Scale bar, 1 μm. (lower panels) Kernel density plots of the cell length in relation to the number of foci in wild-type and ΔrocS R800 cells. c. Relative percentages of cells as a function of the number of oriC foci in WT (grey) and ΔrocS (orange) cells. Bar chart, with data points overlap, represents the mean ± SEM. Two-tailed P-values derived from a two-population proportion test for the following pairs of proportions: ‘R800-WT’ vs ‘R800-ΔrocS’ one foci (P<0.0001), two foci (P= 8.9.10-16), three foci (P=1,5.10-10). d. Measurements of the spacing rate (relative distance between 2 foci of oriC in relation to the cell length). Box indicates the 25th to 75th percentile and Whiskers indicate the minimum and the maximum. The mean and the median are indicated with a dot and a line in the box, respectively. Two-tailed P-value derived from a Mann-Whitney test between ‘R800-WT’ and ‘R800-ΔrocS’ is P = 7.9.10-9. **** P < 0.0001. nT indicates the number of cells analyzed. Experiments were performed in triplicate.
Figure 3
Figure 3. Localization of GFP-RocS and derivatives and impact on nucleoid localization.
Schematic representations of RocS and derivatives are shown on the left of panels a, c and d. a. Heat map representing the longitudinal localization of GFP-RocS as a function of the cell length in R800 cells. Representative merged images of cells with either 1, 2 or 3/4 foci are shown on the left. b. Relative percentage of anucleate cells for rocS-ΔAH and ΔHTH-rocS R800 strains. Bar chart, with data points overlap, represents the mean ± SEM. nT indicates the total number of cells analyzed from three independent experiments. Two-tailed P-values derived from a two-population proportion test for the following pairs of proportions: ‘R800-WT’ vs ‘R800-ΔrocS’ (P<0.0001), ‘R800-WT’ vs ‘R800-rocS-ΔAH’ (P<0.0001) and ‘R800-WT’ vs ‘R800-ΔHTH-rocS’ (P<0.0001). **** P<0.0001. c-d. Heat maps representing the 2-dimensional localization patterns of GFP-ΔHTH-RocS (c) and GFP-RocS-ΔAH (d) in R800 cells. Representative overlays of phase contrasts and, GFP or DAPI fluorescence signals, or both signals, are shown on the left. Scale bar, 1 μm. The distribution of the Pearson correlation coefficient (R), measured between the DAPI and GFP signals for each strain are shown as box (25th to 75th percentile) and whisker (minimum and maximum) plots on the right.
Figure 4
Figure 4. Deletion of rocS in phospho-ablative and phospho-mimetic CpsD mutants and model for the RocS nucleoid protection system.
Detection of CPS and DNA in (a) cpsD-3YE and cpsD-3YE-ΔrocS and (b) cpsD-3YF, cpsD-3YF- ΔparB and cpsD-3YF-ΔrocS. Phase contrast (grey), CPS (red), DAPI (blue) and merged images are shown on the left. White arrows show CPS production defects, white arrowheads show anucleate cells and black arrowheads show nucleoid segregation defects. Scale bar, 1 μm. The corresponding percentage of anucleate cells are shown as bar charts. Bar chart, with data points overlap, represents the mean ± SEM. Two-tailed P-values derived from a two-population proportion test for the following pairs of proportions:: ‘cpsD-3YE’ vs ‘cpsD-3YE-ΔrocS ‘(P<0.0001), ‘cpsD-3YF’ vs ‘cpsD-3YFrocS’ (P=1.9.10-13) and ‘cpsD-3YF’ vs ‘cpsD-3YFparB’ (P=1.2). ****: P < 0.0001. ns P >0.05. The corresponding distribution of the cell length are shown on the right as histograms. nT indicates the number of cells analyzed from 3 independent experiments and standard errors are indicated with error bars. c. Model for the nucleoid protection system coordinating capsule synthesis, chromosome segregation and cell division. Non-phosphorylated CpsD hinders both capsule synthesis and chromosome segregation inducing a division block. The deletion of rocS alleviates the division block and results in uncontrolled cell constriction with improper chromosome segregation (pinching and asymmetric distribution) leading to non-viable progeny. ParB, RocS, CpsD and its transmembrane activator CpsC are indicated by blue, yellow, brown and pink circles, respectively. Red “P” and the turquoise star indicate CpsD autophosphorylation and the oriC region, respectively. Capsule is shown in light (new capsule produced during cell division) and dark (inherit from the mother cell) red.

References

    1. Toro E, Shapiro L. Bacterial chromosome organization and segregation. Cold Spring Harb Perspect Biol. 2010;2:a000349. doi: 10.1101/cshperspect.a000349. - DOI - PMC - PubMed
    1. Reyes-Lamothe R, Nicolas E, Sherratt DJ. Chromosome replication and segregation in bacteria. Annu Rev Genet. 2012;46:121–143. doi: 10.1146/annurev-genet-110711-155421. - DOI - PubMed
    1. Wang X, Montero Llopis P, Rudner DZ. Organization and segregation of bacterial chromosomes. Nat Rev Genet. 2013;14:191–203. doi: 10.1038/nrg3375. - DOI - PMC - PubMed
    1. Badrinarayanan A, Le TB, Laub MT. Bacterial chromosome organization and segregation. Annu Rev Cell Dev Biol. 2015;31:171–199. doi: 10.1146/annurev-cellbio-100814-125211. - DOI - PMC - PubMed
    1. Bohm K, et al. Novel Chromosome Organization Pattern in Actinomycetales-Overlapping Replication Cycles Combined with Diploidy. mBio. 2017;8 doi: 10.1128/mBio.00511-17. - DOI - PMC - PubMed

Publication types

MeSH terms

Substances