. 2019 Sep;4(9):1545-1557.
doi: 10.1038/s41564-019-0479-5. Epub 2019 Jun 10.

DNA-uptake pili of Vibrio cholerae are required for chitin colonization and capable of kin recognition via sequence-specific self-interaction

Affiliations

DNA-uptake pili of Vibrio cholerae are required for chitin colonization and capable of kin recognition via sequence-specific self-interaction

David W Adams et al. Nat Microbiol. 2019 Sep.

Abstract

How bacteria colonize surfaces and how they distinguish the individuals around them are fundamental biological questions. Type IV pili are a widespread and multipurpose class of cell surface polymers. Here we directly visualize the DNA-uptake pilus of Vibrio cholerae, which is produced specifically during growth on its natural habitat-chitinous surfaces. As predicted, these pili are highly dynamic and retract before DNA uptake during competence for natural transformation. Interestingly, DNA-uptake pili can also self-interact to mediate auto-aggregation. This capability is conserved in disease-causing pandemic strains, which typically encode the same major pilin subunit, PilA. Unexpectedly, however, we discovered that extensive strain-to-strain variability in PilA (present in environmental isolates) creates a set of highly specific interactions, enabling cells producing pili composed of different PilA subunits to distinguish between one another. We go on to show that DNA-uptake pili bind to chitinous surfaces and are required for chitin colonization under flow, and that pili capable of self-interaction connect cells on chitin within dense pili networks. Our results suggest a model whereby DNA-uptake pili function to promote inter-bacterial interactions during surface colonization. Moreover, they provide evidence that type IV pili could offer a simple and potentially widespread mechanism for bacterial kin recognition.


Conflict of interest statement

Competing interests

The authors declare no competing interests.

Figures
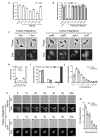
Figure 1
Figure 1. Direct observation of dynamic DNA-uptake pili.
(A) Functionality of PilA cysteine variants (PilA[Cys]) in a chitin-independent transformation assay using strains carrying an arabinose-inducible copy of tfoX (TntfoX). Transformation frequencies are the mean of three independent biological repeats (+S.D.). < d.l., below detection limit. †, < d.l. in one repeat. (B) Effect of PilA cysteine variants on the ability of retraction deficient (TntfoX, ΔpilT) cells to aggregate. Aggregation is shown as the ratio of the culture optical density (O.D. 600) before and after vortexing, in the absence (- Ara) and presence (+ Ara) of tfoX induction, as indicated. Values are the mean of three independent biological repeats (±S.D.). (C-G) Snapshot imaging of pili in cells of A1552-TntfoX, PilA[S67C] and its derivatives. (C) Cells of A1552-TntfoX, PilA[S67C] were grown in the absence (- Ara) and presence (+ Ara) of tfoX induction, as indicated, and stained with AF-488-Mal. Bar = 5 µm. (D-E) Cells of A1552-TntfoX, PilA[S67C] were grown in the presence of tfoX induction and stained with AF-488-Mal in a (D) ΔpilB, (E) ΔpilQ, (F) ΔpilU and (G) ΔpilT background, as indicated. Bar = 5 µm. (H-J) Quantification of piliation in snapshot imaging. Bars represent the mean of three repeats (±S.D.). (H) Percentage of piliated cells in the indicated backgrounds. n = c.a. 2000 cells per strain per repeat. (I) Histogram of number of pili per cell in piliated cells in WT parent (A1552-TntfoX, PilA[S67C]), ΔpilU (A1552-TntfoX, PilA[S67C], ΔpilU) and ΔpilT (A1552-TntfoX, PilA[S67C], ΔpilT) backgrounds, as indicated. n = c.a. 300 cells per strain per repeat. (J) Histogram of pilus length in cells of A1552-TntfoX, PilA[S67C]. n = c.a. 500-600 cells per repeat. (K-L) Time-lapse series of pilus dynamics in (K) WT parent (A1552-TntfoX, PilA[S67C]) and (L) ΔpilT (A1552-TntfoX, PilA[S67C], ΔpilT) backgrounds. Cells were stained with AF-488-Mal and imaged at 10s intervals for 1 minute. Upper panels show phase-contrast (PC), lower panels show fluorescence (dye). Time in seconds (s), as indicated. Bars = 5 µm. (M) Histogram showing quantification of pili produced per cell per min in the WT parent (A1552-TntfoX, PilA[S67C]) background. Bars represent the mean of three repeats (±S.D.). n = c.a. 500-700 cells per repeat.
Figure 2
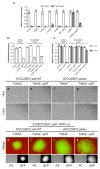
Figure 2. Competent cells auto-aggregate in the absence of pilus retraction.
(A-C) Phase-contrast microscopy of cells of strains (A) A1552-TntfoX, (B) A1552-TntfoX, ΔpilT and (C) A1552-TntfoX, ΔpilT, pilT+, grown in the absence (- Ara) and presence (+ Ara) of tfoX induction, as indicated. PilT complementation (pilT+) was achieved by placing an intact copy of pilT driven by its native promoter at a neutral ectopic locus. Scale bar = 25 µm. (D-E) Aggregation and transformation frequency of cells of strains A1552-TntfoX, A1552-TntfoX, ΔpilT and A1552-TntfoX, ΔpilT, pilT+, grown in the absence (- Ara) and presence (+ Ara) of tfoX induction, as indicated. A1552 (without inducible tfoX) was used as a negative control. (D) Aggregation is shown as the ratio of the culture optical density (O.D. 600) before and after vortexing. Values are the mean of three repeats (±S.D.). (E) Chitin-independent transformation frequency assay. Values are the mean of three repeats (+S.D.). < d.l., below detection limit. (F) Effect of various deletion backgrounds on the ability of retraction deficient cells to aggregate. Aggregation is shown as the ratio of the culture optical density (O.D. 600) before and after vortexing, in the absence (- Ara) and presence (+ Ara) of tfoX induction, as indicated. Δ4 = ΔtcpA, ΔmshA, ΔvpsA, ΔflaA quadruple mutant. Values are the mean of three repeats (±S.D.). (G-I) Co-culture of fluorescent ΔpilT cells (A1552-TntfoX, ΔpilT, GFP+) producing GFP and non-fluorescent cells of the (G) WT parent (A1552-TntfoX), (H) ΔpilT (A1552-TntfoX, ΔpilT) and (I) ΔpilA, ΔpilT (A1552-TntfoX, ΔpilA, ΔpilT), grown in the presence of tfoX induction. Merged images show GFP in green and phase-contrast in red. Bar = 25 µm.
Figure 3
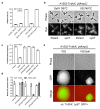
Figure 3. A1552 PilA is sufficient for aggregation in a non-pandemic strain.
(A) Aggregation of representative 7th pandemic strains of V. cholerae, including the effect of hapRRep on N16961, in a TntfoX and a TntfoX, ΔpilT background, as indicated. Aggregation is shown as the ratio of the culture optical density (O.D. 600) before and after vortexing, in the presence of tfoX induction. Values are the mean of three repeats (±S.D.). (B-C) Transformation frequency and aggregation of V. cholerae strain ATCC25872-TntfoX compared to that of A1552-TntfoX. (B) Chitin-independent transformation assay. Transformation frequencies are the mean of three repeats (+S.D.). (C) Aggregation is shown as the ratio of the culture optical density (O.D. 600) before and after vortexing, in the absence (- Ara) and presence (+ Ara) of tfoX induction, as indicated. Values are the mean of three repeats (±S.D.). (D-G) Phase-contrast microscopy of ATCC25872-TntfoX, ΔvpsA cells carrying (D and E) their native pilA (pilA WT) and (F and G) A1552 pilA (pilAex), in a (D and F) pilT+ and (E and G) ΔpilT background, as indicated. Strains were cultured in the absence (- Ara) and presence (+ Ara), as indicated. Bar = 25 µm. Note that ATCC25872 derivatives were co-deleted for vpsA to rule out any compounding effects of biofilm formation. (H-K) Co-culture of fluorescent cells of A1552-TntfoX, ΔpilT, GFP+, producing GFP, and non-fluorescent cells of ATCC25872-TntfoX, ΔvpsA carrying (H and I) their native pilA (pilA WT) and (J and K) A1552 PilA (pilAex), in a (H and J) pilT+ and (I and K) ΔpilT background, as indicated. Cells were grown in the presence of tfoX induction. Merged images show GFP in green and phase-contrast (PC) in red. Bar = 25 µm.
Figure 4
Figure 4. PilA variability governs auto-aggregation and enables kin-recognition.
(A) Consensus neighbour-joining phylogenetic tree of PilA. The tree consists of the 56 unique PilA sequences identified from NCBI, 22 sequences from an in-house collection of various environmental and patient isolates (bold), and A1552 PilA (blue) and MshA (outgroup). Values shown are consensus support values (%). Aggregation capable (green) and incapable (red) PilAs tested in the pilArep experiments are highlighted. Note that ATCC25872 and V52 PilA are identical. (B-C) Functionality of A1552-TntfoX, pilArep[A1552] and 16 different PilA variants assessed by transformation and aggregation. (B) Chitin-independent transformation frequency assay. WT parent (A1552-TntfoX) and ΔpilA (A1552-TntfoX, ΔpilA) strains served as positive and negative controls. Transformation frequencies are the mean of three repeats (+S.D.). †, <d.l. in one repeat. (C) Aggregation was determined for the WT parent and each pilArep strain in a pilT+ (A1552-TntfoX) and ΔpilT (A1552-TntfoX, ΔpilT) background, as indicated. Aggregation is shown as the ratio of the culture optical density (O.D. 600) before and after vortexing, in the presence of tfoX induction. Values are the mean of three repeats (±S.D.). (D) Interaction matrix showing the results of a pairwise analysis of all possible interactions between aggregation-proficient PilA variants. Interactions were tested by co-culturing non-fluorescent cells of the relevant TntfoX, ΔpilT, pilArep[XX] strains with a fluorescent (GFP+) derivative of each strain. Cells were grown in the presence of tfoX induction. Self-self combinations served as controls. (E-G) Representative examples of (E) interaction, resulting in well-mixed aggregates (F) no interaction, resulting in fluorescent or non-fluorescent aggregates and (G) intermediate interactions, resulting in patterned aggregates. Merged images show GFP in green and phase-contrast (Phase) in red. Bar = 25 µm.
Figure 5
Figure 5. The unusual tail of ATCC25872/V52 PilA inhibits aggregation.
(A) Quantification of piliation in snapshot imaging of cells of strains A1552-TntfoX, pilArep[A1552; S67C], A1552-TntfoX, pilArep[Sa5Y; S67C] and A1552-TntfoX, pilArep[V52; N67C], in the indicated backgrounds. Cells were grown with tfoX induction and pili stained with AF-488-Mal. Bars represent the mean of three repeats (±S.D.). n = c.a. 2000 cells per strain per repeat. (B) Direct observation of pili stained with AF-488-Mal in cells carrying pilArep[Sa5Y; S67C] and pilArep[V52; N67C], in a WT parent (A1552-TntfoX) and ΔpilT (A1552-TntfoX, ΔpilT) background, as indicated. Bar = 5 µm. (C-D) Functionality of pilArep tail variants assessed by natural transformation and aggregation. (C) Chitin-independent transformation assay. WT parent (A1552-TntfoX) and ΔpilA (A1552-TntfoX, ΔpilA) strains served as positive and negative controls. Transformation frequencies are the mean of three repeats (+S.D.). (D) Aggregation was determined for the WT parent and each pilArep strain in a pilT+ (A1552-TntfoX) and ΔpilT (A1552-TntfoX, ΔpilT) background, as indicated. Aggregation is shown as the ratio of the culture optical density (O.D. 600) before and after vortexing, in the presence of tfoX induction. Values are the mean of three repeats (±S.D.). (E) Co-culture of fluorescent cells of A1552-TntfoX, ΔpilT, GFP+, producing GFP, and non-fluorescent cells of either pilArep[V52] (A1552-TntfoX, ΔpilT, pilArep[V52]) or pilArep[V52Δtail] (A1552-TntfoX, ΔpilT, pilArep[V52Δtail]), as indicated. Note that ATCC25872 and V52 PilA are identical. Cells were grown in the presence of tfoX induction. Merged images show GFP in green and phase-contrast in red. Bar = 25 µm.
Figure 6
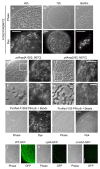
Figure 6. DNA-uptake pili form networks on chitin surfaces.
(A-C) DNA-uptake pili composed of A1552-PilA form networks naturally on chitin surfaces. Chitin beads were stained with AF-488-Mal after incubation for either 48h (A) or 72h (B and C) in defined artificial seawater (DASW) with cells of A1552-PilA[S67C], as indicated. Panel (C) depicts a piece of detached biofilm-like material; note the retention of the pilus networks. Bars = 25 µm. (D-G) The ability to form pilus networks is dependent on the ability to self-interact. Chitin beads were stained with AF-488-Mal after incubation for 48h in DASW with cells of either (D) A1552-pilArep[A1552; S67C] or (F) A1552-pilArep[V52; N67C], as indicated. Panels (E and G) show enlargements of the boxed regions of the surfaces shown in (D and F). Note the absence of large pili networks in (G). Bars = 25 µm (D, F) and 5 µm (E, G). (H-I) DNA-uptake pili bind to chitin surfaces. Chitin beads were stained with AF-488-Mal after incubation for 1h with purified DNA-uptake pili composed of either (H) A1552-PilA; [S67C] or (I) V52-PilA; [N67C], as indicated. Bar = 25 µm. (J-L) DNA-uptake pili are required for chitin colonisation under flow. Chitin beads were imaged after incubation in DASW for 48h under conditions of continuous mixing with GFP+ cells of strains (J) A1552-GFP (WT-GFP), (K) A1552-GFP, ΔpilApilA-GFP) and (L) A1552-GFP, ΔmshAmshA-GFP), as indicated. Bar = 50 µm.

Comment in

  • Settling down on chitin.
    Du Toit A. Du Toit A. Nat Rev Microbiol. 2019 Sep;17(9):527. doi: 10.1038/s41579-019-0237-y. Nat Rev Microbiol. 2019. PMID: 31289382 No abstract available.

References

    1. Maier B, Wong GCL. How Bacteria Use Type IV Pili Machinery on Surfaces. Trends in microbiology. 2015;23:775–788. doi: 10.1016/j.tim.2015.09.002. - DOI - PubMed
    1. Berry JL, Pelicic V. Exceptionally widespread nanomachines composed of type IV pilins: the prokaryotic Swiss Army knives. FEMS microbiology reviews. 2015;39:134–154. doi: 10.1093/femsre/fuu001. - DOI - PMC - PubMed
    1. Giltner CL, Nguyen Y, Burrows LL. Type IV pilin proteins: versatile molecular modules. Microbiology and molecular biology reviews : MMBR. 2012;76:740–772. doi: 10.1128/MMBR.00035-12. - DOI - PMC - PubMed
    1. Chang YW, et al. Architecture of the type IVa pilus machine. Science. 2016;351:aad2001. doi: 10.1126/science.aad2001. - DOI - PMC - PubMed
    1. Craig L, et al. Type IV pilus structure by cryo-electron microscopy and crystallography: implications for pilus assembly and functions. Molecular cell. 2006;23:651–662. doi: 10.1016/j.molcel.2006.07.004. - DOI - PubMed

Publication types

LinkOut - more resources