. 2019 Jul;22(7):1132-1139.
doi: 10.1038/s41593-019-0413-4. Epub 2019 Jun 10.

State-dependent decoupling of sensory and motor circuits underlies behavioral flexibility in Drosophila

Affiliations

State-dependent decoupling of sensory and motor circuits underlies behavioral flexibility in Drosophila

Jan M Ache et al. Nat Neurosci. 2019 Jul.

Abstract

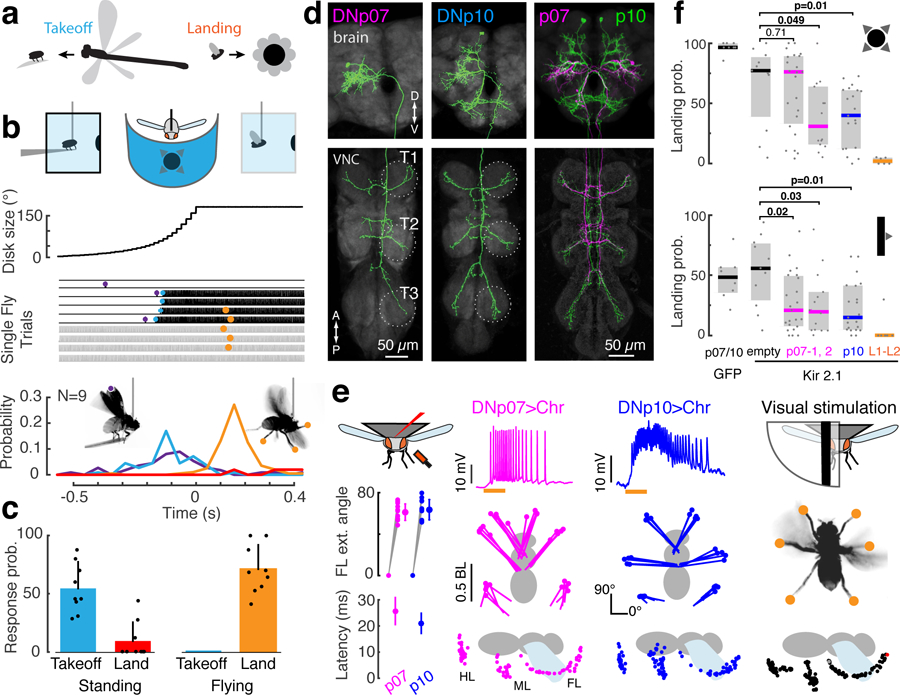
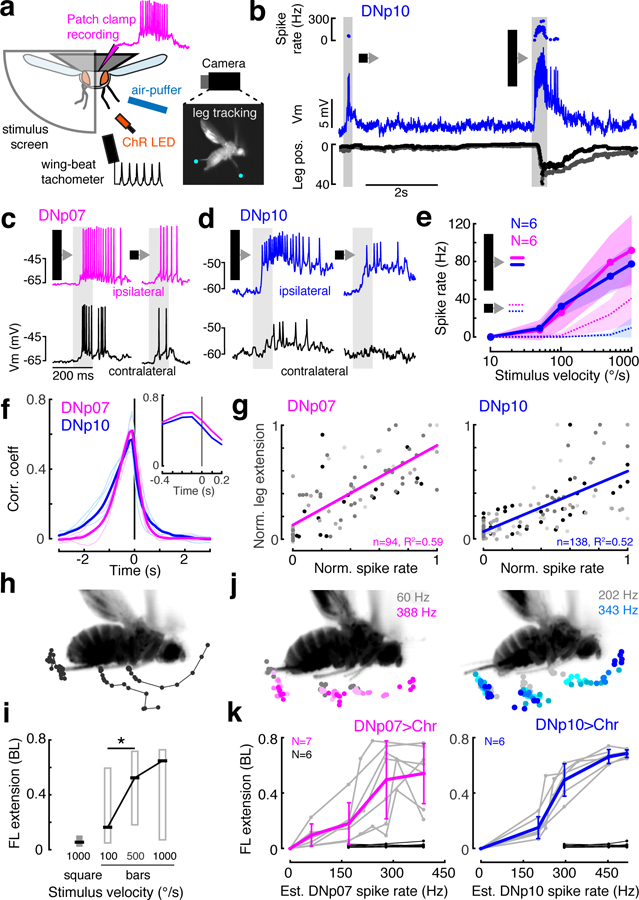
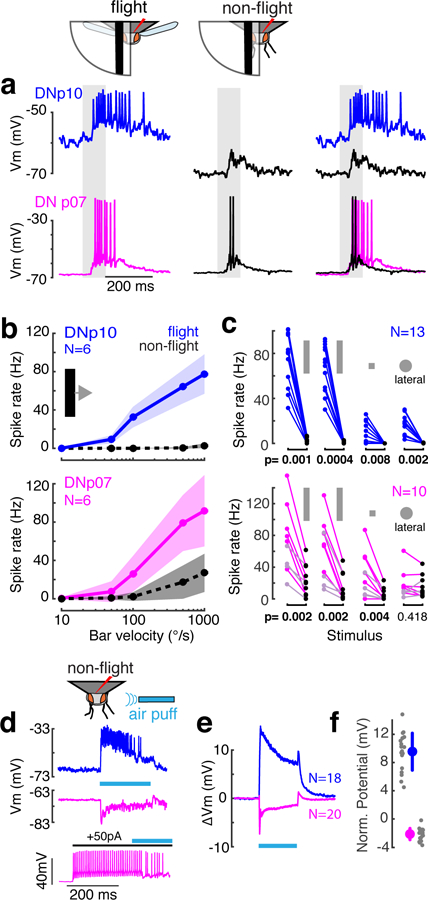
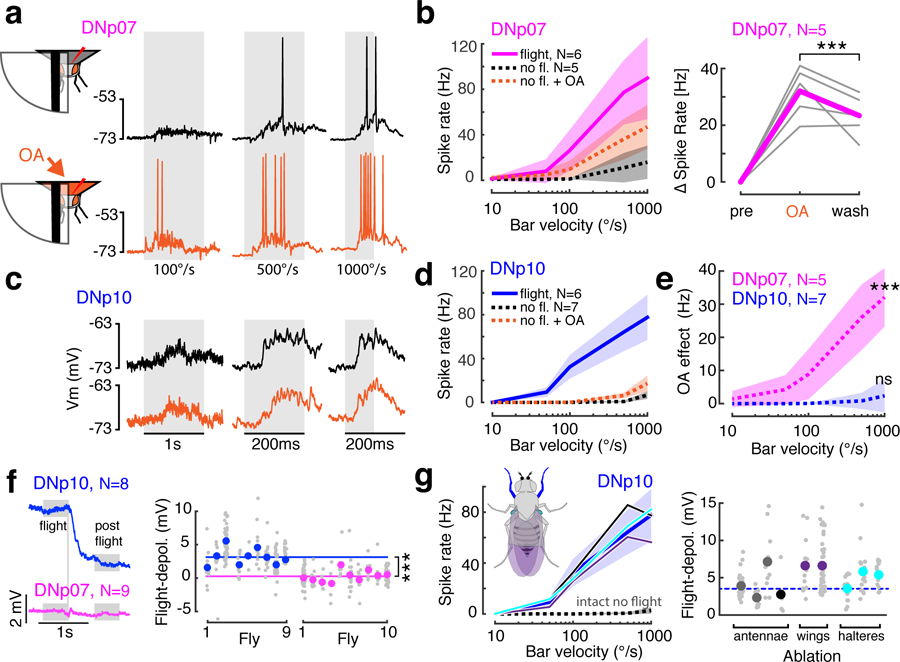
An approaching predator and self-motion toward an object can generate similar looming patterns on the retina, but these situations demand different rapid responses. How central circuits flexibly process visual cues to activate appropriate, fast motor pathways remains unclear. Here we identify two descending neuron (DN) types that control landing and contribute to visuomotor flexibility in Drosophila. For each, silencing impairs visually evoked landing, activation drives landing, and spike rate determines leg extension amplitude. Critically, visual responses of both DNs are severely attenuated during non-flight periods, effectively decoupling visual stimuli from the landing motor pathway when landing is inappropriate. The flight-dependence mechanism differs between DN types. Octopamine exposure mimics flight effects in one, whereas the other probably receives neuronal feedback from flight motor circuits. Thus, this sensorimotor flexibility arises from distinct mechanisms for gating action-specific descending pathways, such that sensory and motor networks are coupled or decoupled according to the behavioral state.


Conflict of interest statement

Competing interests

The authors declare no competing interests.

Figures

Fig. 1.
Fig. 1.. Two identified DN types contribute to visually-evoked landing responses in Drosophila
(a) Visual looming patterns on the fly’s eye can derive from different sources, including predation or self-motion towards objects. (b) Behavioral responses of tethered flies to a looming disk stimulus (r/v = 80 ms) displayed in the frontal visual field. For single trials, vertical dashes indicate wing beats; purple, start of wing-raising; blue, flight start; orange, landing response; red line, landing probability in non-flight bouts. (c) Takeoff or landing probability given the fly’s behavioral state (perching or flying). Dots, individuals; bars, mean + SD; n = 25 trials each from N = 9 flies. (d) Aligned confocal images of DNp07 and DNp10 anatomy. T1–3: segmental thoracic ganglia. Similar results were obtained from N = 4 flies per DN. (e) Optogenetic activation of DNp07 or DNp10 drove landing responses in flying flies. Left column: mean ± SD front leg extension angle (top, n = 12 front legs from N = 6 flies), and movement latency after LED on (bottom, n = 21 trials, N = 7 flies). Middle columns: DN membrane potential (top; orange, 50 ms LED on), and ventral (middle) or saggital (bottom) views. Dots, leg tips at peak extension (middle, N = 1 fly, n = 5 trials) or every 5 ms (bottom; single trial). The LED was on for 300 ms (ventral views) or 50 ms (saggital views). BL, body length; FL/ML/HL, front/middle/hind leg. Right column, Leg extension in response to unilateral expansion stimuli (10° wide bar, 1000°/s front-to-back; see also Supplementary Figure 4). (f) Landing response probability (median ± IQR; dots, individual flies) for frontal looming (top, r/v=80 ms) and unilateral expansion (bottom, 500°/s front-to-back moving bars) after silencing by Kir2.1 channel expression (p07: left, DNp07-split-GAL4–2, right, DNp07-split-GAL4–1; for other genotypes see Methods); Two-sided Wilcoxon rank sum test. NGFP = 8 flies; Nempty = 11; Np07_2 = 23; Np07_1 = 14, N p10 = 21; NL1–L2 = 6.
Fig. 2.
Fig. 2.. Landing DNs respond to visual stimuli and control leg extension amplitude.
(a) in vivo fly patch-clamp electrophysiology setup. (b) Example DNp10 recording with simultaneous leg tracking; top, instantaneous spike rate; middle: DNp10 membrane potential; bottom, horizontal deviation of each middle leg. (c–d) DNp07 (c) and DNp10 (d) activity during 10°-wide bar (left) or 10°x10° square (right) stimulus moving front-to-back at 1000°/s. (e) Mean ± SD DN responses to ipsilateral front-to-back motion of bars (solid lines) and small squares (dashed lines). (f) Cross-correlation of spike rate and middle leg movement (see Supplementary Figure 6c). Thin lines, individuals; thick lines, means for N = 4 flies. The average cross-correlation peaked at −100 ms in both DNs (inset). (g) Correlation of normalized mean DN spike rates with peak leg extension amplitude for individual trials. Gray levels, different flies; lines, linear fits. (h) Example leg movement response to 1000°/s bar; dots, leg tip positions every 5 ms until peak. (i) Box plots (median ± IQR) of leg extension amplitude in response to front-to-back motion (°/s), *p=0.038 (two-sided Wilcoxon rank sum test), nsquare = 21, nbar100 = 38, nbar500 = 39, nbar1000 = 38 trials, N = 5 flies. (j) Peak ipsilateral leg tip positions. Color, estimated optogenetically-activated DN spike rate (see Supplementary Figure 7); single fly example. (k) Peak leg extension as a function of estimated activated DN spike rate. Gray, individuals; colored, mean ± SD. Black, empty-split-GAL4>UAS-CsChrimson control flies. Note, these are plotted for the three highest light intensities/est. spike rates, though they are not expected to exhibit DNp07 or DNp10 spikes. n, number of trials; N, number of flies.
Fig. 3:
Fig. 3:. Visual responses of landing DNs are gated by flight.
(a) Example DNp10 and DNp07 responses to ipsilateral front-to-back bar motion (1000°/s, gray shading) during flight (colors) and non-flight bouts (black); Vm, membrane potential. Right column, overlay. (b) Mean ± SD DN responses to bars with different velocities. (c) Individual mean DN response to visual stimuli in flight (colored dots) and non-flight (black dots) bouts. Stimuli (left to right) were 1000°/s bar, 500°/s bar, 1000°/s square, all moving front-to-back, and a lateral loom with r/v = 10 (azimuth 45°, elevation 45°). DNp07 light-colored dots, contralateral recordings, all others ipsilateral; p-values, two-sided Wilcoxon-Signed Rank test. (d) Example DN responses to mechanosensory stimulation by air puffs (cyan line). DNp10 (top) was excited, whereas DNp07 (middle) was inhibited strongly enough to inhibit spiking (bottom). All data in d-f from non-flying flies. (e) Mean DN membrane potential during air puff stimulation. (f) Individual (gray) and grand means ± SD (large dots) of membrane potential during last 900 ms of air puff. Sample sizes as in e. N, number of recordings from different flies
Fig. 4:
Fig. 4:. Decoupling of visual and motor circuits is achieved by different mechanisms in the two landing DN types.
(a) Example DNp07 responses to front-to-back moving bars in non-flying flies before (black) or during (orange) brain perfusion with octopamine (OA). Gray shading, stimuli. (b) Left, mean ± SD DNp07 responses to moving front-to-back bars of different speeds during flight, non-flight, and non-flight with OA conditions. Right, DNp07 change in spike rate compared to pre-OA condition for responses to 1000°/s front-to-back moving bar under OA and post-OA washout conditions, ***p = 0.0014, paired two-sided Wilcoxon signed rank test, n = 34 trials/condition). Gray, individual means; magenta, grand mean. (c–d) Example DNp10 before and during OA application (plot details as in a-b). (e) Quantification of OA effect in non-flying flies (mean ± SD across N flies), calculated as mean response with OA minus response before OA. ***, p= 7.63*10−10, two-sided Wilcoxon rank sum test, n = 29 trials before, and n = 44 trials during OA application. n.s., p = 0.24, two-sided Wilcoxon rank sum test, n = 45 trials before, and n = 71 trials during OA application. (f) DNp07 and DNp10 mean baseline membrane potential aligned by time flight stopped spontaneously (vertical gray line). Right, per-fly membrane potential difference during flight and post-flight states (gray boxes). Gray dots, trials; colored dots, single fly mean; colored lines, mean across flies. DNp10 across fly mean, 3.33 mV, n = 222 trials; DNp07, 0.22 mV, n = 215 trials; this difference was significant, two-sided t-test, ***p = 3x10−57, t = −18.6, df = 435. (g) DNp10 visual responses (left) and the flight-dependent depolarization (right) after ablation of appendages with mechanoreceptors: antennae (single antenna, gray, both antennae, black), wings (purple), halteres (cyan); dark blue line and shaded area, response mean ± SD of intact flies. left: Nintact = 6, Nantennae = 2, Nwings = 2, Nhalteres = 3; right: Nantennae = 4, Nwings = 2, Nhalteres = 3. N, number of recordings from different flies.

Comment in

References

    1. Wu M et al. Visual projection neurons in the Drosophila lobula link feature detection to distinct behavioral programs. Elife 5, (2016). - PMC - PubMed
    1. Panser K et al. Automatic Segmentation of Drosophila Neural Compartments Using GAL4 Expression Data Reveals Novel Visual Pathways. Curr. Biol 26, 1943–1954 (2016). - PMC - PubMed
    1. Klapoetke NC et al. Ultra-selective looming detection from radial motion opponency. Nature 551, 237–241 (2017). - PMC - PubMed
    1. von Reyn CR et al. Feature Integration Drives Probabilistic Behavior in the Drosophila Escape Response. Neuron 94, 1190–1204 (2017). - PubMed
    1. Ache JM et al. Neural Basis for Looming Size and Velocity Encoding in the Drosophila Giant Fiber Escape Pathway. Curr. Biol 29, 1073–1081.e4 (2019). - PubMed

Methods-only References

    1. Pfeiffer BD, Truman JW & Rubin GM Using translational enhancers to increase transgene expression in Drosophila. Proc. Natl. Acad. Sci 109, 6626–6631 (2012). - PMC - PubMed
    1. Klapoetke NC et al. Independent optical excitation of distinct neural populations. Nat. Methods 11, 338–346 (2014). - PMC - PubMed
    1. Tuthill JC, Nern A, Holtz SL, Rubin GM & Reiser MB Contributions of the 12 Neuron Classes in the Fly Lamina to Motion Vision. Neuron 79, 128–140 (2013). - PMC - PubMed
    1. Pfeiffer BD, Ngo TTB, Hibbard KL, Murphy C, Jenett A, Truman JW, and Rubin GM (2010). Refinement of tools for targeted gene expression in Drosophila. Genetics 186, 735–755. - PMC - PubMed
    1. Nern A, Pfeiffer BD & Rubin GM Optimized tools for multicolor stochastic labeling reveal diverse stereotyped cell arrangements in the fly visual system. Proc. Natl. Acad. Sci 112, E2967–E2976 (2015). - PMC - PubMed

Publication types

LinkOut - more resources