

Incidence of Neuroendocrine Tumors in the United States from 2001-2015: A United States Cancer Statistics Analysis of 50 States
- PMID: 31183301
- PMCID: PMC6538402
- DOI: 10.7759/cureus.4322
Incidence of Neuroendocrine Tumors in the United States from 2001-2015: A United States Cancer Statistics Analysis of 50 States
Abstract
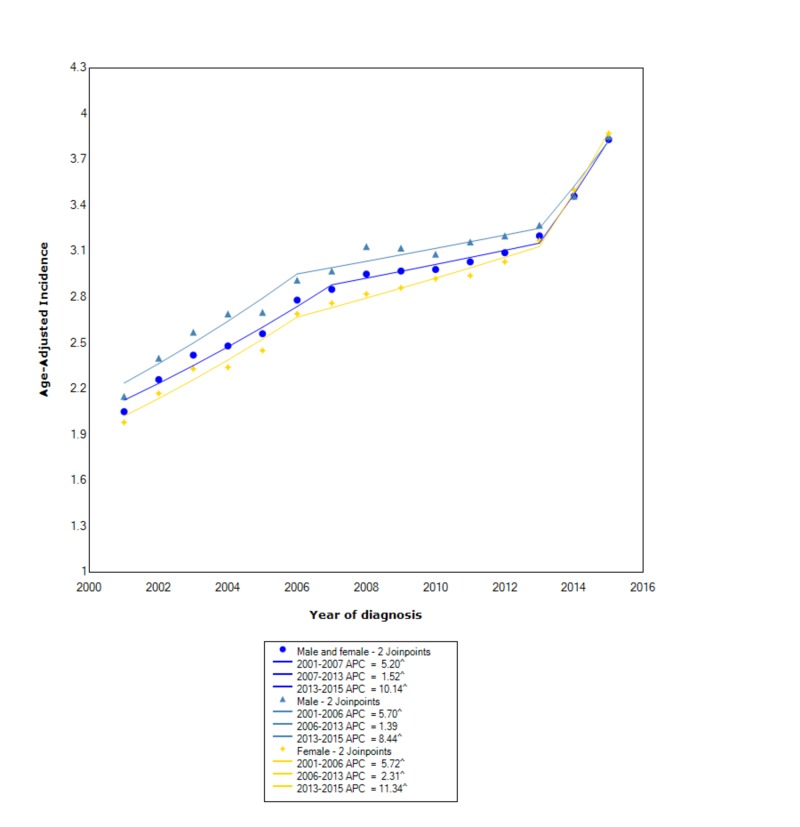
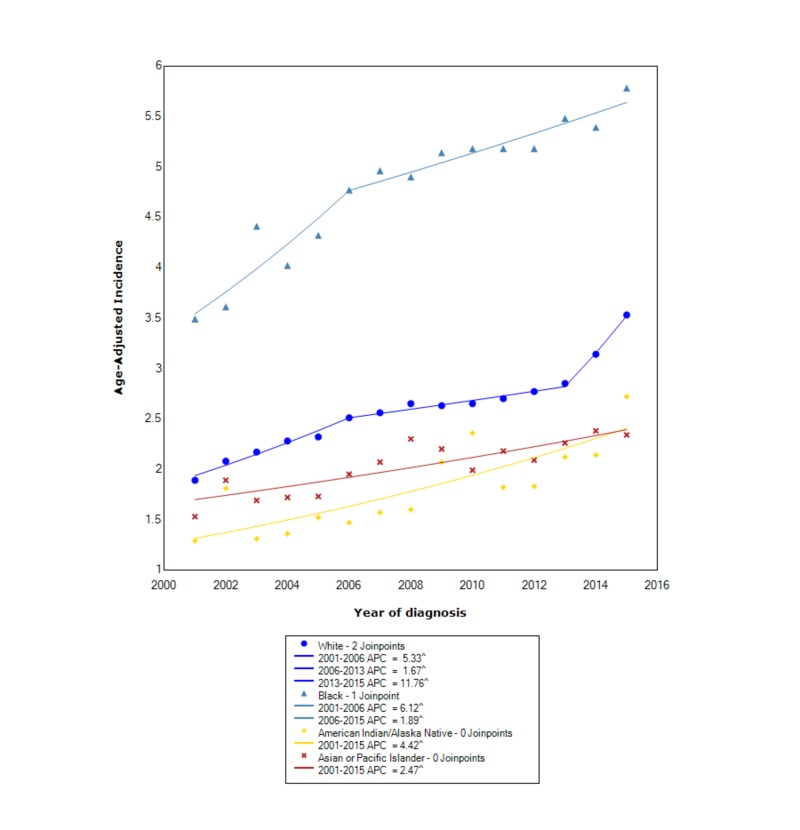
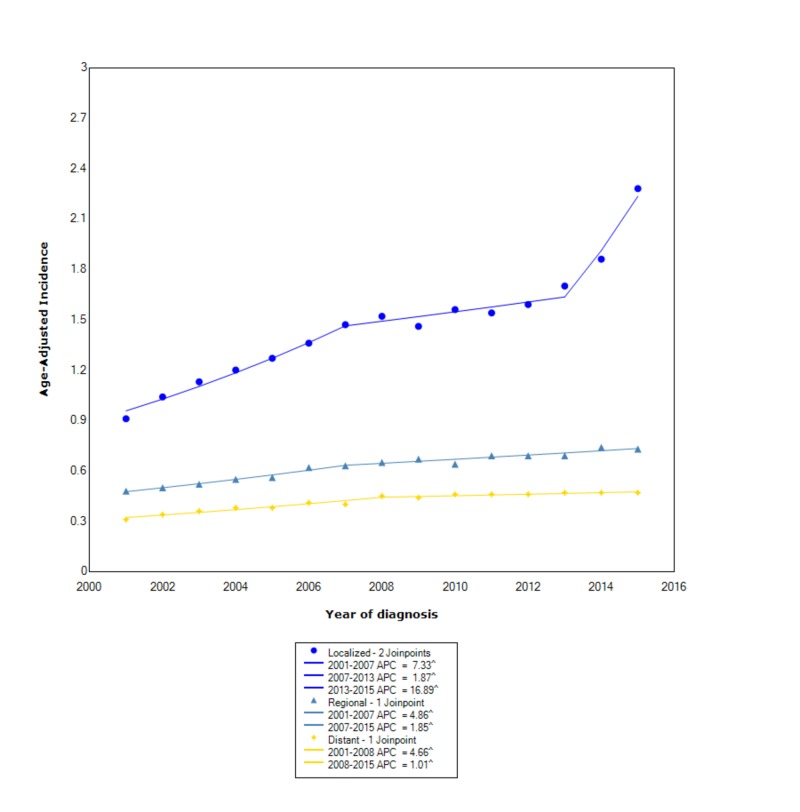
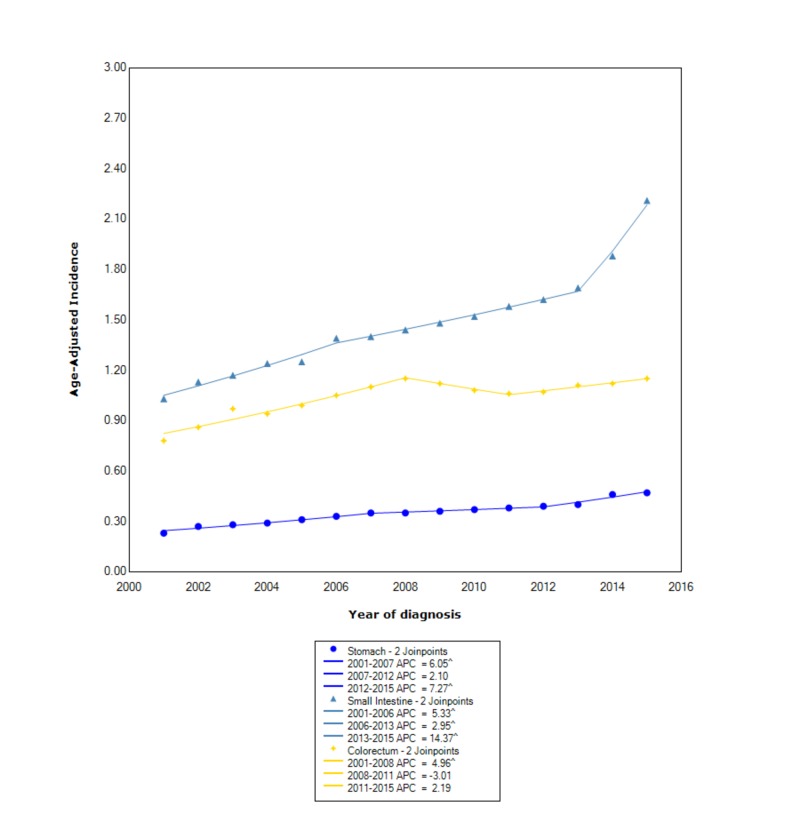
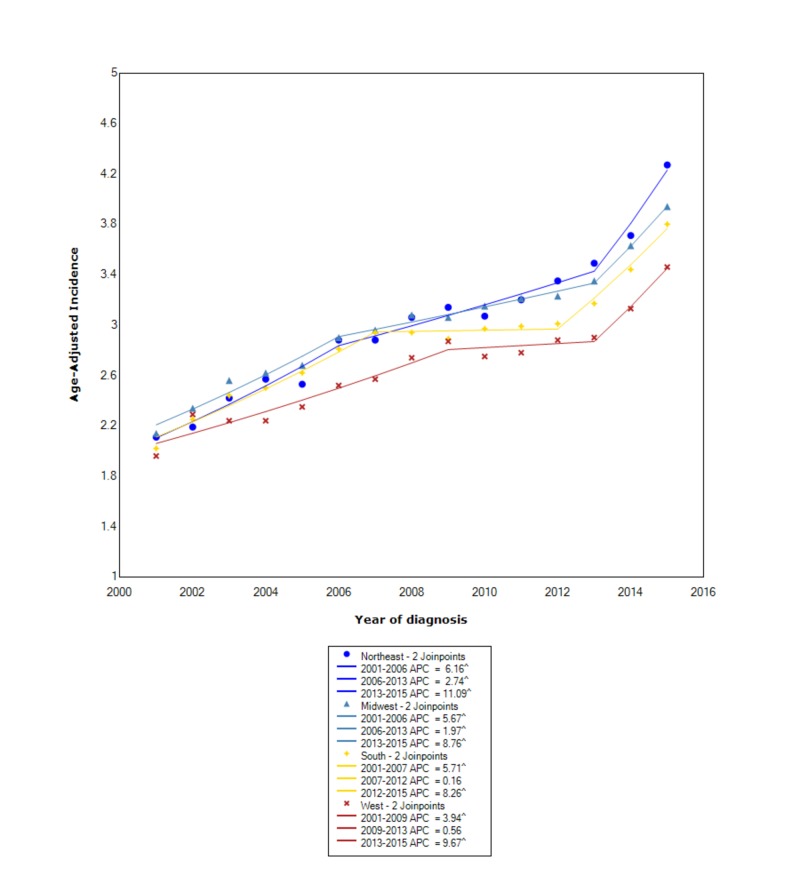
Introduction Neuroendocrine tumors (NETs), once considered a rare malignancy, has started to become a more common cancer within the United States (US). Given the limited data available on the incidence of NETs in the entire US population, our goal in this study was to investigate the incidence of NETs in at-risk populations in all 50 states. Methods The United States Cancer Statistics (USCS) was used to obtain data for NETs from 2001 to 2015. An incidence analysis was done for sex, race, stage, primary location within the gastrointestinal (GI) tract, and US regional location. Results The overall incidence of NETs from 2001 to 2015 was 2.89 per 100,000 people per year. The overall incidence rates were the greatest for each stratification of males, blacks, localized disease, primary location in the small intestine, and in the Northeast. The incidence in males between 2013 and 2015 increased with an annual percent change (APC) of 8.44. Between 2006 and 2015, the incidence in blacks increased with an APC of 1.89. Between 2013 and 2015, the incidence of localized disease and a primary location in the small intestine increased with an APC of 16.89 and 14.37, respectively. In the Northeast, between 2013 and 2015, the incidence increased with an APC of 11.09. Conclusion In this study, we investigated the incidence of NETs using data obtained from the USCS database, which covers all 50 states. We found that there is a rising incidence in most subpopulations possibly related to improved compliance with surveillance colonoscopies and improved endoscopic and radiographic techniques. Further studies are needed to ultimately determine the exact causes of our findings. However, our study will serve as an important first step to determine the exact etiology for the rising incidence of NETs in all 50 states.
Keywords: cancer; cancer epidemiology; epidemiology; gastroenterology; incidence; neuroendocrine tumors.
Conflict of interest statement
The authors have declared that no competing interests exist.
Figures
References
-
- A 5-decade analysis of 13,715 carcinoid tumors. Modlin IM, Lye KD, Kidd M. Cancer. 2003;97:934–959. - PubMed
-
- Prognostic factors of long-term outcome in gastroenteropancreatic neuroendocrine tumours. Pape UF, Berndt U, Müller-Nordhorn J, et al. https://www.ncbi.nlm.nih.gov/pubmed/18603570. Endocr Relat Cancer. 2008;15:1083–1097. - PubMed
-
- National Cancer Institute, DCCPS, Surveillance Research Program; 2017. Surveillance, Epidemiology, and End Results (SEER) Program (www.seer.cancer.gov) SEER*Stat Database: Populations - Total U.S. (1969-2016) Katrina/Rita Adjustment - Linked To County Attributes - Total U.S., 1969-2016 Counties.
LinkOut - more resources
Full Text Sources