. 2019 Jun 5;5(6):eaaw0254.
doi: 10.1126/sciadv.aaw0254. eCollection 2019 Jun.

The innate immune sensor Toll-like receptor 2 controls the senescence-associated secretory phenotype

Affiliations

The innate immune sensor Toll-like receptor 2 controls the senescence-associated secretory phenotype

Priya Hari et al. Sci Adv. .

Abstract

Cellular senescence is a stress response program characterized by a robust cell cycle arrest and the induction of a proinflammatory senescence-associated secretory phenotype (SASP) that is triggered through an unknown mechanism. Here, we show that, during oncogene-induced senescence (OIS), the Toll-like receptor 2 (TLR2) and its partner TLR10 are key mediators of senescence in vitro and in murine models. TLR2 promotes cell cycle arrest by regulating the tumor suppressors p53-p21CIP1, p16INK4a, and p15INK4b and regulates the SASP through the induction of the acute-phase serum amyloids A1 and A2 (A-SAAs) that, in turn, function as the damage-associated molecular patterns (DAMPs) signaling through TLR2 in OIS. Last, we found evidence that the cGAS-STING cytosolic DNA sensing pathway primes TLR2 and A-SAAs expression in OIS. In summary, we report that innate immune sensing of senescence-associated DAMPs by TLR2 controls the SASP and reinforces the cell cycle arrest program in OIS.


Figures

Fig. 1
Fig. 1. TLR2 expression is induced during OIS.
(A) Schematic showing IMR90 ER:RAS cells treated with 4OHT undergo OIS. IMR90 ER:STOP cells serve as a control and retain proliferative capacity with 4OHT. (B) Quantitative reverse transcription polymerase chain reaction (qRT-PCR) analysis of TLR family member expression in IMR90 ER:RAS and ER:STOP cells treated with 4OHT for 5 and 8 days. (C) Western blot of TLR2 expression in IMR90 ER:RAS and ER:STOP (ER:S) cells with up to 10 days of 4OHT treatment (top). The 5-bromo-2′-deoxyuridine (BrdU) incorporation in IMR90 ER:RAS cells treated with 4OHT for up to 8 days, as indicated. (D) RNA was extracted from snap-frozen liver samples from wild-type (WT) mice 6 days following hydrodynamic delivery of NrasG12V/D38A (n = 5) and NrasG12V (n = 4) transposons. tlr2 mRNA expression was measured using qRT-PCR. Scatter plots represents value per animal, with the horizontal line representing group means ± SEM. Statistical significance was calculated using Students two-tailed t test. **P < 0.01. (E) Immunohistochemical staining for Nras and Tlr2 in consecutive liver sections from corresponding mice in (D) showing that oncogenic NrasG12V expressing, but not NrasG12V/D38A expressing, hepatocytes express Tlr2. Scale bars, 50 μm.
Fig. 2
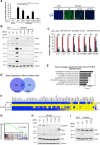
Fig. 2. TLR2 and TLR10 regulate the SASP in OIS.
(A) Immunofluorescence staining and high-content analysis for IL-1β expression in IMR90 ER:RAS cells treated with 4OHT for 8 days and repeatedly transfected with pooled siRNA targeting TLR1, TLR2, TLR6, and TLR10. Nontarget (NT)-pooled siRNA was used as control. Representative images are shown. Scale bars, 250 μm. DAPI, 4′,6-diamidino-2-phenylindole. (B) Western blot analysis against indicated antibodies in IMR90 ER:RAS cells treated with 4OHT for 8 days and repeatedly transfected with pooled and individual siRNA targeting TLR2 and TLR10. T2-P, siRNA TLR2 pool; T2-4, individual TLR2 siRNA; T10-P, siRNA TLR10 pool; T10-2, individual TLR10 siRNA. Nontarget pooled siRNA was used as control. Western blot against β-actin is shown as a loading control. (C) SASP factor regulation by qRT-PCR in ER:RAS cells treated with 4OHT for 8 days and repeatedly transfected with pooled siRNA targeting TLR2 and TLR10. Results are expressed as means ± SEM of three independent experiments. (D) Venn diagram showing the number of genes that are significantly induced by TLR2 and TLR10 during OIS in the transcriptome analysis (AmpliSeq) in IMR90 ER:RAS cells treated with 4OHT and transfected with pooled siRNA targeting TLR2 and TLR10 for 8 days (GSE127116). The intersection represents the number of genes regulated by both TLR2 and TLR10. This signature of 267 genes will be used for GSEA in additional senescence transcriptomes in Fig. 4 and figs. S4 and S7. (E) Top regulated terms identified through of coregulated genes in (H) using DAVID gene ontology analysis. Chart bars represent Benjamin-adjusted P value of term enrichment. (F) Heat map of SASP factor expression obtained from the transcriptome analysis (AmpliSeq) in IMR90 ER:RAS cells following siRNA knockdown of TLR2 and TLR10 for 8 days of 4OHT treatment. (G) GSEA enrichment plot of RELA signature in TLR2 siRNA-transfected IMR90 ER:RAS 4OHT-induced cells. (H) IMR90 ER:RAS cells were transfected with indicated siRNA for 8 days with 4OHT. Western blot for phosphorylation and total levels of IKKa/β and p38 mitogen-activated protein kinase (MAPK) was performed. (I) IMR90 ER:RAS cells were treated with 4OHT and repeatedly transfected with indicated pooled siRNA and nontarget siRNA as control for 5 days. Western blots were conducted for phosphorylation of p65 and total p65 protein levels. All statistical significance was calculated using one-way analysis of variance (ANOVA). ***P < 0.001, **P < 0.01, and *P < 0.05. ns, not significant.
Fig. 3
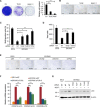
Fig. 3. TLR2 reinforces the cell cycle arrest in OIS.
(A) IMR90 cells infected with TLR2 or H-RasG12V expression vectors or empty vector (EV) control were seeded at low density and stained with crystal violet after 2 weeks. The staining was quantified to obtain relative cell content. Results are expressed as means ± SEM of three independent experiments. (B) SA-β-Gal staining was carried out on TLR2- and H-RasG12V–expressing cells. Results are expressed as means (% positive cells) ± SEM of three independent experiments. (C to G) IMR90 ER:RAS cells were treated with 4OHT and repeatedly transfected with indicated siRNA and pooled nontarget siRNA control. siTP53 was used as a positive control. (C) After 5 days of treatment, a BrdU incorporation assay was conducted. Results are expressed as means ± SEM of three independent experiments. (D) Total DAPI-stained nuclei counted by high-content analysis at 8 days. Results are expressed as means ± SEM of three independent experiments. (E) After 10 days, SA-β-Gal activity assay was conducted. Scale bars, 100 μm. (F) qRT-PCR analysis of CDKN1A, CDKN2A, and CDKN2B transcripts. Results are expressed as means ± SEM of three independent experiments. (G) Western blot for p53 expression at 8 days. All statistical significance was calculated using one-way analysis of variance (ANOVA). ***P < 0.001, **P < 0.01, and *P < 0.05.
Fig. 4
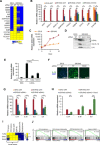
Fig. 4. A-SAA signaling through TLR2 controls the SASP.
(A) Heat map showing the relative fold change of acute-phase response transcripts of samples from the acute-phase response gene set from the mRNA transcriptomes. Transcriptome analysis (AmpliSeq) was performed in mRNA from IMR90 ER:RAS cells transfected with pooled siRNA for TLR2 and TLR10 and nontarget pool as a control. Genes with significant changes between nontarget siRNA control and both TLR2 and TLR10 knockdown are in bold characters. Adjusted P values were calculated using Benjamini and Hochberg false discovery rate of three independent experiments. Bold genes represent adjusted P < 0.05. (B) qRT-PCR validation of acute-phase response targets from samples obtained similarly to (A). Results are expressed as means ± SEM of three independent experiments. Statistical significance was calculated using one-way ANOVA and Dunnett’s multiple comparisons tests. ***P < 0.001, **P < 0.01, and *P < 0.05. (C) qRT-PCR analysis of A-SAA expression in IMR90 ER:RAS and ER:STOP cells with up to 10 days of 4OHT treatment. (D) IMR90 ER:RAS cells were treated with 4OHT and repeatedly transfected with pooled siRNA targeting SAA1 and SAA2 and nontarget siRNA as control for 8 days. Western blot of the conditioned medium for indicated antibodies. (E) IMR90 cells transfected with pooled siRNA for TLR2 and TLR10 were treated with A-SAA (10 μg/ml) for 3 hours, and qRT-PCR was performed to measure IL1β expression. Results are expressed as means ± SEM of three independent experiments. (F) Immunofluorescence staining and quantification of IL-1β expression by high-content analysis. Scale bars, 250 μm. (G) qRT-PCR for IL1α, IL1β, IL6, and IL8 expression. Results are expressed as means ± SEM of three independent experiments. (H) IMR90 ER:RAS cells were transfected with siSAA2 and treated with 1 μm Pam2CSK4 for 5 days. qRT-PCR of IL1α, IL1β, and IL6 expression. (I) Heat map showing TLR2 SAA1 and SAA2 expression in available transcriptomic data from adriamycin (ADR) mediated therapy-induced senescence (TIS) lymphoma cells (GSE31099), OIS mediated by mutant BRAF in human melanocytes (OIS) (GSE46801), stasis in human mammary epithelial cells (HMEC) (GSE16058), DNA damage-induced senescence in BJ cells (DDR) (GSE13330), replicative senescence in BJ cells (replicative) (GSE13330), and developmental senescence in the mesonephros (developmental) (GSE49108). (J) GSEA plots for the 267 genes regulated coregulated by TLR2 and TLR10 in OIS (fig. S2H) in the transcriptomes from (I). All statistical significance was calculated using one-way ANOVA. ***P < 0.001, **P < 0.01, and *P < 0.05.
Fig. 5
Fig. 5. A-SAA and TLR2 expression is dependent on STING activation.
(A and B) IMR90 ER:RAS cells were treated with 4OHT and repeatedly transfected with indicated pooled siRNA and nontarget siRNA as control for 8 days. TLR2, SAA1, and SAA2 transcripts were measured by qRT-PCR. Results are expressed as means ± SEM of three independent experiments. (C) IMR90 cells were transfected with siRNA targeting RELA, IRF3, TLR2, and STING for 2 days, followed by transfection with 2.5 μg of herrings-testes DNA (HT-DNA) for 24 hours. TLR2 transcripts were measured by qRT-PCR. Results are expressed as means ± SEM of three independent experiments. (D) Western blot for STING dimerization. HT-DNA transfection of IMR90 cells were used as positive control for STING dimerization. IMR90 ER:RAS cells were transfected with siRNA targeting TLR2, TLR10, and STING for 8 days with 4OHT. All statistical significance was calculated using a one-way ANOVA. ***P < 0.001, **P < 0.01, and *P < 0.05.
Fig. 6
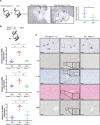
Fig. 6. tlr2 is necessary for SASP activation in vivo.
(A) Representative IHC staining and IHC score quantification of IL-1α in PanIN generated in tlr2+/+ or tlr2−/− Pdx-Cre KrasG12D mice. Scatter plot represents the value for individual animals (dots), and the horizontal line represents group means (n = 5) ± SEM. Statistical significance was calculated using one-tailed Student’s t test. *P < 0.05 (B) qRT-PCR results for SASP factors IL-1β, IL-1α, and IL-6 from liver samples from WT and tlr2−/− mice 6 days after receiving hydrodynamic delivery of NrasG12V/D38A negative control or oncogenic NrasG12V transposon as indicated. Scatter plot represents the value for individual animals (dots), and the horizontal line represents group means (n = 3) ± SEM. Statistical significance was calculated using two-tailed students t test. *P < 0.05 and **P < 0.01. (C) Representative IHC staining for Nras, Tlr2, IL-1β, p21, and Biotin-SBB in corresponding liver sections from mice in (B). Scale bars, 50 μm.

References

    1. Kuilman T., Michaloglou C., Mooi W. J., Peeper D. S., The essence of senescence. Genes Dev. 24, 2463–2479 (2010). - PMC - PubMed
    1. Serrano M., Lin A. W., McCurrach M. E., Beach D., Lowe S. W., Oncogenic ras provokes premature cell senescence associated with accumulation of p53 and p16INK4a. Cell 88, 593–602 (1997). - PubMed
    1. Braig M., Lee S., Loddenkemper C., Rudolph C., Peters A. H. F. M., Schlegelberger B., Stein H., Dörken B., Jenuwein T., Schmitt C. A., Oncogene-induced senescence as an initial barrier in lymphoma development. Nature 436, 660–665 (2005). - PubMed
    1. Chen Z., Trotman L. C., Shaffer D., Lin H.-K., Dotan Z. A., Niki M., Koutcher J. A., Scher H. I., Ludwig T., Gerald W., Cordon-Cardo C., Pandolfi P. P., Crucial role of p53-dependent cellular senescence in suppression of Pten-deficient tumorigenesis. Nature 436, 725–730 (2005). - PMC - PubMed
    1. Collado M., Gil J., Efeyan A., Guerra C., Schuhmacher A. J., Barradas M., Benguría A., Zaballos A., Flores J. M., Barbacid M., Beach D., Serrano M., Tumour biology: Senescence in premalignant tumours. Nature 436, 642 (2005). - PubMed

Publication types

MeSH terms