Review
. 2019:1124:3-46.
doi: 10.1007/978-981-13-5895-1_1.

Spontaneous Electrical Activity and Rhythmicity in Gastrointestinal Smooth Muscles

Affiliations
Review

Spontaneous Electrical Activity and Rhythmicity in Gastrointestinal Smooth Muscles

Kenton M Sanders. Adv Exp Med Biol. 2019.

Abstract

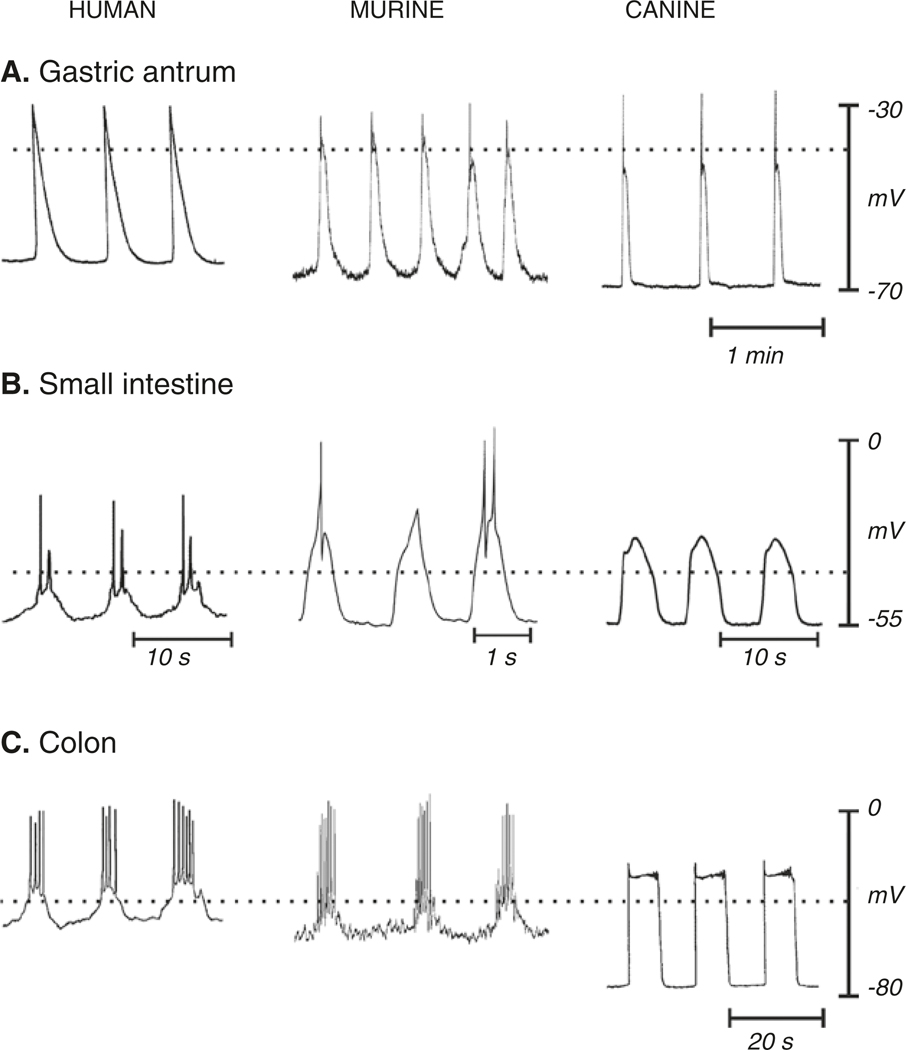
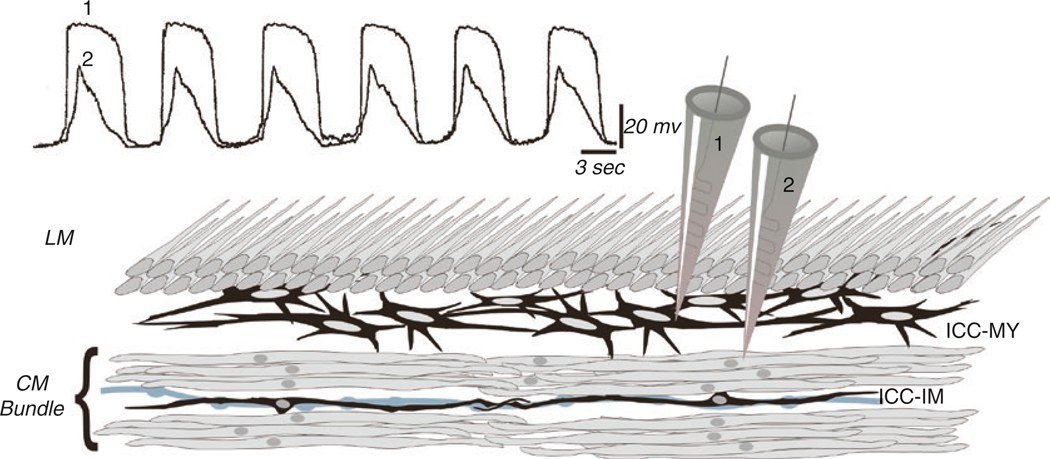
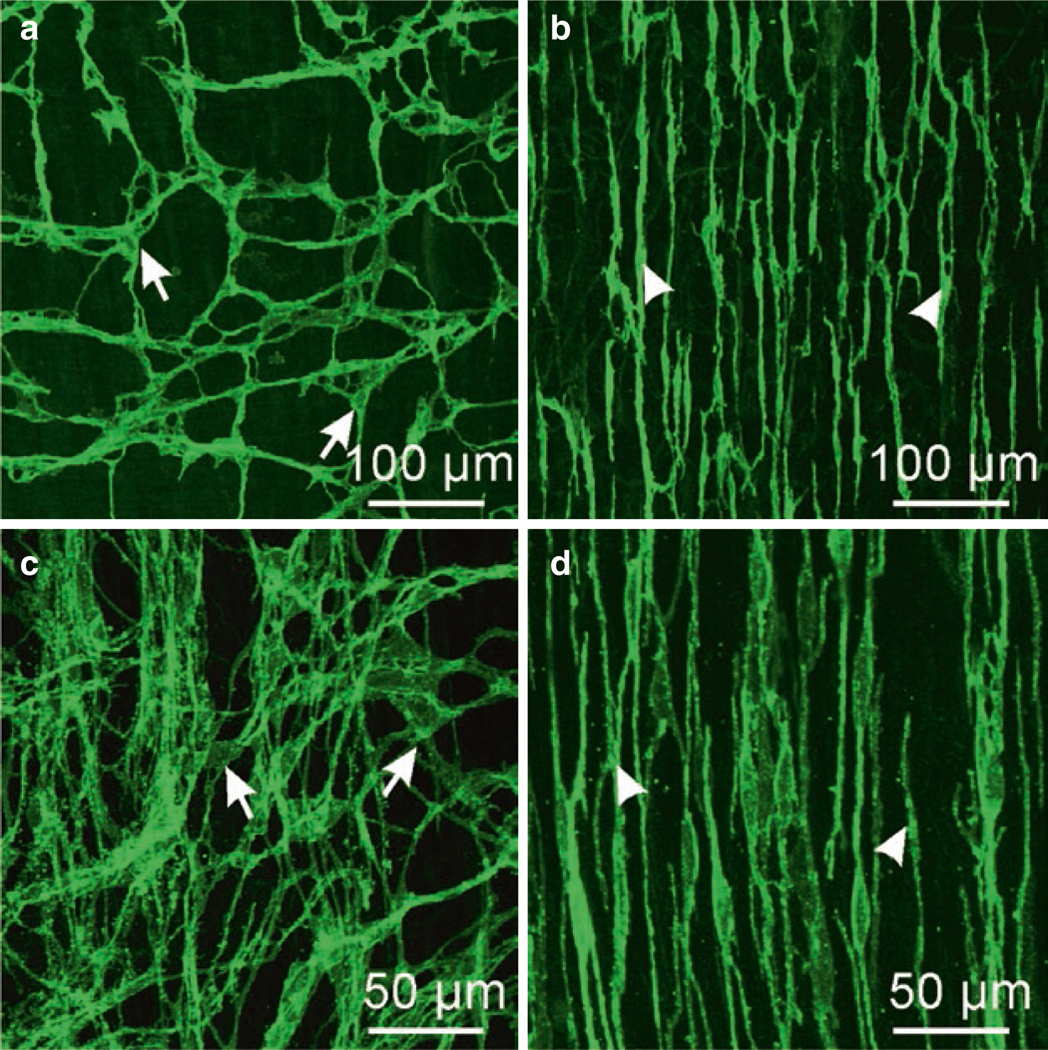
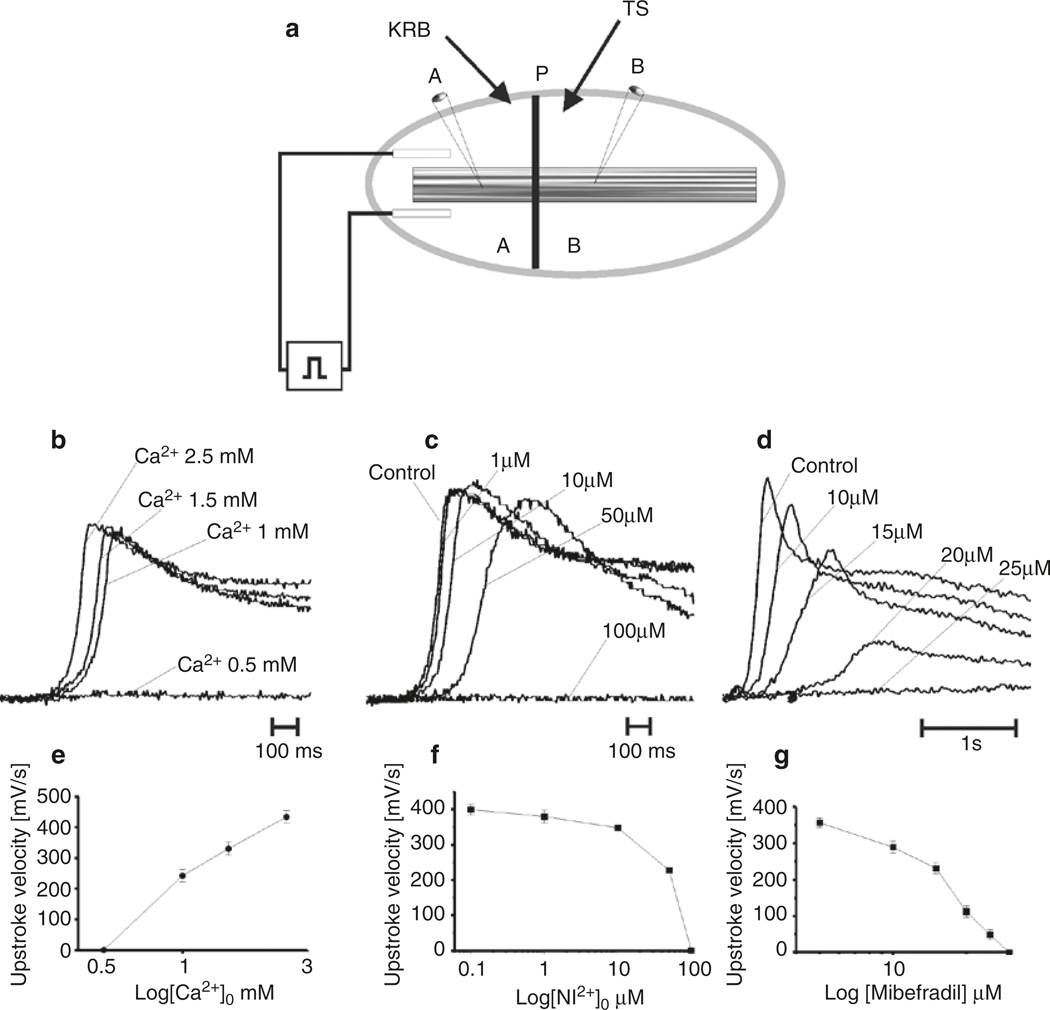
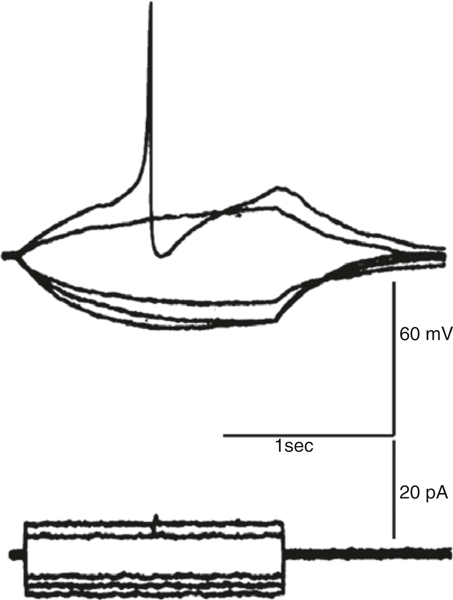
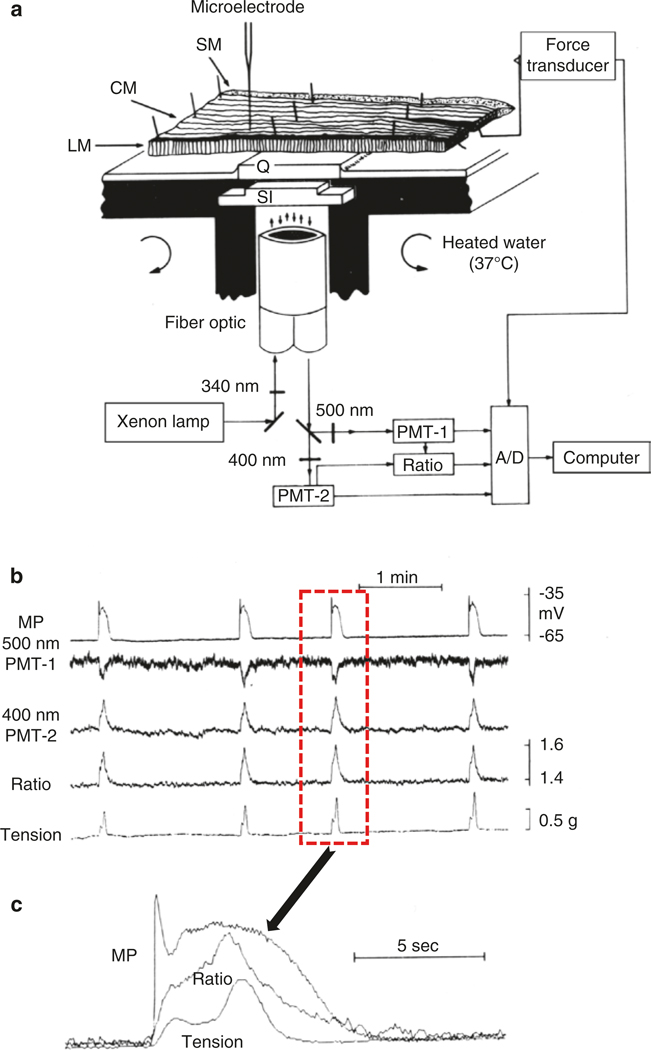
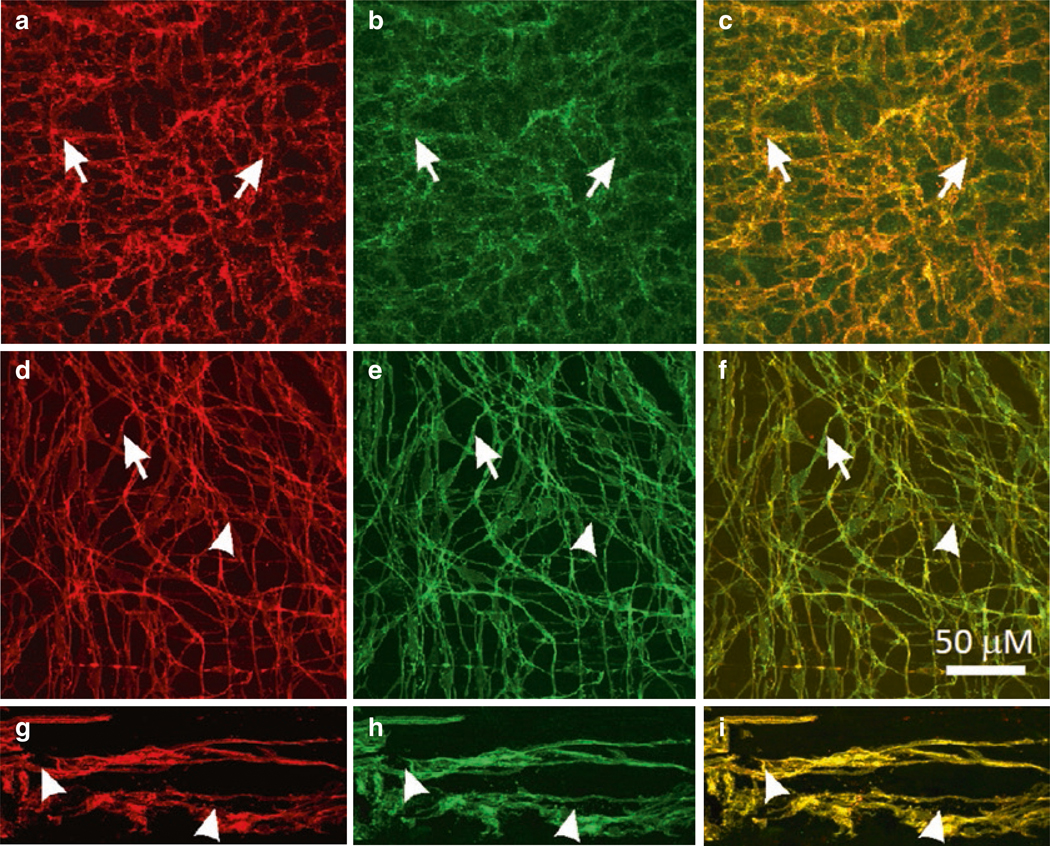
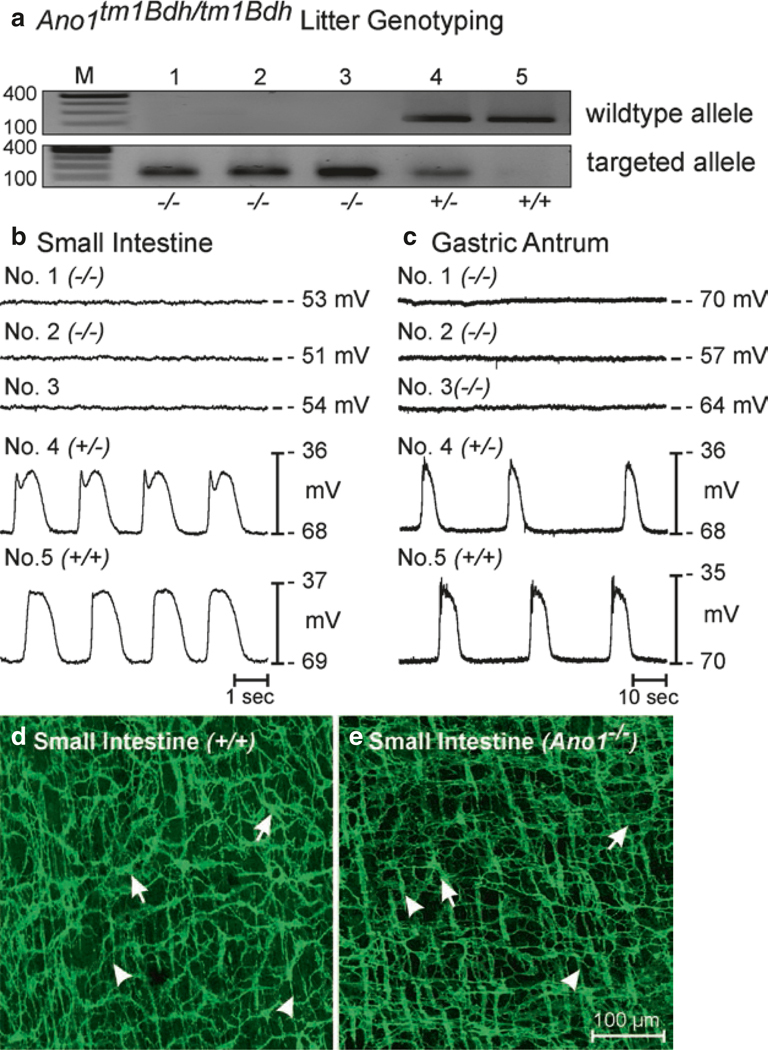
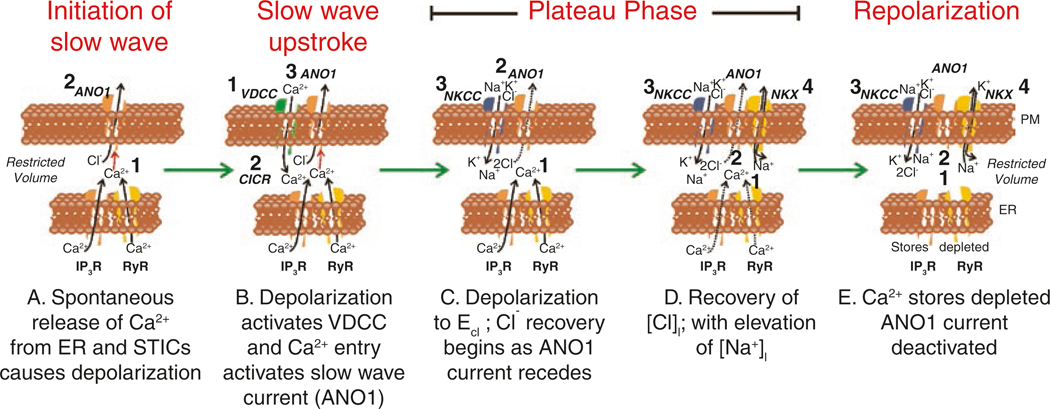
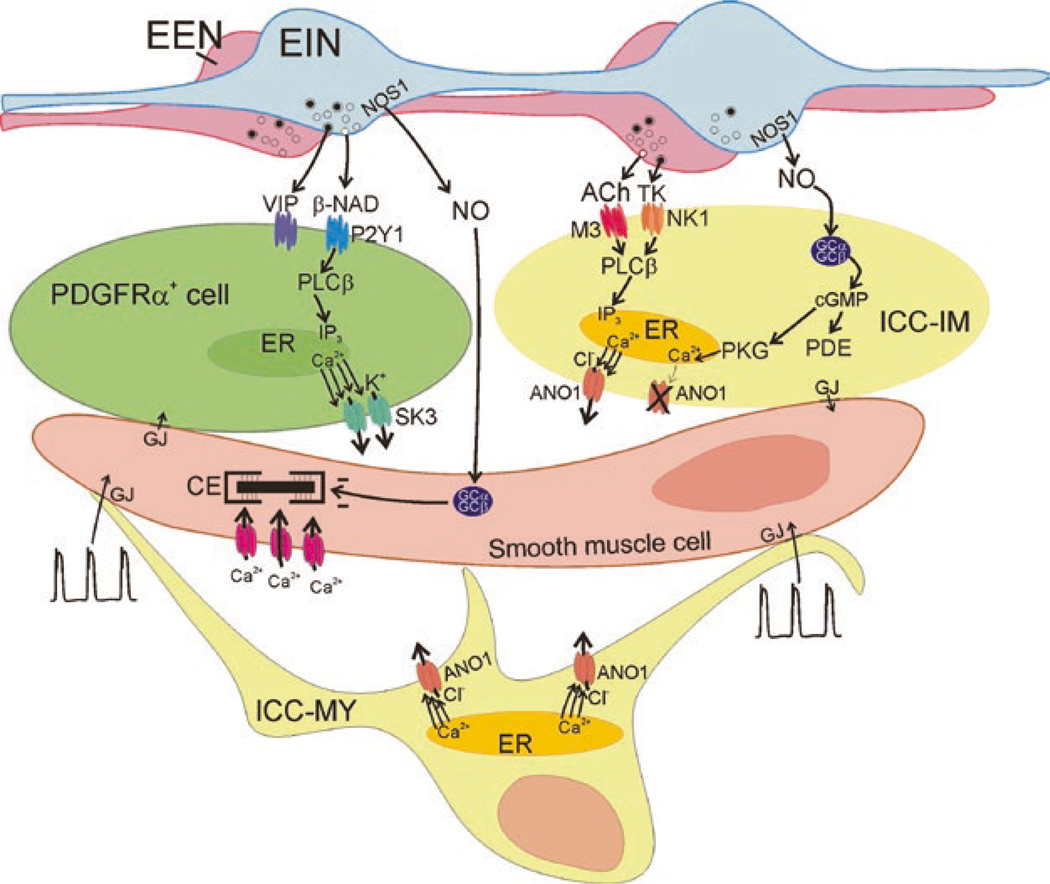
The gastrointestinal (GI) tract has multifold tasks of ingesting, processing, and assimilating nutrients and disposing of wastes at appropriate times. These tasks are facilitated by several stereotypical motor patterns that build upon the intrinsic rhythmicity of the smooth muscles that generate phasic contractions in many regions of the gut. Phasic contractions result from a cyclical depolarization/repolarization cycle, known as electrical slow waves, which result from intrinsic pacemaker activity. Interstitial cells of Cajal (ICC) are electrically coupled to smooth muscle cells (SMCs) and generate and propagate pacemaker activity and slow waves. The mechanism of slow waves is dependent upon specialized conductances expressed by pacemaker ICC. The primary conductances responsible for slow waves in mice are Ano1, Ca2+-activated Cl- channels (CaCCs), and CaV3.2, T-type, voltage-dependent Ca2+ channels. Release of Ca2+ from intracellular stores in ICC appears to be the initiator of pacemaker depolarizations, activation of T-type current provides voltage-dependent Ca2+ entry into ICC, as slow waves propagate through ICC networks, and Ca2+-induced Ca2+ release and activation of Ano1 in ICC amplifies slow wave depolarizations. Slow waves conduct to coupled SMCs, and depolarization elicited by these events enhances the open-probability of L-type voltage-dependent Ca2+ channels, promotes Ca2+ entry, and initiates contraction. Phasic contractions timed by the occurrence of slow waves provide the basis for motility patterns such as gastric peristalsis and segmentation. This chapter discusses the properties of ICC and proposed mechanism of electrical rhythmicity in GI muscles.

Keywords: ANO1 channels; Ca2+ transient; Electrophysiology; Gastrointestinal motility; Interstitial cells of Cajal; Pacemaker; SIP syncytium; Slow wave; T-type Ca2+ channels.


Figures

Fig. 1.1
Fig. 1.1
Electrical activity recorded from stomach, small bowel, and colon of three species. Recordings were made with intracellular microelectrodes from the circular muscle layers of isolated strips of muscle from the antrum, ileum or jejunum and proximal colon. The major features of electrical activity that vary in waveform in different regions of the GI tract and in different species are displayed. From a relatively stable membrane potential between slow waves (resting membrane potential), a sharp upstroke depolarization occurs when a propagating slow wave reaches the point of recording. The upstroke typically repolarizes quickly to a pseudo-stable plateau potential that can last for several seconds before repolarization to the resting potential. Resting potentials vary, making it necessary for slow waves in different regions to depend upon different voltage-dependent Ca2+ channels to carry the main current during the upstroke (see text for details). The plateau potential depends upon sustained activation of Ano1 channels that are activated by Ca2+ release events in the ER of ICC. In some regions slow waves initiate Ca2+ action potentials in SMCs. These are initiated in the small bowel and colon when the depolarization reaches about −40 mV (dotted lines in each panel). Ca2+ action potentials are superimposed upon the slow wave plateau phase. Slow waves with or without superimposed action potentials generate phasic contractions. Copied with permission from [2]
Fig. 1.2
Fig. 1.2
Simultaneous recording from ICC-MY and SMC. Recording from ICC-MY and SMCs simultaneously shows that the upstroke of slow waves originates in ICC-MY and conducts with decrement to electrically coupled SMCs. The conductances present in SMCs cannot support active propagation of slow waves in these cells; however, the depolarization can activate other voltage-dependent conductances that support contractions (L-type Ca2+ channels and shape the slow wave; various voltage-dependent K+ channels). The peak of the slow wave reaches about −10 mV (approximately the equilibrium potential for Cl ions) and is relatively constant for durations of a second or more. Anatomical drawing depicts circular (CM) and longitudinal (LM) muscle layers, ICC-MY in a network between CM and LM, and ICC-IM, lying in close apposition to an enteric motor neurons (gray varicose process). Redrawn from [2], and original data was provided by Professor David Hirst
Fig. 1.3
Fig. 1.3
ICC in murine and monkey small intestine. (a, b) are whole mounts imaged by confocal microscopy of ICC-MY (a) labeled with anti-c-Kit antibody (arrows) and ICC-DMP (b; arrowheads) in murine small intestine. ICC-MY have multiple processes and form an extensive interconnected network via gap junction coupling between ICC and with adjacent SMCs. ICC-DMP run in parallel with the circular muscle fibers and are concentrated very close to the submucosal edge of the circular muscle layer in the mouse. ICC-DMP are closely associated with the processes of enteric motor neurons (not shown) and PDGFRα+ cells (not shown). (c, d) are images from the small intestine of Macaca fascicularis (cynomolgus monkey). ICC-MY (c; arrows) in this species also display a network of cells between the circular and longitudinal muscle layers and ICC-DMP (d; arrowheads) are also present near the submucosal surface of the circular muscle layer. Redrawn from [206]
Fig. 1.4
Fig. 1.4
Role of Ca2+ entry in slow wave propagation. (a) Shows a partitioned chamber apparatus used to study slow wave propagation. Slow waves can be reliably generated in Chamber A perfused with Krebs solution (KRB). Slow waves are initiated by passing a current pulse through electrodes placed on either side of the muscle strip. The muscle is pulled through a latex partition into Chamber B that can be independently perfused with Test Solutions (TS). Cells in Chambers A and B record control slow waves, and propagating slow waves, as modified by the Test Solution. (bd) Show control slow waves (as recorded in Chamber A) and slow waves exposed to Test Solutions containing reduced [Ca2+]o (b), extracellular Ni2+ (c), or mibefradil (d). Each Test Solution caused a concentration-dependent decrease in propagation velocity (not shown in this example) and decreased upstroke velocity, as shown by superimposed slow waves. [Ca2+]o of 0.5 mM, Ni2+ at 100 μM, and mibefradil at 25 μM did not support active propagation, and slow waves decayed in amplitude before reaching the impaled cell in Chamber B. Graphs in (eg) summarize this series of experiments. Redrawn from [80]
Fig. 1.5
Fig. 1.5
Ca2+ action potential in an isolated smooth muscle cell from rabbit jejunum. Cell held under current clamp conditions and hyperpolarized or depolarized by passing constant current pulses. Depolarization activated Ca2+ action potential. Redrawn from [92]
Fig. 1.6
Fig. 1.6
Measurement of membrane potential, fluorescence of a Ca2+ indicator and contraction in muscles of canine antrum. (a) Apparatus to make simultaneous measurements that includes illumination of the muscle strip in selected areas with 340 nm light and collection of 400 and 500 nm signals and analogue determination of the F400/F500 ratio. After determination of the continuous ratio, signals were digitized, along with tension and membrane potential (MP), and recorded on a computer. Antral muscles were cut in cross-section through the thickness of the tunica muscularis and pinned over a quartz window (Q). Measurements were made on longitudinal muscle (LM) or areas of muscle near the submucosal (SM) surface of the circular muscle (CM) or from CM close to the myenteric plexus. A microelectrode was used to impale SMCs near the field of view. (b) Recordings of MP, 500 nm signal, 400 nm signal, the F400/F500 ratio, and tension. Note the correlation between these signals. (c) One slow wave cycle is shown at higher resolution from the events outlined by the dotted line box in b, and the traces are superimposed. Note the initiation of the signal complex by the upstroke depolarization of the slow wave, followed by initiation of a Ca2+ transient and then initiation of contraction. Figure is redrawn from [90]
Fig. 1.7
Fig. 1.7
Expression of Ano1 in ICC. (ac) c-Kit-LI (a, red) and ANO1-LI (b, green) in ICC-MY (arrows) of the murine small intestine. (c) Shows merged file demonstrating co-localization of c-Kit-LI and ANO1-LI (yellow). (df) Co-localization of c-Kit-LI and ANO1-LI in ICC of the monkey small intestine. ICC-MY (d; arrowheads) and ICCDMP (d; arrows) are labeled by c-Kit antibody (red) and the same cells display ANO1-LI (e; green) in the small intestine. (f) Co-localization of Kit-LI and ANO1-LI (yellow) in ICC-MY and ICC-DMP. (gi) c-Kit-LI (arrowheads; g; red) and ANO1-LI (arrowheads; h; green) are expressed in ICC-MY in the human small intestine. Merged images demonstrate co-localization of these proteins in ICC-MY (i; yellow). Scale bar in F applies to all panels
Fig. 1.8
Fig. 1.8
Loss of slow waves in small intestinal and gastric muscles in Ano1−/− mice. (a) Genotypes of Ano1−/− mice. The wild-type allele was absent in animals 1–3 in this litter, demonstrating that these animals were Ano1−/−. Animal 4 was a heterozygote and animal 5 was a wild-type homozygote. (b, c) Electrical recording from jejunal and antral circular muscles from each animal with intracellular electrodes. Slow waves were absent in Ano1−/− mice, and normal in animals with wild-type alleles. (d, e) ICC-MY (arrows) and ICC-DMP (arrowheads), with an apparently normal distribution and density, were present in tissues of Ano1−/− mice (small intestine shown). Scale bar for d and e is shown in e. Figure is redrawn from [206] with permission
Fig. 1.9
Fig. 1.9
Proposed contributions of ion channels and transporters during the slow wave cycle corresponding to experimental evidence from the murine small intestine. Each panel represents the restricted volumes of nanodomains formed by close contacts between the plasma membrane (PM) and the endoplasmic reticulum (ER). Images are idealized membrane regions with ion channels and transporters that appear to be functional depicted in each snapshot through the slow wave cycle. Numbers in each panel show sequence of events. (A) Ca2+ release occurs spontaneously from ER through Ca2+ release channels (IP3R and RyR) (1). Due to the close apposition of the PM, Ca2+ transients activate Ano1 channels (2). Efflux of Cl ions causes STICs. (B) Depolarization from STICs activates voltage-dependent Ca2+channels (T-Type) (1) initiating upstroke of the slow wave. Entry of Ca2+ into nanodomains initiates Ca2+-induced Ca2+ release (CICR; 2). Ca2+ release activates Ano1 channels in PM (3). (C) Asynchronous release of Ca2+ from stores (1) in different cellular locations (not shown) sustains activation of Ano1 channels causing membrane potential to linger near ECl and creating the plateau potential (2). Because membrane potential is near ECl there is little efflux of Cl− during the plateau (dotted arrow through Ano1 channel). However, loss of Cl during the depolarization initiates recovery via NKCC1 (3). (D) As long as Ca2+ is sustained (1), Ano1 channels are activated (2) and membrane potential remains in the plateau phase. Recovery of Cl proceeds and this is associated with influx of Na+, as NKCC1 uses the energy of the Na+ gradient to cause accumulation of [Cl]i against its electrochemical gradient. Removal of excess Na+ is accomplished by the Na+K+ ATPase (NKX) (4). (E) When available Ca2+ stores are depleted (1), Ca2+ recovery by SERCA or extrusion by the plasmalemmal Ca2+ ATPase (PMCA) (pumps not shown) causes reduction in Ca2+ in nanodomains and deactivation of Ano1 channels (2). Recovery of gradients may extend into the period between slow waves via the actions of NKCC1 (3) and NKX (4)
Fig. 1.10
Fig. 1.10
Propagation of Ca2+ waves in ICC-MY network in human jejunum. (a) Averaged Ca2+ waves show active ICC-MY. Colored circles represent regions (ROIs) of interest that have temporal changes in fluorescence plotted as colored traces in (b). Note the two phases of the Ca2+ transients and delay in second phase from the red to the blue ROI. (c) Shows an ST cube depicting the propagation of waves (white to mauve lines) from the bottom to the top of the field of view (FOV) in a (balls represent individual ICC-MY observed in a). Note that the Ca2+ traverses the FOV in a zigzag pattern. (d) Image sequence propagation of Ca2+ at different times during one slow wave cycle. The frames correspond to changes in fluorescence as a function of time in (b). The upstroke phase occurs at 0.64 s, and the plateau phase occurred between 1.92 and 3.84 s. (e) Shows a 3-dimensional ST map of 4 slow wave cycles in ICC-MY within the FOV shown in (a). The upstroke phase and plateau phase were constructed from 1 or 2 adjacent ICC-MY. The upstroke phase (small initial hump in fluorescence) occurs before each plateau (major peaks in fluorescence in which highest amplitude of fluorescence occurs during each cycle). Plateau phase in cells varies in rate-of-rise and amplitude from cycle to cycle across the FOV. Copied with permission from [150]
Fig. 1.11
Fig. 1.11
Ca2+ clusters in ICC-MY during slow wave activity. (a) Slow waves and Ca2+ waves in ICC-MY networks recorded simultaneously from jejunum muscle from a mouse expressing GCaMP3 exclusively in ICC. Imaging performed with a confocal microscope to restrict view to ICC-MY. Note the one-to-one relationship between the slow waves and Ca2+ transients. If fact the waves were not smooth changes in global Ca2+ observed in lower resolution monitoring. When higher resolution was used, facilitated by the superior performance of GCaMP3 as a sensor and low background from restricting GCaMP3 expression to ICC, Ca2+ waves were seen to be composed of many localized Ca2+ transients occurring in different sites within cell soma and processes. Each firing site was assigned a color and these are plotted in the occurrence map (third panel in a). Mapping Ca2+ transients in this manner shows that the transients are temporally clustered together at the frequency of the slow waves. (b) Increased sweep speed of simultaneous Ca2+ transient and slow wave outlined by gray box in (a). The occurrence map from this slow wave cycle is shown beneath the traces. Each Ca2+ firing site in the FOV was assigned a different color, and this analysis shows that Ca2+ transients occurred with different delays after the initiation of the slow wave upstroke, the durations of Ca2+ transients was highly variable, and multiple events occurred from the same site on occasion. Note that the Ca2+ clusters begin with a slight delay after the upstroke of the slow wave, and all occur within the duration of the slow wave. These observations suggest that the duration of the slow wave plateau depolarization is determined by the spread in time of Ca2+ transients, as the open probability of Ano1 channels (causing depolarization) will continue to be elevated as long as Ca2+ release events persist. (c) Shows ICC-MY network and site of recording within the FOV and within a few μM from the cells being imaged. Copied with permission from [157]
Fig. 1.12
Fig. 1.12
Loss of slow waves in Itpr1−/− mice. (a) Slow wave activity recorded by intracellular microelectrode from murine antral smooth muscle from a mouse 20 days after birth. (b) Slow waves are decreased in duration and amplitude by nifedipine. (c) Electrical activity recorded from mouse antrum from a 19-day-old Itpr1−/− mouse. Slow waves are absent and activity is spike-like complexes occurring without a constant frequency. (d) Electrical activity is abolished by nifedipine. Redrawn with permission from [163]
Fig. 1.13
Fig. 1.13
Schematic showing integration of inputs in the SIP syncytium. Schematic is developed from experimental evidence obtained from murine small intestine. SIP syncytium consists of SMCs, PDGFRα+ cells, and ICC (in small intestine the ICC are ICC-MY and ICC-IM; see Table 1.1 for additional details). ICC-MY are pacemaker cells and generate electrical slow waves by processes described in detail in Fig. 1.8 and depicted here as Ca2+ release from ER and activation of Ano1 channels in plasma membrane. Slow wave conduct through gap junctions (GJ) and depolarize SMCs. Depolarization activates Ca2+ entry through L-type Ca2+ channels and initiates cross bridge cycling of contractile elements (CE). Slow waves are omnipresent, but their impact on SMC contraction is modulated by inputs from enteric excitatory (EEN) and inhibitory (EIN) neurons that are intermingled and closely associated with PDGFRα+ cells and ICC-IM. EENs release ACh and tachykinins (substance P and possibly neurokinin A). These neurotransmitters bind to muscarinic type 3 (M3) receptors and neurokinin 1 (NK1) receptors expressed by ICC-IM. Both receptors couple through Gq/11 and activate phospholipase Cβ (PLCβ) and production of IP3 and diacylglycerol (not shown). IP3 binds to IP3Rs in the ER (not shown) and causes intense release of Ca2+ (depicted as multiple black arrows from ER) and activation of Ano1 channels in the plasma membrane. This is a depolarizing response that conducts to SMCs via GJs and summates with the slow waves that are ongoing in the syncytium. EINs release NO, purines (β-NAD), and peptides (depicted here as VIP but also likely to include PACAP). NO binds to soluble guanylyl cyclase (GCα/GCβ dimer) in ICC, SMCs, and possibly in PDGFRα+ cells (not shown) that also express these subunits but no response has been documented. GCα/GCβ dimers in ICC generate cGMP and activate protein kinase G (PKG) or inhibit phosphodiesterases (PDE). The mechanisms coupled to these effectors are not entirely understood. But PKG is linked to reduction in Ca2+ release from ER (dotted arrow), and this decreases or halts activation of Ano1 currents (X). This is a hyperpolarizing trend that can also conduct to SMCs via GJs. In SMCs GCα/GCβ dimers can also be activated by NO, causing reduced Ca2+ sensitization of the CE and reduction in the force of contraction. β-NAD (and possibly other purines) is/are released from EINs and bind to P2Y1 receptors on PDGFRα+ cells. This activates PLCβ, generates IP3, and causes Ca2+ release from ER. Ca2+ release activates small-conductance Ca2+-activated K+ channels in PDGFRα+ cells. This pathway generates strong hyperpolarization that conducts to SMCs via GJ. Hyperpolarization of SMCs tends to reduce the open probability of L-type Ca2+ channels, restricting Ca2+ entry and reducing the force of contractions. Functions and responses of SIP cells to inhibitory peptides are not yet clarified

References

    1. Sanders KM, Koh SD, Ro S, Ward SM. Regulation of gastrointestinal motility-insights from smooth muscle biology. Nat Rev Gastroenterol Hepatol. 2012;9(11):633–45. - PMC - PubMed
    1. Sanders KM, Ward SM, Koh SD. Interstitial cells: regulators of smooth muscle function. Physiol Rev. 2014;94(3):859–907. - PMC - PubMed
    1. Huizinga JD, Thuneberg L, Kluppel M, Malysz J, Mikkelsen HB, Bernstein A. W/kit gene required for interstitial cells of Cajal and for intestinal pacemaker activity. Nature. 1995;373(6512):347–9. - PubMed
    1. Langton P, Ward SM, Carl A, Norell MA, Sanders KM. Spontaneous electrical activity of interstitial cells of Cajal isolated from canine proximal colon. Proc Natl Acad Sci U S A. 1989;86(18):7280–4. - PMC - PubMed
    1. Ward SM, Burns AJ, Torihashi S, Sanders KM. Mutation of the proto-oncogene c-kit blocks development of interstitial cells and electrical rhythmicity in murine intestine. J Physiol. 1994;480 (Pt 1:91–7. - PMC - PubMed

LinkOut - more resources