. 2020 Jan 10;30(1):353-370.
doi: 10.1093/cercor/bhz092.

Evidence for Similar Prefrontal Structural and Functional Alterations in Male and Female Rats Following Chronic Stress or Glucocorticoid Exposure

Affiliations

Evidence for Similar Prefrontal Structural and Functional Alterations in Male and Female Rats Following Chronic Stress or Glucocorticoid Exposure

Rachel M Anderson et al. Cereb Cortex. .

Abstract

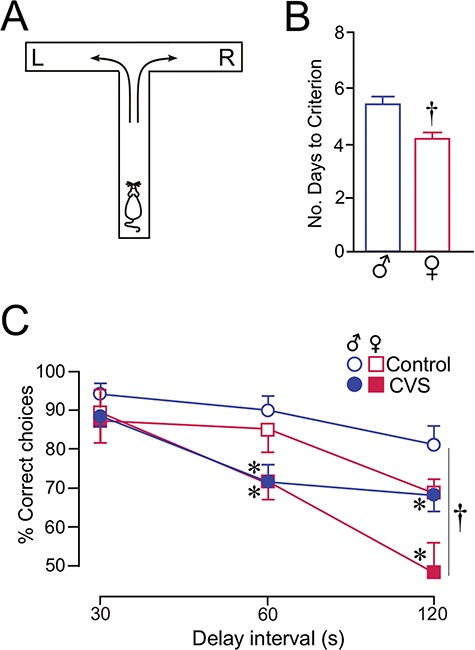
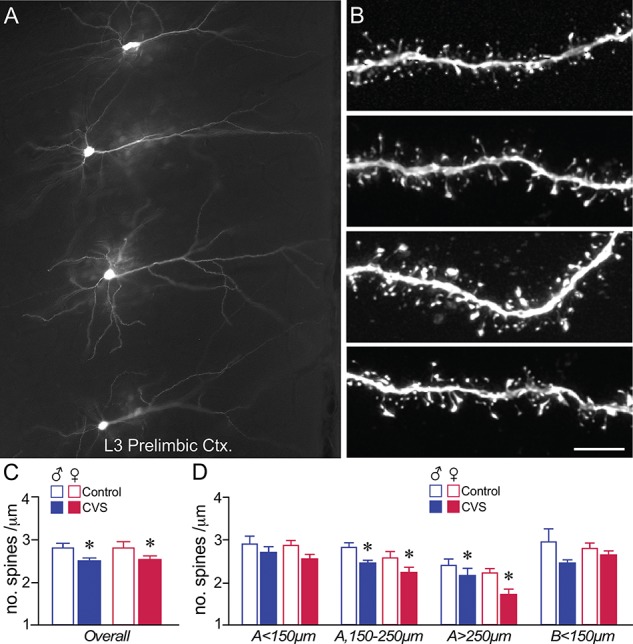
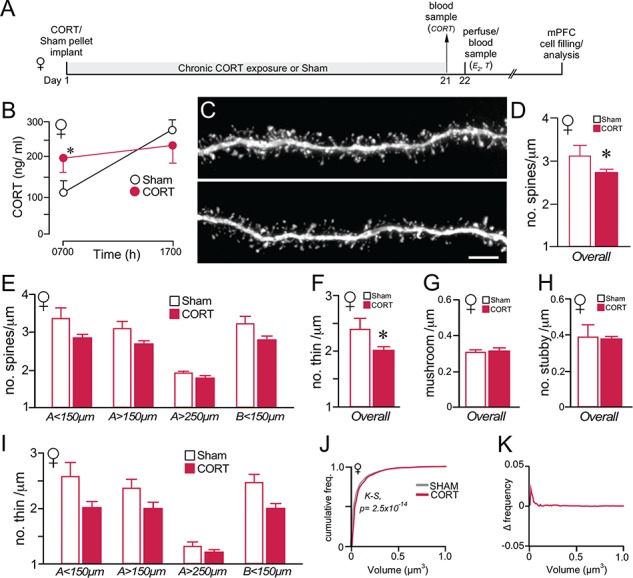
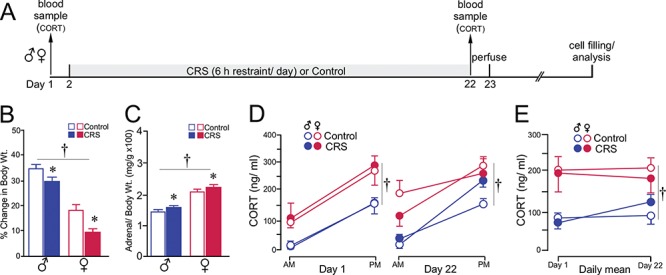
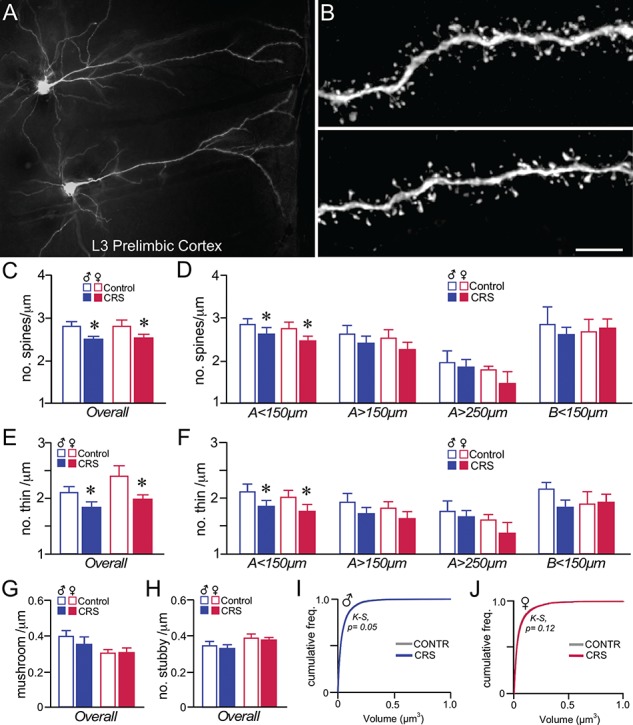
Previous work of ours and others has documented regressive changes in neuronal architecture and function in the medial prefrontal cortex (mPFC) of male rats following chronic stress. As recent focus has shifted toward understanding whether chronic stress effects on mPFC are sexually dimorphic, here we undertake a comprehensive analysis to address this issue. First, we show that chronic variable stress (14-day daily exposure to different challenges) resulted in a comparable degree of adrenocortical hyperactivity, working memory impairment, and dendritic spine loss in mPFC pyramidal neurons in both sexes. Next, exposure of female rats to 21-day regimen of corticosterone resulted in a similar pattern of mPFC dendritic spine attrition and increase in spine volume. Finally, we examined the effects of another widely used regimen, chronic restraint stress (CRS, 21-day of daily 6-h restraint), on dendritic spine changes in mPFC in both sexes. CRS resulted in response decrements in adrenocortical output (habituation), and induced a pattern of consistent, but less widespread, dendritic spine loss similar to the foregoing challenges. Our data suggest that chronic stress or glucocorticoid exposure induces a relatively undifferentiated pattern of structural and functional alterations in mPFC in both males and females.

Keywords: corticosterone; delayed alternation; dendritic spine; prelimbic; sex differences.


Figures

Figure 1
Figure 1
CVS results in a comparable degree of adrenocortical hyperactivity in both sexes. (A) Timelines of the first experiment, displaying individual timelines for each cohort (1 and 2). (B, C) Both groups of rats showed decreases in body weight gain (B) and adrenal hypertrophy (C) through the course of the 14-day CVS period. (D) Graph depicting mean ± SEM plasma CORT levels at AM and PM sampling of CORT as a function of sex and treatment group. Measurements were taken in the same rats prior (left) to and following (right) CVS. CVS resulted in significantly increased PM levels of CORT (*, P < 0.05), regardless of sex. (E) Graph showing changes in the daily mean values of CORT levels pre- and post-CVS as a function of sex and treatment group. CVS increased levels of CORT in both sexes (*, P < 0.05), whereas levels of CORT were higher in female rats (†, P < 0.05). N = 10–11/group.
Figure 2
Figure 2
CVS impairs spatial working memory in both sexes. (A) Schematic diagram of the T maze (90 × 65 cm) used for delayed alternation. Rats are placed in the starting location (as shown) and were rewarded for selecting the opposite goal arm (e.g., right, R) from the previous trial (left, L). As the delay interval between each trial is increased, the percentage of correct choices provides a measure of spatial working memory. (B) Histogram shows the average number of days that males and females required to reach an equivalent level of performance in the delayed alternation task (≥80% choice accuracy at a 15-s delay). Female rats took fewer days to reach criterion than males (*, P < 0.05). N = 20–21/group. (C) Graph demonstrating the percentage of correct responses at increasing delay intervals. Behavioral impairments were noted as both a function of increasing delay interval and as a function of CVS (*, P < 0.05). Females performed at lower levels of choice accuracies at the 120-s time point (†, P < 0.05), although this showed no interaction with the effects of CVS (P = 0.3). N = 10–11 rats/group.
Figure 3
Figure 3
CVS induces dendritic spine loss in PL pyramidal neurons in male and female rats. (A) Darkfield photomicrograph depicting several layer 3 pyramidal neurons in PL targeted for intracellular dye-injection with Lucifer Yellow. (B) Examples of deconvolved images of dendritic segments from layer 2/3 pyramidal neurons in PL. Scale bar = 75 μm (A), 5 μm (B). (C, D) Mean + SEM for overall (i.e., summated and averaged across the 4 different regions of the arbor) dendritic spine density (C) and density as a function of the specific dendritic compartment sampled (D). CVS decreased overall spine density that was accounted for by downward trends throughout both apical and basal dendrites, and significant decreases in distal apical dendrites. *, indicates significant difference between control and CVS; P < 0.05 (C), P < 0.0125 (D). Males: N = 5, control; N = 5 CVS; females: N = 10 control; N = 13 CVS.
Figure 4
Figure 4
Effects of CVS on dendritic spine morphology in male and female rats. (A) Example of high-resolution deconvolved optical z-stack of a dendritic segment used for spine analysis with NeuronStudio Software. Open colored circles designate spine subtypes based upon user-defined parameters in the software. Scale bar = 5 μm. (B–G) Mean + SEM of dendritic spine subtypes. When considered as overall averages, thin (B) and mushroom (D) subtypes displayed significant decreases following CVS, with thin spines significantly decreased in distal apical (>250 μm) dendrites (C), but no differences in any distances with mushroom subtypes (E). (F, G) Since overall densities for stubby spine subtypes did not show significant decreases in any variable (F), no post hoc tests were performed at dendritic distances (G). *, indicates significant difference between control and CVS; P < 0.05 (B, D), P < 0.0125 (C). Males: N = 5, control; N = 5 CVS; females: N = 10 control; N = 13 CVS. (H–K) Cumulative frequency distributions of overall spine volume in PL neurons reveal graded leftward shifts (i.e., decrease) in spine volume in male rats (H) and rightward shifts (i.e., increase) in female rats (J) following CVS exposure. Plots in I and K display the difference between each function in H and J, respectively, with negative values indicating that spines up to that volume make up a smaller proportion of the CVS than control group, and positive values the opposite. K-S, Kolmogorov–Smirnov test, significance set at P < 0.01.
Figure 5
Figure 5
Chronic CORT effects on PL dendritic spine morphology in female rats. (A) Timeline of the second experiment; this is same design as in a previous experiment of ours comparing the effects of chronic CORT exposure on PL dendritic spine morphology in male rats (Anderson et al., 2016). (B) Graph depicting mean ± SEM plasma CORT levels at AM and PM sampling of plasma CORT levels on day 21 of the experiment. Blood samples were collected to verify CORT implant (s.c.) efficacy relative to sham rats implanted with cholesterol pellets. (C) Examples of deconvolved images of dendritic segments from layer 2/3 pyramidal neurons in PL. Scale bar = 5 μm. (D, E) Overall (D) spine densities are decreased following chronic CORT exposure, along with nonsignificant downward trends across dendritic distances (E). (F–H) Chronic CORT treatment decreased thin spine (F), but not mushroom (G) or stubby (H) subtype density. (I) Breakdown of thin spine loss following CORT treatment as a function of different dendritic compartments, illustrates trends but no significant decreases at all distances. *, P < 0.05 (N = 7 CORT; N = 5 Sham). (J) Cumulative distribution frequencies of overall spine volume in PL neurons reveal rightward shifts (i.e., increase) in the CORT versus control group. (K) Graph displaying the difference between each function in J, with positive values indicating that spines up to that volume comprise a greater proportion of the CORT than control group. K-S, Kolmogrov-Smirnov test, significance set at P < 0.01.
Figure 6
Figure 6
CRS produces a comparable adrenocortical signature in both sexes. (A) Timeline of the third experiment. (B, C) Both groups of rats showed decreases in body weight gain (B) and adrenal hypertrophy (C) through the course of the 21-day CRS period. (D) Graph depicting mean ± SEM plasma CORT levels at AM and PM sampling of CORT as a function of sex and treatment group. Measurements were taken in the same rats prior (day 1) to and following (day 22) CRS. (E) Graph showing changes in the daily mean values of plasma CORT levels pre- and post-CRS as a function of sex and treatment group. Although sex differences in plasma CORT were evident (†, P < 0.05), CRS did not result in any significant increase in CORT levels, as contrasted by the effects of CVS (i.e., compare with Fig. 1E). N = 6–8/group.
Figure 7
Figure 7
CRS induces dendritic spine loss in PL pyramidal neurons in male and female rats. (A) Darkfield photomicrograph illustrating examples of Lucifer Yellow dye-filled layer 3 pyramidal neurons in PL. (B) Examples of deconvolved images of dendritic segments from layer 2/3 pyramidal neurons in PL. Scale bar = 50 μm (A), 5 μm (B). (C, D) Mean + SEM for overall dendritic spine density (C) and density values within specific dendritic compartments (D). CRS decreased overall spine density in both sexes, and was accounted for by downward trends throughout all apical dendritic compartments, and significant decreases in the < 150-μm apical distance. (E, F) Both the overall density of thin spine subtypes (E) and density values within the specific dendritic compartments sampled (F) illustrate an attrition in this subtype following CRS that accounts for much of the overall decreases above. *, indicates significant difference between control and CVS; P < 0.05 (C, E), P < 0.0125 (D, F). N = 6–8/group. (G, H) CRS had no effect on mushroom (G) or stubby (H) subtypes in PL neurons. (I–J) Cumulative frequency distributions of overall spine volume in PL neurons do not reveal any significant population shifts in spine volume. K-S, Kolmogrov-Smirnov test, significance set at P < 0.01.

References

    1. Anderson RM, Birnie AK, Koblesky NK, Romig-Martin SA, Radley JJ. 2014. Adrenocortical status predicts the degree of age-related deficits in prefrontal structural plasticity and working memory. The Journal of Neuroscience. 34:8387–8397. - PMC - PubMed
    1. Anderson RM, Glanz RM, Johnson SB, Miller MM, Romig-Martin SA, Radley JJ. 2016. Prolonged corticosterone exposure induces dendritic spine remodeling and attrition in the rat medial prefrontal cortex. The Journal of Comparative Neurology. 524:3729–3746. - PMC - PubMed
    1. Arnsten AF. 2000. Stress impairs prefrontal cortical function in rats and monkeys: role of dopamine D1 and norepinephrine a-1 receptor mechanisms. Progress in Brain Research. 126:183–192. - PubMed
    1. Arnsten AF, Paspalas CD, Gamo NJ, Yang Y, Wang M. 2010. Dynamic network connectivity: a new form of neuroplasticity. Trends in Cognitive Sciences. 14:365–375. - PMC - PubMed
    1. Ashby MC, Maier SR, Nishimune A, Henley JM. 2006. Lateral diffusion drives constitutive exchange of AMPA receptors at dendritic spines and is regulated by spine morphology. The Journal of Neuroscience. 26:7046–7055. - PMC - PubMed

Publication types

Substances