Electron paramagnetic resonance oximetry as a novel approach to monitor the effectiveness and quality of red blood cell transfusions
- PMID: 31184583
- PMCID: PMC6683865
- DOI: 10.2450/2019.0037-19
Electron paramagnetic resonance oximetry as a novel approach to monitor the effectiveness and quality of red blood cell transfusions
Abstract
Background: The goal of red blood cell transfusion is to improve tissue oxygenation. Assessment of red blood cell quality and individualised therapeutic needs can be optimised using direct oxygen (O2) measurements to guide treatment. Electron paramagnetic resonance oximetry is capable of accurate, repeatable and minimally invasive measurements of tissue pO2. Here we present preclinical proof-of-concept of the utility of electron paramagnetic resonance oximetry in an experimental setting of acute blood loss, transfusion, and post-transfusion monitoring.
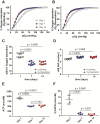
Materials and methods: Donor rat blood was collected, leucocyte-reduced, and stored at 4 °C in AS-3 for 1, 7 and 14 days. Red blood cell morphology, O2 equilibrium, p50 and Hill numbers from O2 binding and dissociation curves were evaluated in vitro. Recipient rats were bled and maintained at a mean arterial pressure of 30-40 mmHg and hind limb muscle (biceps femoris) pO2 at 25-50% of baseline. Muscle pO2 was monitored continuously over the course of experiments to assess the effectiveness of red blood cell preparations at different stages of blood loss and restoration.
Results: Red blood cell morphology, O2 equilibrium and p50 values of intra-erythrocyte haemoglobin were significantly altered by refrigerated storage for both 7 and 14 days. Transfusion of red blood cells stored for 7 or 14 days demonstrated an equivalently impaired ability to restore hind limb muscle pO2, consistent with in vitro observations and transfusion with albumin. Red blood cells refrigerated for 1 day demonstrated normal morphology, in vitro oxygenation and in vivo restoration of tissue pO2.
Discussion: Electron paramagnetic resonance oximetry represents a useful approach to assessing the quality of red blood cells and subsequent transfusion effectiveness.
Conflict of interest statement
Figures


Similar articles
-
Measurement of Tissue Oxygen as a Novel Approach to Optimizing Red Blood Cell Quality Assessment.Adv Exp Med Biol. 2021;1269:379-386. doi: 10.1007/978-3-030-48238-1_60. Adv Exp Med Biol. 2021. PMID: 33966246
-
Can molecular markers of oxygen homeostasis and the measurement of tissue oxygen be leveraged to optimize red blood cell transfusions?Curr Opin Hematol. 2019 Nov;26(6):453-460. doi: 10.1097/MOH.0000000000000533. Curr Opin Hematol. 2019. PMID: 31483333 Review.
-
The effects of anesthesia on cerebral tissue oxygen tension: use of EPR oximetry to make repeated measurements.Adv Exp Med Biol. 2003;530:569-75. doi: 10.1007/978-1-4615-0075-9_55. Adv Exp Med Biol. 2003. PMID: 14562753
-
Absolute oxygen R1e imaging in vivo with pulse electron paramagnetic resonance.Magn Reson Med. 2014 Aug;72(2):362-8. doi: 10.1002/mrm.24926. Epub 2013 Sep 4. Magn Reson Med. 2014. PMID: 24006331 Free PMC article.
-
In Vivo pO2 Imaging of Tumors: Oxymetry with Very Low-Frequency Electron Paramagnetic Resonance.Methods Enzymol. 2015;564:501-27. doi: 10.1016/bs.mie.2015.08.017. Epub 2015 Sep 26. Methods Enzymol. 2015. PMID: 26477263 Free PMC article. Review.
Cited by
-
Measurement of Tissue Oxygen as a Novel Approach to Optimizing Red Blood Cell Quality Assessment.Adv Exp Med Biol. 2021;1269:379-386. doi: 10.1007/978-3-030-48238-1_60. Adv Exp Med Biol. 2021. PMID: 33966246
-
NIH Workshop 2018: Towards Minimally Invasive or Noninvasive Approaches to Assess Tissue Oxygenation Pre- and Post-transfusion.Transfus Med Rev. 2021 Jan;35(1):46-55. doi: 10.1016/j.tmrv.2020.12.003. Epub 2020 Dec 6. Transfus Med Rev. 2021. PMID: 33353783 Free PMC article. Review. No abstract available.
-
Personalised Transfusion Medicine.Blood Transfus. 2019 Jul;17(4):255-257. doi: 10.2450/2018.0142-19. Blood Transfus. 2019. PMID: 31385798 Free PMC article. No abstract available.
References
-
- Baek JH, Yalamanoglu A, Moon SE, et al. Evaluation of renal oxygen homeostasis in a preclinical animal model to elucidate difference in blood quality after transfusion. Transfusion. 2018;58:1474–85. - PubMed
-
- Jacobi B, Bongartz G, Partovi S, et al. Skeletal muscle BOLD MRI: from underlying physiological concepts to its usefulness in clinical conditions. J Magn Reson Imaging. 2012;35:1253–65. - PubMed
MeSH terms
Substances
LinkOut - more resources
Full Text Sources
Research Materials
