. 2019 Jun 11;15(6):e1006903.
doi: 10.1371/journal.pcbi.1006903. eCollection 2019 Jun.

Models that learn how humans learn: The case of decision-making and its disorders

Affiliations

Models that learn how humans learn: The case of decision-making and its disorders

Amir Dezfouli et al. PLoS Comput Biol. .

Abstract

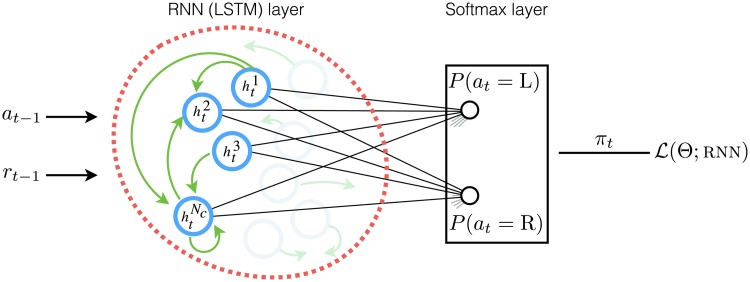
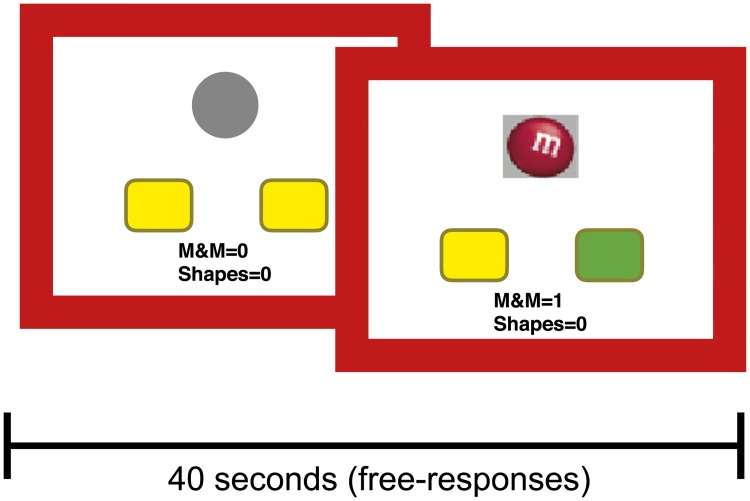
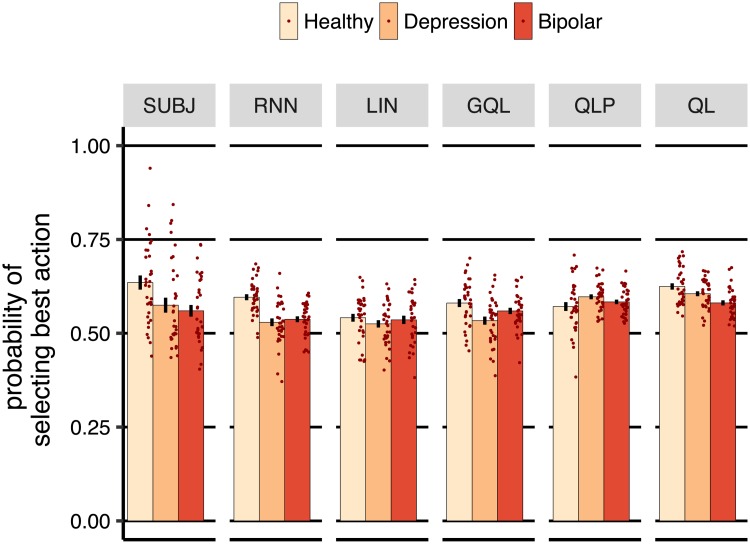
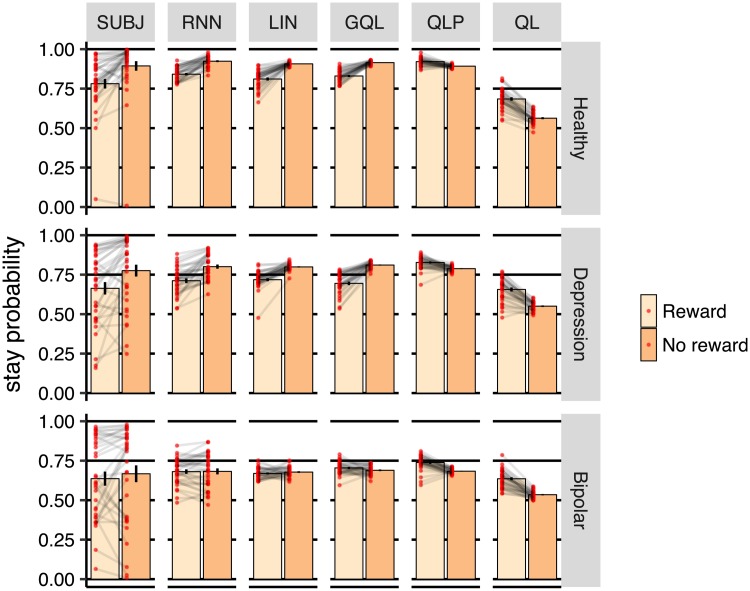
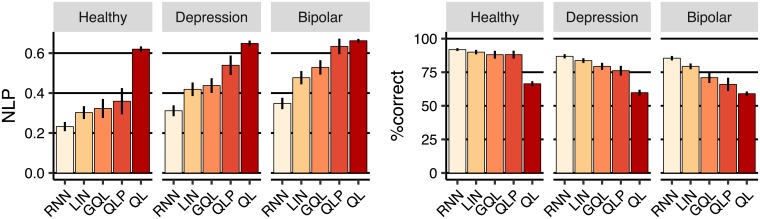
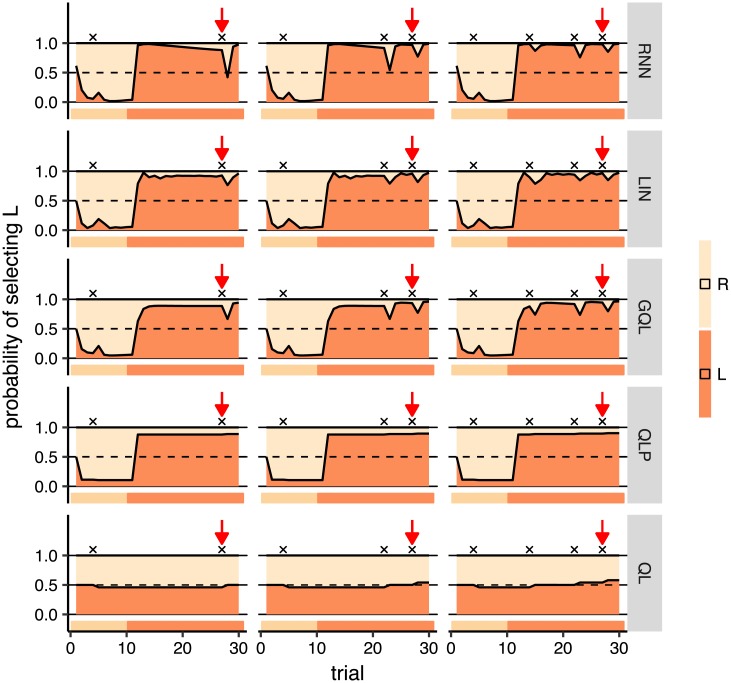
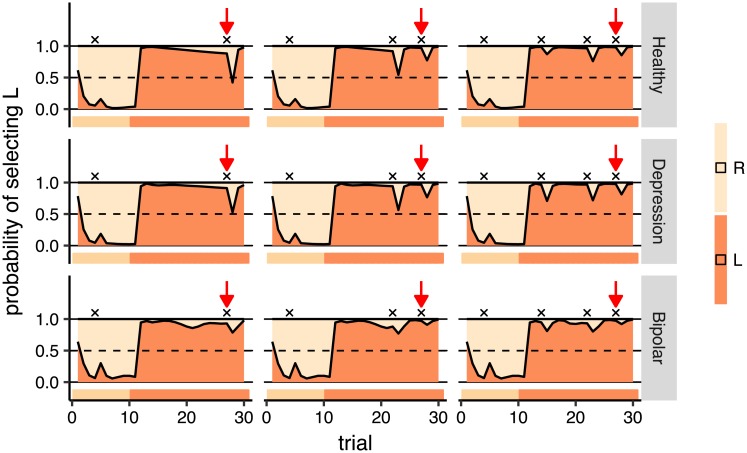
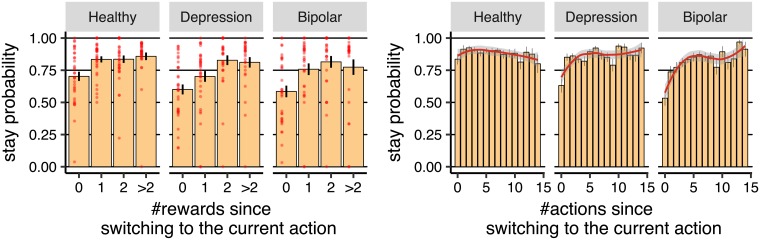
Popular computational models of decision-making make specific assumptions about learning processes that may cause them to underfit observed behaviours. Here we suggest an alternative method using recurrent neural networks (RNNs) to generate a flexible family of models that have sufficient capacity to represent the complex learning and decision- making strategies used by humans. In this approach, an RNN is trained to predict the next action that a subject will take in a decision-making task and, in this way, learns to imitate the processes underlying subjects' choices and their learning abilities. We demonstrate the benefits of this approach using a new dataset drawn from patients with either unipolar (n = 34) or bipolar (n = 33) depression and matched healthy controls (n = 34) making decisions on a two-armed bandit task. The results indicate that this new approach is better than baseline reinforcement-learning methods in terms of overall performance and its capacity to predict subjects' choices. We show that the model can be interpreted using off-policy simulations and thereby provides a novel clustering of subjects' learning processes-something that often eludes traditional approaches to modelling and behavioural analysis.


Conflict of interest statement

Part of this work was conducted while PD was visiting Uber Technologies. The latter played no role in its design, execution or communication.

Figures

Fig 1
Fig 1. Structure of the rnn model.
The model has an lstm layer (shown by red dashed line) which receives the previous action and reward as inputs, and is connected to a softmax layer (shown by a black rectangle) which outputs the probability of selecting each action on the next trial (policy). The lstm layer is composed of a set of lstm cells (Nc cells shown by blue circles), that are connected to each other (shown by green arrows). The outpt of the cells (denoted by hti for cell i at time t) are connected to a softmax layer using a set of connections shown by black lines. The free parameters of the model (in both lstm and softmax layers) are denoted by Θ, and L(Θ,rnn) is a metric which represents how well the model fits subjects’ data and is used to adjust the parameters of the model using the maximum-likelihood estimate as the network learns how humans learn.
Fig 2
Fig 2. Structure of the decision-making task.
Subjects had a choice between a left keypress (L) and a right keypress (R), shown by yellow rectangles. Before the choice, no indication was given as to which button was more likely to lead to reward. When the participant made a rewarded choice, the button chosen was highlighted (green) and a picture of the earned reward was presented for 500ms (M&M chocloate in this case). The task was divided into 12 different blocks each lasting for 40 seconds and separated by a 12-second inter-block interval. Within each block actions were self-paced and participants were free to complete as many trials as they could within the 40 second time limit. The probability of earning a reward from each action was varied between the blocks. See the text for more details about the probabilities of earning rewards from actions.
Fig 3
Fig 3. Probability of selecting the action with the higher reward probability (averaged over subjects).
subj refers to the data of the experimental subjects, whereas the remaining columns show simulations of the models trained on the task (on-policy simulations) with the same reward probabilities and for the same number of trials that each subject completed. Each dot represents a subject and error-bars represent 1 SEM.
Fig 4
Fig 4. Probability of staying on the same action based on whether the previous trial was rewarded (reward) or not rewarded (no reward), averaged over subjects.
subj shows the data from subjects and results of columns are derived from on-policy simulations of various models on the task. Each dot represents a subject and error-bars represent 1SEM.
Fig 5
Fig 5. Cross-validation results.
(Left-panel) nlp (negative log-probability) averaged across leave-one-out cross-validation folds. Lower values are better. (Right-panel) Percentage of actions predicted correctly averaged over cross-validation folds. Error-bars represent 1SEM.
Fig 6
Fig 6. Off-policy simulations of all models for group healthy.
Each panel shows a simulation of 30 trials (horizontal axis), and the vertical axis shows the predictions of each model on each trial. The ribbon below each panel shows the action which was fed to the model on each trial. In the first 10 trials, the action that the model received was R and in the next 20 trials it was L. Rewards are shown by black crosses (x) on the graphs. Red arrows point to the same trial number in all the simulations and are shown to compare changes in the predictions in that trial between different simulations. The sequence of rewards and actions fed to the model are the same for the panels in each column, but they are different across the columns. See text for the interpretation of the graph.
Fig 7
Fig 7. Off-policy simulations of rnn for all groups.
Each panel shows a simulation of 30 trials (horizontal axis), and the vertical axis shows the predictions for each group on each trial. The ribbon below each panel shows the action which was fed to the model on each trial. In the first 10 trials, the action that the model received was R and in the next 20 trials it was L. Rewards are shown by black crosses (x) on the graphs, and the red arrows point to the same trial number in all the panels. See text for the interpretation of the graph. Note that the simulation conditions are the same as those shown in Fig 6, and the first row here (healthy group) is the same as the first row shown in Fig 6 which is shown again for comparison with the other groups.
Fig 8
Fig 8. The effect of the history of previous rewards and actions on the future choices of the subjects.
(Left-panel) The probability of staying with an action after earning reward as a function of the number of rewards earned since switching to the current action (averaged over subjects). Each red dot represents the data for one subject. (Right-panel) The probability of staying with an action as a function of the number of actions taken since switching to the current action. The red line was obtained using Loess regression (Local Regression), which is a non-parametric regression approach. The grey area around the red line represents the 95% confidence interval. Error-bars represent 1SEM.
Fig 9
Fig 9. The median number of actions executed sequentially before switching to another action (run of actions) as a function of the length of the previous run of actions (averaged over subjects).
The dotted line shows the points at which the length of the previous and the current run of actions were the same. Note that the median was used instead of the average to illustrate the most common ‘current run length’, instead of the average run length for each subject. The results for actual data are shown in subj column, and the remaining columns show the results using the on-policy simulations of the models in the task. Error-bars represent 1SEM.
Fig 10
Fig 10. Mixed off-policy and on-policy simulations of the models.
Each panel shows a simulation of 20 trials for which the first nine trials were off-policy and the subsequent trials were on-policy, during which the action with the highest probability was selected. Trials marked with green ribbons were off-policy (actions were fed to the model), whereas the trials marked with blue ribbons were on-policy (actions were selected by the model). The ribbon below each panel shows the actions that were fed to the model (for the first 9 trials), and the actions that were selected by the model (on the subsequent trials). During off-policy trials, the sequence of actions that was fed to the model was R, R, R, R, R, R, L, R, L. See the text for interpretation.

Similar articles

Cited by

References

    1. Busemeyer JR, Diederich A. Cognitive modeling. Sage; 2010.
    1. Daw ND. Trial-by-trial data analysis using computational models In: Delgado MR, Phelps EA, Robbins TW, editors. Decision Making, Affect, and Learning. Oxford University Press; 2011.
    1. Gold JI, Shadlen MN. The neural basis of decision making. Annual review of neuroscience. 2007;30 10.1146/annurev.neuro.29.051605.113038 - DOI - PubMed
    1. Piray P, Zeighami Y, Bahrami F, Eissa AM, Hewedi DH, Moustafa AA. Impulse control disorders in Parkinson’s disease are associated withdysfunction in stimulus valuation but not action valuation. The Journal of neuroscience. 2014;34(23):7814–24. 10.1523/JNEUROSCI.4063-13.2014 - DOI - PMC - PubMed
    1. Busemeyer JR, Stout JC. A contribution of cognitive decision models to clinical assessment:decomposing performance on the Bechara gambling task. Psychological assessment. 2002;14(3):253–62 - PubMed

Publication types