. 2019 Jun 3;19(6):13.
doi: 10.1167/19.6.13.

Behavioral and oculomotor evidence for visual simulation of object movement

Affiliations

Behavioral and oculomotor evidence for visual simulation of object movement

Aarit Ahuja et al. J Vis. .

Abstract

We regularly interact with moving objects in our environment. Yet, little is known about how we extrapolate the future movements of visually perceived objects. One possibility is that movements are experienced by a mental visual simulation, allowing one to internally picture an object's upcoming motion trajectory, even as the object itself remains stationary. Here we examined this possibility by asking human participants to make judgments about the future position of a falling ball on an obstacle-filled display. We found that properties of the ball's trajectory were highly predictive of subjects' reaction times and accuracy on the task. We also found that the eye movements subjects made while attempting to ascertain where the ball might fall had significant spatiotemporal overlap with those made while actually perceiving the ball fall. These findings suggest that subjects simulated the ball's trajectory to inform their responses. Finally, we trained a convolutional neural network to see whether this problem could be solved by simple image analysis as opposed to the more intricate simulation strategy we propose. We found that while the network was able to solve our task, the model's output did not effectively or consistently predict human behavior. This implies that subjects employed a different strategy for solving our task, and bolsters the conclusion that they were engaging in visual simulation. The current study thus provides support for visual simulation of motion as a means of understanding complex visual scenes and paves the way for future investigations of this phenomenon at a neural level.


Figures

Figure 1
Figure 1
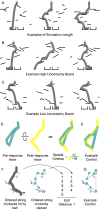
(A) An example the stimuli used. Subjects were shown a static display and asked to judge which catcher the ball would land in, were it to be dropped. (B) An outline of one complete trial.
Figure 2
Figure 2
(A) Examples of boards where the ball hit one, three, or five planks (ordered from left to right). The number of planks hit served as an indicator of simulation length, since it dictated both the length of the ball's trajectory, as well as the number of discrete events contained within it. (B) An example of a board where introducing some jitter to the position of the planks had a significant impact on the calculated outcome of the ball's trajectory. Boards like this were assigned high uncertainty scores. (C) An example of a board where this same jitter never changed the calculated outcome of the ball's trajectory. Boards like this were assigned low uncertainty scores. A demonstration of our jitter/uncertainty assignment method can be found in Supplementary Movie S1. (D) A schematic depicting our method for determining spatial overlap. A pre-response saccade trace (left) was overlaid with a post-response smooth pursuit trace (middle), and the intersection of the two was divided by the union (right). This allowed us to assess the degree of spatial similarity between saccades made while determining the ball's final location, and pursuit of the falling ball. (E) As a control, we repeated this same analysis with randomly shuffled, unrelated sets of eye movements to determine a chance level of spatial overlap. (F) A schematic depicting our method for determining temporal overlap. We used edit distance to calculate the sequence similarity between the ordered list of planks hit by the ball and the ordered list of planks looked at by the subjects. (G) As a control, we randomly shuffled the order of the saccades (as indicated by the dotted arrows) to generate a new plank viewing sequence that had no cohesive temporal progression. We then repeated the edit distance calculation with this string to determine a chance level of temporal overlap.
Figure 3
Figure 3
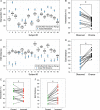
(A) Across subjects average normalized reaction time and accuracy as a function of the simulation length value assigned to every board. Each black point represents one board from the set of 200 boards that was shown to all subjects. The gray shaded regions represent the 1st–3rd quartile of each distribution. (B) Across subjects average normalized reaction time and accuracy as a function of the simulation-based uncertainty value assigned to every board. In both (A) and (B), the solid line represents the slope of the linear regression, and the dotted lines represent the 95% confidence interval (CI) for the slope of the regression line. The red bars in the accuracy sections of both graphs represent the standard error of the across-subject means for the boards falling in each category/bin. (C) A histogram showing the slopes of the regression in (A) when carried out with each individual subject's data instead of sample wide averages. (D) A histogram showing the slopes of the regression in (B) when carried out with each individual subject's data instead of sample wide averages.
Figure 4
Figure 4
(A) A breakdown of each subject's chance intersection values versus their actual intersection value. Box plots represent a distribution of twenty chance intersection values generated by shuffling (whiskers span maximum to minimum), and blue points represent actual mean intersection values. (B) Pairwise comparisons of chance versus actual intersection values for each subject. Black points represent the average of each box plot in (A). (C) and (D) Same as (A) and (B), but for edit distance instead of intersection. (E) and (F) Pairwise comparisons of intersection and edit distance values on trials that subjects got correct versus incorrect.
Figure 5
Figure 5
(A) Subjects' accuracy on this task versus the CNN model's accuracy. (B) Across subjects average normalized reaction time and accuracy for each board as a function of the CNN-based uncertainty value assigned to that board. The dotted lines represent the 95% CI for the slope of the regression line. (C) A histogram showing the slopes of the regression of reaction time onto CNN uncertainty (as shown in 5B) and simulation uncertainty (as shown in 3B) when carried out with each individual subject's data instead of sample wide averages. (D) A histogram showing the same comparison as in (C), but with the R2 values for each model.

Similar articles

Cited by

References

    1. Ballard D. H, Hayhoe M. M, Pook P. K, Rao R. P. Deictic codes for the embodiment of cognition. Behavioral and Brain Sciences. (1997);20(4):723–767. - PubMed
    1. Banca P, Sousa T, Duarte I. C, Castelo-Branco M. Visual motion imagery neurofeedback based on the hMT+/V5 complex: Evidence for a feedback-specific neural circuit involving neocortical and cerebellar regions. Journal of Neural Engineering. (2015);12(6):066003. doi: 10.1088/1741-2560/12/6/066003. - DOI - PubMed
    1. Barsalou L. Grounded cognition. Annual Review of Psychology. (2008);59(1):617–645. doi: 10.1146/annurev.psych.59.103006.093639. - DOI - PubMed
    1. Battaglia P, Hamrick J, Tenenbaum J. Simulation as an engine of physical scene understanding. Proceedings of the National Academy of SciencesUSA. (2013);110(45):18327–18332. doi: 10.1073/pnas.1306572110. - DOI - PMC - PubMed
    1. Bisley J. W, Zaksas D, Droll J. A, Pasternak T. Activity of neurons in cortical area MT during a memory for motion task. Journal of Neurophysiology. (2004);91:286–300. doi: 10.1152/jn.00870.2003. - DOI - PubMed

Publication types