. 2019 Jun 10;35(6):885-900.e10.
doi: 10.1016/j.ccell.2019.05.004.

Cooperation between Constitutive and Inducible Chemokines Enables T Cell Engraftment and Immune Attack in Solid Tumors

Affiliations

Cooperation between Constitutive and Inducible Chemokines Enables T Cell Engraftment and Immune Attack in Solid Tumors

Denarda Dangaj et al. Cancer Cell. .

Abstract

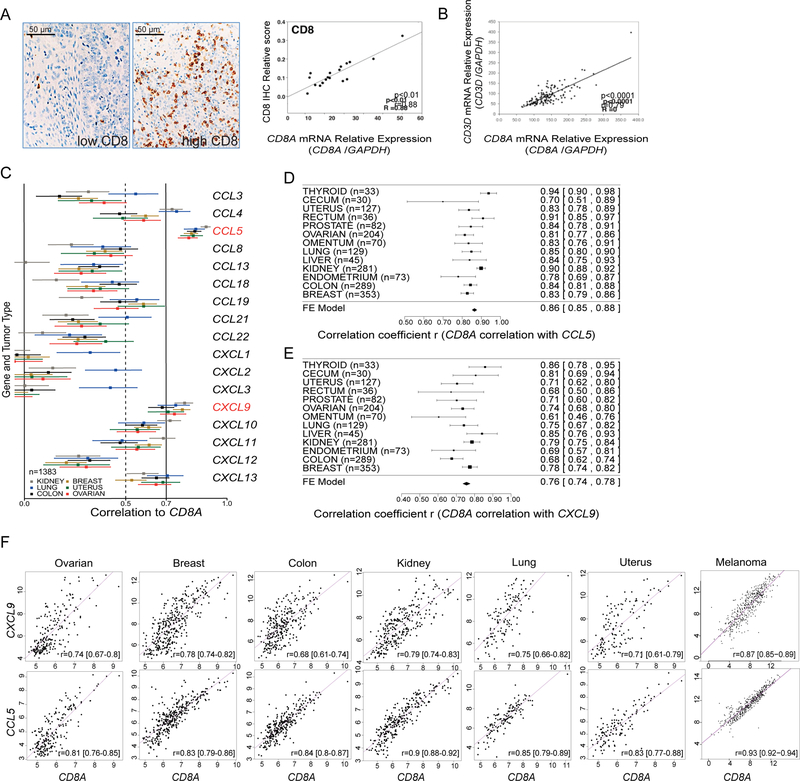
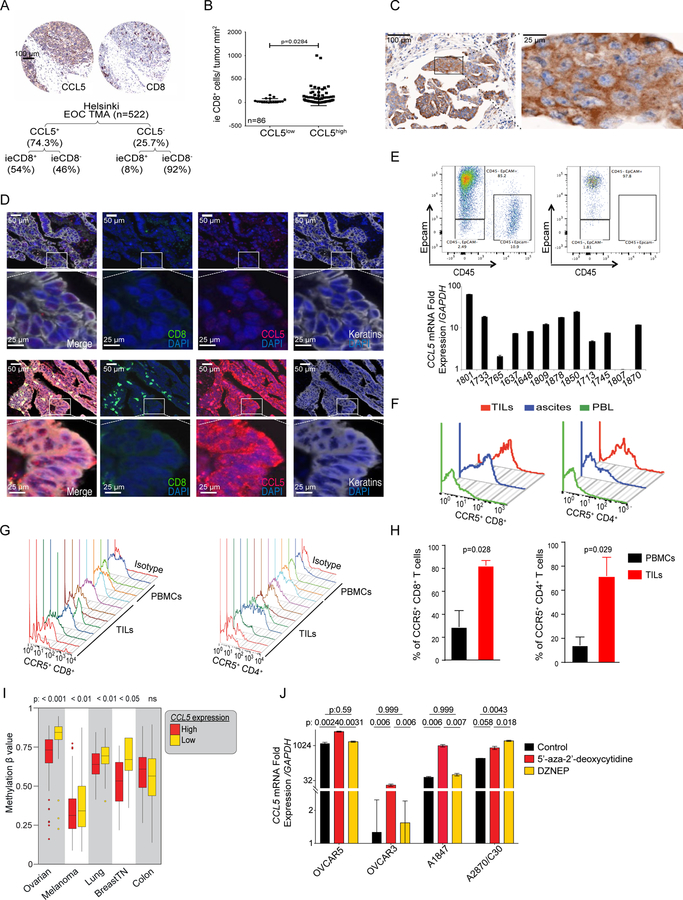
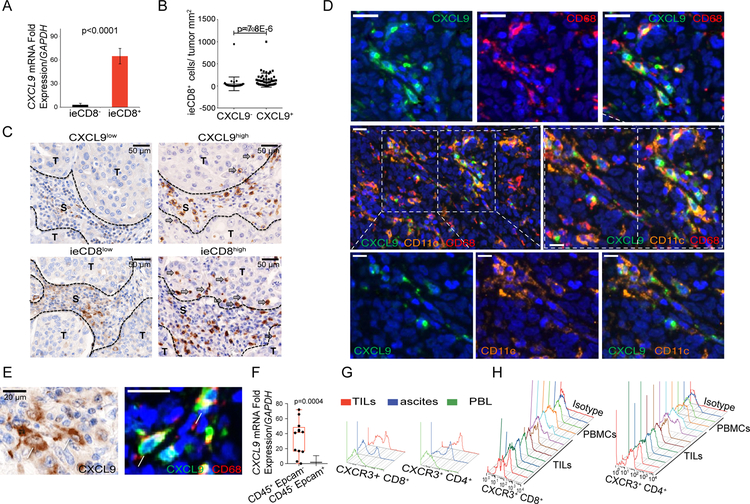
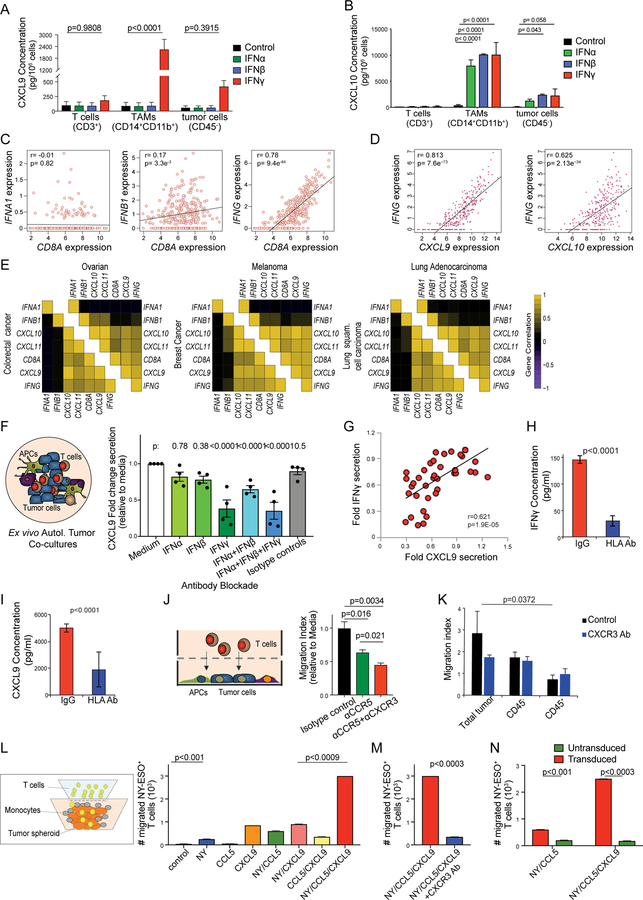
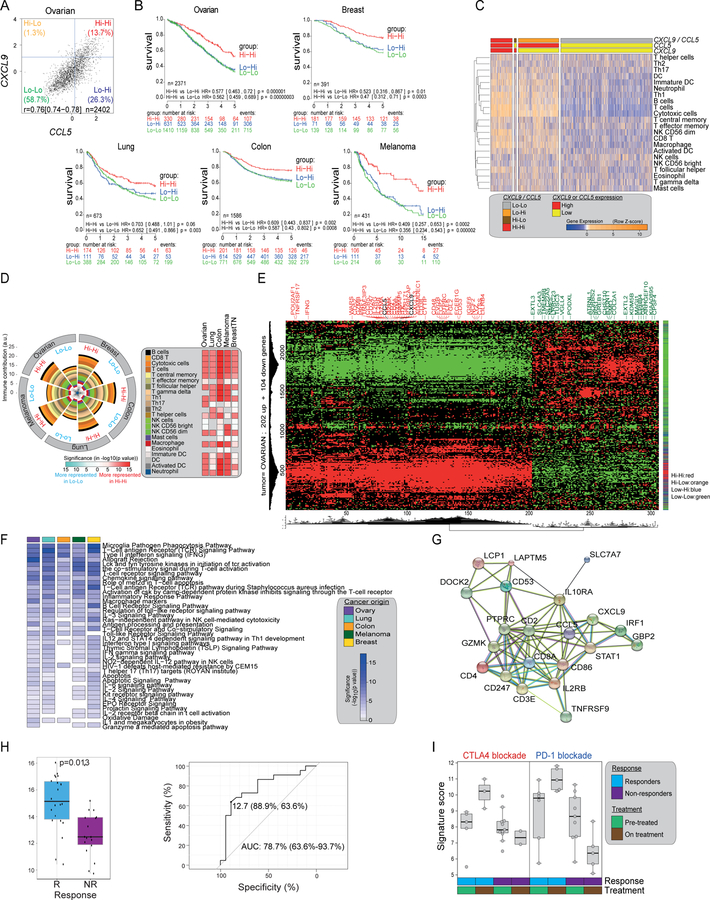
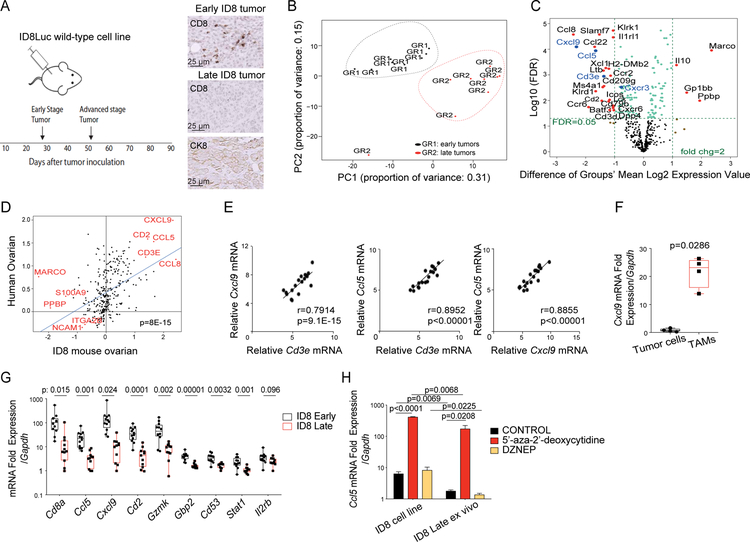
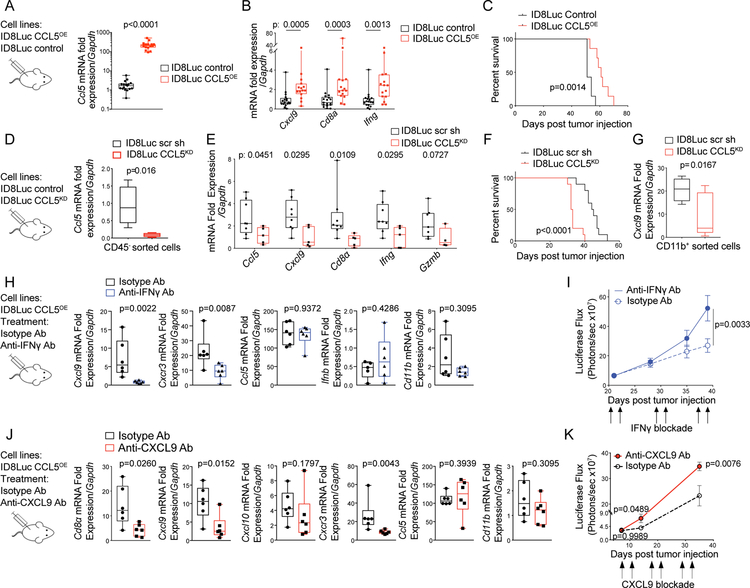
We investigated the role of chemokines in regulating T cell accumulation in solid tumors. CCL5 and CXCL9 overexpression was associated with CD8+ T cell infiltration in solid tumors. T cell infiltration required tumor cell-derived CCL5 and was amplified by IFN-γ-inducible, myeloid cell-secreted CXCL9. CCL5 and CXCL9 coexpression revealed immunoreactive tumors with prolonged survival and response to checkpoint blockade. Loss of CCL5 expression in human tumors was associated with epigenetic silencing through DNA methylation. Reduction of CCL5 expression caused tumor-infiltrating lymphocyte (TIL) desertification, whereas forced CCL5 expression prevented Cxcl9 expression and TILs loss, and attenuated tumor growth in mice through IFN-γ. The cooperation between tumor-derived CCL5 and IFN-γ-inducible CXCR3 ligands secreted by myeloid cells is key for orchestrating T cell infiltration in immunoreactive and immunoresponsive tumors.

Keywords: CCL5; CXCL10; CXCL9; IFN-γ; T cell trafficking in the tumor; TILs (tumor-infiltrating lymphocytes); checkpoint blockade; epigenetic silencing; immunoreactive tumors; inducible and constitutive chemokines.


Figures

Figure 1
Figure 1. Identification of chemokines correlating with CD8A in solid tumors.
(A) IHC examples of advanced ovarian tumors with low and high levels of CD8+ TILs (left) and Pearson correlation plot of CD8A mRNA and CD8+ TILs in EOC samples (n=19) (right). (B) Pearson correlation plot of expressions of CD8A and CD3D (n=125). (C) Correlation analyses of CD8A expression with that of CCL and CXCL chemokine genes in the ExpO microarray dataset. Estimate (square) in a subset of 6 tumor types was plotted with 95% confidence intervals (CI) (lines) truncated on the left (n=1383). (D-E) Forest plots and meta-analytical estimation of the correlation between expressions of CD8A with CCL5 (D) or with CXCL9 (E) for 13 tumor types (n=1752). Estimates (squares) are drawn in proportion to n with 95% CI (lines). Average correlation r (diamond) to CD8A: r=0.86 and r=0.76, for CCL5 and CXCL9 respectively. (F) Scatterplots showing the range of associations (r) with 95% CI and proportionality of expression levels for CD8A and CCL5 or CXCL9 in seven solid tumor types. All lower bounds being higher than zero indicate highly significant associations. See also Figures S1, S2.
Figure 2
Figure 2. CCL5 is intrinsically expressed by ovarian cancer cells and is associated with CD8+ T cells infiltration in tumors.
(A) Representative IHC images and summary of CCL5 protein expression and ieCD8+ TILs in the Helsinki EOC TMA and comparison of absolute number for CCL5+/− and CD8+/− categories (Fisher’s exact test p=2.2×10⁻¹⁶) (B) Quantification of ieCD8+ TILs in CCL5low and CCL5high tumors (UPenn cohort). P value was calculated with Mann-Whitney test. (C) CCL5 IHC staining in EOC. A tumor islet with cytoplasmic CCL5 is projected. (D) Multispectral immunofluorescence staining of CCL5 (upper) and CCL5+ (lower) EOC cases for CCL5 (red), keratin (grey), and CD8+ (green). (E) Representative FACS dot plot of FACS-sorted Epcam+CD45 ovarian cancer cells before (upper left) and after sorting (upper right) and relative quantification of CCL5 mRNA in FACS-sorted Epcam+CD45 EOC cells (lower bar graph). (F) FACS analysis of CCR5 expression in CD8+ and CD4+ T cells isolated from solid tumor, ascites and matched blood (PBL) of EOC patient. (G) FACS analysis of CCR5 in TILs or PBMCs from EOC patients. (H) Quantification of CCR5 expression in CD8+ and CD4+ T cells from PBMCs or TILs from EOC patients. P values were calculated with unpaired T test. (I) CCL5 methylation β values in CCL5high and CCL5low groups of five tumor types (TCGA datasets). Boxplots represent 25th and 75th percentiles with midline indicating the median; whiskers extend to maximally 1.5 interquartile (IQ) range beyond the box limits. Points indicate values for individual subjects beyond whiskers. (J) CCL5 expression in the indicated ovarian cancer cell lines 72 hr after 5’-aza-2’-deoxycytidine or DZNeP treatment. P values were calculated with unpaired T test. All bar-graph data are presented as mean ± SEM. See also Figure S3.
Figure 3
Figure 3. CXCL9 is expressed by tumor macrophages and dendritic cells and closely associates with ieCD8+ TILs.
(A) CXCL9 mRNA in ovarian tumors with or without ieCD8+ TILs (n=86). Data are represented as mean ± SEM. P value was calculated with unpaired T test. (B) Quantification of ieCD8+ TILs in tumor islets of EOC that are positive or negative for CXCL9 expression (n=86). Data are represented as mean ± SEM. P value was calculated with Mann-Whitney test. (C) Representative IHC of EOC with low or high CXCL9 in the tumor stroma and corresponding infiltration of CD8+ TILs in the same cases. S: stroma; T: tumor (D) Multispectral immunostaining of an EOC case for CXCL9 (green), CD11c (orange, DCs), and CD68 (red, macrophages). (E) Representative images of CXCL9 IHC (left) and multispectral immunostaining for CXCL9 (green) and CD68 (red) (right). (F) CXCL9 mRNA levels in sorted CD45+Epcam TILs and CD45Epcam+ ovarian cancer cells. Boxplots represent 25th and 75th percentiles with midline indicating the median; whiskers extend to the lowest/highest values. P value was calculated with Mann-Whitney test. (G) FACS histogram of CXCR3 in CD4+ and CD8+ T cells from matched tumor, ascites, and blood (PBL) of an EOC case. (H) FACS histogram CXCR3 surface expression in PBMCs and TILs from several EOC patients. See also Figure S3.
Figure 4
Figure 4. CXCL9 is only upregulated by IFNγ in TAMs and DCs whereas CXCL10 is upregulated by both type-I IFNs and IFNγ in tumor cells, TAMs and DCs
(A, B) Cytokine bead array (CBA) quantification of CXCL9 (A) and CXCL10 (B) in EOC-derived T cells, TAMs and tumor cells after 72 hr stimulation with IFNα, IFNβ or IFNγ. P values of IFNγ vs. untreated conditions are shown. (C) Pearson correlation plots of expressions of CD8A with IFNA1 (left), IFNB1 (center), or IFNG (right) in the TCGA ovarian cancer dataset. (D) Pearson correlation plots of expressions of IFNG with CXCL9 (left) and CXCL10 (right) in the TCGA ovarian cancer dataset. (E) Correlation coefficient heatmaps summarizing associations between expressions of IFNA1, IFNB1 and IFNG with those of CD8A, CXCL9, CXCL10 and CXCL11 for 6 solid tumor types in TCGA. All p values are shown is Table S1. (F) Illustration of Ovarian TME co-cultures (left) and CXCL9 secretion under no blockade (medium alone or isotype control Abs), single or combined Ab blockade (right). P values were calculated with corrected T tests comparing each condition to medium only (n=4). (G) Pearson correlation of relative IFNγ and CXCL9 secretion in four patients. (H, I) Secretion of IFNγ (H) and CXCL9 (I) in mixed autologous tumor co-cultures, in the presence of HLA-ABC blocking Ab or control IgG (n=10). (J) Illustration of chemotaxis assay of autologous blood T cells or TILs towards supernatants derived from mixed autologous tumor co-cultures (left) and quantification of TILs migration in tumor-conditioned medium in the presence of anti-CCR5 and anti-CXCR3 Abs (right). (K) Autologous blood T cells migration towards supernatants from 2D co-cultures, purified tumor cells (CD45) or purified tumor leukocytes (CD45+) in the presence of anti-CXCR3 Ab. (L) Illustration for the co-culture chemotaxis system using human tumor spheroids, monocytes and CD8+ T cells transduced with cognate TCR (left). Migration of TCR-transduced CD8+ T cells in the following tumor spheroids: OV79-NYESO1+ coexpressing or not CCL5 (NY/CCL5 and NY respectively) and enriched with CXCL9-producing monocytes (NY/CCL5/CXCL9), CCL5+ only expressing OV79 tumor cell spheroids (CCL5), or OV79 tumor spheroids coated with CXCL9+ monocytes (CXCL9) (right). (M) Spheroid infiltration by antigen-specific T cells in the presence of anti-CXCR3 Ab. NY: NY-ESO+ OV79 tumor cells, CCL5: CCL5+ OV79 tumor cells, CXCL9: CXCL9+ monocytes. (N) Spheroid infiltration by TCR-transduced or non-transduced CD8+ T cells infiltrating OV79-NYESO1+/CCL5/CXCL9 tumor spheroids. All bar-graph data are represented as mean ± SEM. All p values were calculated with multiple T tests unless specified otherwise. See also Figure S3 and Table S1.
Figure 5
Figure 5. Co-expression of CCL5 and CXCL9 reveals immunoreactive tumors that respond to PD1 blockade.
(A) Scatter plot of expressions of CXCL9 and CCL5 in 2402 serous EOC cases and definition of four subgroups. (B) Kaplan-Meier survival analysis according to chemokine subgroups (as defined in A) in five solid tumor types. Due to its low frequency, the CXCL9-CCL5 Hi-Lo group for each cancer type is omitted. (C) Heatmap showing scoring of immune gene signatures (Bindea et al., 2013) in EOC according to CCL5 and CXCL9 expression subgroups. (D) Summary pie chart displaying the immune subset gene signatures of Hi-Hi and Lo-Lo groups in five cancer types computed as in (C). Heatmap displaying the significance level of the differences in immune subsets between Hi-Hi and Lo-Lo tumors for each cancer type (ANOVA followed by Tukey test) and the directionality of the difference (red: over- representation in Hi-Hi, light blue over-representation in Lo-Lo). (E) Hierarchical biclustering and gene expression heatmap (red, high; green, low) with names of strongest genes discriminating the Hi-Hi group (FDR cutoff =1×10−38). (F) Enrichment analysis heatmap for gene sets in BioCarta and Wikipathways in the top 202 differentially expressed genes characteristic for the Hi-Hi groups in five different cancer types. Colors in the heatmap represent the level of significance of the enrichment (-log10 of the adjusted p values). (G) Protein-protein interaction network (STRING) for the chemokine-derived 21-gene shared signature consisting of the included genes. Average local clustering coefficient=0.727 and protein-protein interaction (PPI) enrichment p<2.2e-16. (H) 21-gene signature score for pre-treatment samples are shown for responders (R) and non-responders (NR) (left) and ROC plot for 21-gene signature score vs. response (right) from the Nivolumab-Ipilimumab sequential treatment arm in (Rodig et al., 2018). Statistical comparison is based on one-sided Wilcoxon rank sum tests. (I) Variation of the 21-gene signature score for on-treatment samples from Chen et al. (Chen et al., 2016) defined by the treatment received, the response status of the patient classified and the time point of the profiling. All boxplots represent 25th and 75th percentiles with midline indicating the median; whiskers extend to maximally 1.5 IQ range beyond the box limits. Points indicate values for individual subjects beyond whiskers. See also Figures S4, S5 and Tables S2–S4.
Figure 6
Figure 6. Epigenetic loss of Ccl5 drives tumor immune desertification in vivo and is associated with loss of Cxcl9 in TAMs
(A) Schema of the experiment (left) and IHC analysis of cytokeratin 8 (CK8) and ieCD8+ TILs in early and late stage mouse ID8 tumors (right). (B) Principal component analysis of gene expression in early and late ID8 tumors. (C) Volcano plots displaying names of the genes that were significantly (FDR=0.05) and ≥2-fold downregulated (left) or upregulated (right) in late versus early ID8 tumors. (D) Correlation of mouse ID8 tumor genes with human ovarian cancer orthologs. (E) Correlation plots of expressions of indicated genes. (F) Relative mRNA quantification of Cxcl9 in FACS sorted CD45 tumor cells and CD45+CD3 CD11b+ TAMs. P value was calculated with unpaired T test. (G) Relative mRNA quantification of the top genes of the human chemokine signature genes by qPCR in early and late ID8 tumors. P values were calculated with multiple T tests. (H) Relative mRNA quantification of Ccl5 in the ID8 cell line and in ID8 cells purified from late ID8 tumors 3 days post-treatment with 5’-aza-2’-deoxycytidine or DZNep. Data are represented as mean ± SEM. P values were calculated with unpaired T test. All boxplots represent 25th and 75th percentiles with midline indicating the median; whiskers extend to the lowest/highest values. See also Figure S6.
Figure 7
Figure 7. IFNγ and CXCL9 enhance T-cell engraftment in CCL5-expressing tumors in vivo
(A, B) Relative mRNA quantification of Ccl5 (A) and Cd8a, Ifng, and Cxcl9 (B) in ID8Luc CCL5OE tumors and ID8Luc control tumors. (C) Kaplan-Meier survival curves of mice injected with ID8Luc CCL5OE or ID8Luc control cells. P values were calculated with Log-rank (Mantel-Cox) test. (D) Relative mRNA quantification of Ccl5 in FACS sorted CD45 tumor cells derived from ID8Luc scr sh control tumors or ID8Luc CCL5KD tumors. (E) Relative mRNA quantification of indicated genes by qPCR in ID8Luc scr sh or ID8Luc CCL5KD tumors. (F) Kaplan-Meier curves showing survival of mice with intraperitoneal ID8Luc scr sh or ID8Luc CCL5KD tumors. (G) Relative mRNA quantification of Cxcl9 in FACS sorted CD45+CD3CD11b+ TAMs derived from ID8Luc scr sh or ID8Luc CCL5KD tumors. (H) Relative mRNA quantification of indicated genes by qPCR in ID8Luc CCL5OE and treated in vivo with an Ab neutralizing IFNγ or an isotype control Ab. (I) Intraperitoneal growth of ID8Luc CCL5OE cancers as detected by bioluminescence imaging during treatment with IFNγ neutralizing or isotype control Abs. Data presented as mean ± SEM. P values were calculated with Two-way Anova T tests. (J) Relative mRNA quantification of indicated genes by qPCR in ID8Luc CCL5OE tumors and treated in vivo with an Ab neutralizing CXCL9 or an isotype control Ab. (K) Intraperitoneal tumor growth kinetics of ID8Luc CCL5OE cancers as detected by bioluminescence imaging during treatment with CXCL9 neutralizing or isotype control Abs. Data presented as mean ± SEM. P values were calculated with Two-way Anova T tests. All boxplots represent 25th and 75th percentiles with midline indicating the median; whiskers extend to the lowest/highest values. Corresponding p values were calculated with Mann-Whitney tests. See also Figure S7.

References

    1. Angelova M, Mlecnik B, Vasaturo A, Bindea G, Fredriksen T, Lafontaine L, Buttard B, Morgand E, Bruni D, Jouret-Mourin A, et al. (2018). Evolution of Metastases in Space and Time under Immune Selection. Cell 175, 751–765 e716. - PubMed
    1. Bedognetti D, Spivey TL, Zhao Y, Uccellini L, Tomei S, Dudley ME, Ascierto ML, De Giorgi V, Liu Q, Delogu LG, et al. (2013). CXCR3/CCR5 pathways in metastatic melanoma patients treated with adoptive therapy and interleukin-2. Br J Cancer 109, 2412–2423. - PMC - PubMed
    1. Bindea G, Mlecnik B, Tosolini M, Kirilovsky A, Waldner M, Obenauf AC, Angell H, Fredriksen T, Lafontaine L, Berger A, et al. (2013). Spatiotemporal dynamics of intratumoral immune cells reveal the immune landscape in human cancer. Immunity 39, 782–795. - PubMed
    1. Buckanovich RJ, Facciabene A, Kim S, Benencia F, Sasaroli D, Balint K, Katsaros D, O’Brien-Jenkins A, Gimotty PA, and Coukos G (2008). Endothelin B receptor mediates the endothelial barrier to T cell homing to tumors and disables immune therapy. Nat Med 14, 28–36. - PubMed
    1. Burke SJ, Goff MR, Lu D, Proud D, Karlstad MD, and Collier JJ (2013). Synergistic expression of the CXCL10 gene in response to IL-1beta and IFN-gamma involves NF-kappaB, phosphorylation of STAT1 at Tyr701, and acetylation of histones H3 and H4. J Immunol 191, 323–336. - PubMed

Publication types

MeSH terms