. 2019 Jun 11;20(1):483.
doi: 10.1186/s12864-019-5882-z.

Genome-wide identification, phylogeny, evolutionary expansion and expression analyses of bZIP transcription factor family in tartaty buckwheat

Affiliations

Genome-wide identification, phylogeny, evolutionary expansion and expression analyses of bZIP transcription factor family in tartaty buckwheat

Moyang Liu et al. BMC Genomics. .

Abstract

Background: In reported plants, the bZIP family is one of the largest transcription factor families. bZIP genes play roles in the light signal, seed maturation, flower development, cell elongation, seed accumulation protein, abiotic and biological stress and other biological processes. While, no detailed identification and genome-wide analysis of bZIP family genes in Fagopyum talaricum (tartary buckwheat) has previously been published. The recently reported genome sequence of tartary buckwheat provides theoretical basis for us to study and discuss the characteristics and expression of bZIP genes in tartary buckwheat based on the whole genome.

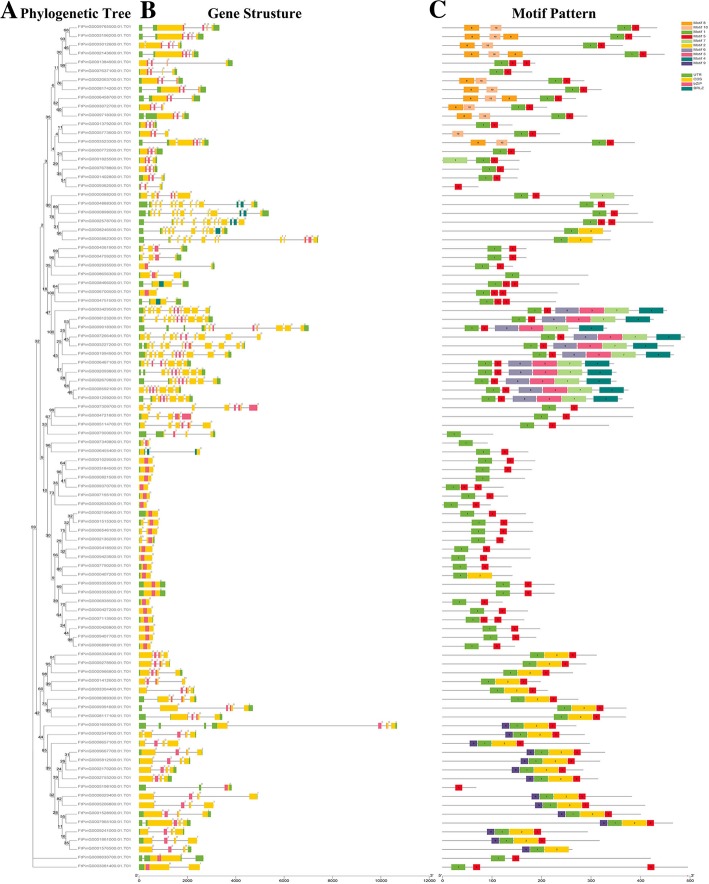
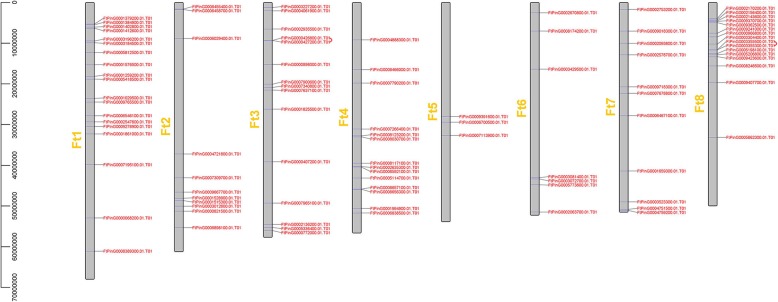
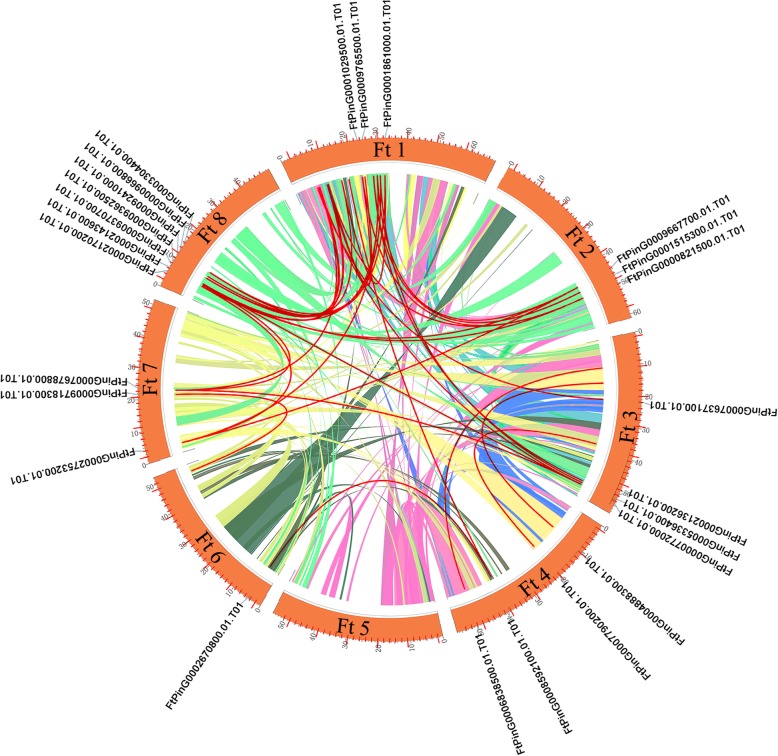
Results: In this study, 96 FtbZIP genes named from FtbZIP1 to FtbZIP96 were identified and divided into 11 subfamilies according to their genetic relationship with 70 bZIPs of A. thaliana. FtbZIP genes are not evenly distributed on the chromosomes, and we found tandem and segmental duplication events of FtbZIP genes on 8 tartary buckwheat chromosomes. According to the results of gene and motif composition, FtbZIP located in the same group contained analogous intron/exon organizations and motif composition. By qRT-PCR, we quantified the expression of FtbZIP members in stem, root, leaf, fruit, and flower and during fruit development. Exogenous ABA treatment increased the weight of tartary buckwheat fruit and changed the expressions of FtbZIP genes in group A.

Conclusions: Through our study, we identified 96 FtbZIP genes in tartary buckwheat and synthetically further analyzed the structure composition, evolution analysis and expression pattern of FtbZIP proteins. The expression pattern indicates that FtbZIP is important in the course of plant growth and development of tartary buckwheat. Through comprehensively analyzing fruit weight and FtbZIP genes expression after ABA treatment and endogenous ABA content of tartary buckwheat fruit, ABA may regulate downstream gene expression by regulating the expression of FtPinG0003523300.01 and FtPinG0003196200.01, thus indirectly affecting the fruit development of tartary buckwheat. This will help us to further study the function of FtbZIP genes in the tartary buckwheat growth and improve the fruit of tartary buckwheat.

Keywords: ABA; Development; Expression patter; Fruit; FtbZIP; Tartary buckwheat.


Conflict of interest statement

The authors declare that they have no competing interests.

Figures

Fig. 1
Fig. 1
Unrooted phylogenetic tree representing the relationships among 96 FtbZIP genes from tartary buckwheat and 70 AtbZIP genes from A. thaliana. 96 FtbZIP genes and 70 AtbZIP genes are classified into group a, b, c, d, e, f, g, h, i, j and k. Group H represents the FtbZIP genes that cannot be classified. The bZIP genes from tartary buckwheat and A. thaliana are marked in red and black, respectively. Percentages beside all branches are bootstrap support values generated from 1000 replicates
Fig. 2
Fig. 2
Phylogenetic relationships, gene structures and compositions of the conserved protein motifs of the FtbZIP genes from tartary buckwheat. a The phylogenetic tree was constructed based on the full-length sequences of tartary buckwheat bZIP proteins. b Exon-intron structures of the tartary buckwheat bZIP genes. Green boxes indicate untranslated 5′- and 3′-regions; yellow boxes indicate exons; and black lines indicate introns. The bZIP domain is highlighted by a pink box. The number indicates the phases of the corresponding introns. c The motif compositions of the tartary buckwheat bZIP proteins. The motifs, numbered 1–10, are displayed in different colored boxes. The sequence information for each motif is provided in Additional file 2: Table S2. The protein length can be estimated using the scale at the bottom
Fig. 3
Fig. 3
Schematic representations of the chromosomal distribution of the tartary buckwheat bZIP genes. The chromosome number is indicated to the left of each chromosome
Fig. 4
Fig. 4
Schematic representations of the interchromosomal relationships of the tartary buckwheat bZIP genes. Colored lines indicate all syntenic blocks in the tartary buckwheat genome
Fig. 5
Fig. 5
Synteny analyses between the bZIP genes of tartary buckwheat and those of seven representative plant species
Fig. 6
Fig. 6
Phylogenetic relationships and motif compositions of the bZIP proteins from six different plant species (tartary buckwheat, A. thaliana, beet, tomato, grape and sunflower). The phylogenetic tree includes 96 bZIP genes from tartary buckwheat, 70 from A. thaliana, 48 from beet, 70 from tomato, 47 from grape and 23 from sunflower. bZIP genes from multiple species are classified into group a, b, c, d, e, f, g, h, i and j. The bZIP genes from tartary buckwheat and other plant species are marked in red and black, respectively. Percentages beside all branches are bootstrap support values generated from 1000 replicates. The motifs, numbered 1–10, are displayed in different colored boxes. The sequence information for each motif is provided in Additional file 2: Table S2
Fig. 7
Fig. 7
Tissue-specific gene expression of 20 tartary buckwheat bZIP genes and the correlations between the gene expression patterns of FtbZIPs. a The expression patterns of 20 tartary buckwheat bZIP genes in stem (S), root (R), leaf (L), fruit (FR) and flower (FL) tissues were examined by qPCR. The error bars were obtained from three measurements. Lowercase letter(s) above the bars indicate significant differences (α = 0.05, LSD) among the treatments. b A positive number indicates a positive correlation; a negative number indicates a negative correlation. The red numbers indicate a significant correlation at the 0.05 level
Fig. 8
Fig. 8
Gene expression levels of 19 tartary buckwheat bZIP genes during fruit development and the correlations of the FtbZIP gene expression patterns during fruit development. a The expression patterns of 19 tartary buckwheat bZIP genes in the fruit development stage were examined using a qPCR assay. The error bars were obtained from three measurements. Lowercase letter(s) above the bars indicate significant differences (α = 0.05, LSD) among the treatments. b A positive number indicates a positive correlation; a negative number indicates a negative correlation. Red numbers indicate a significant correlation at the 0.05 level
Fig. 9
Fig. 9
Endogenous ABA content in tartary buckwheat fruits and changes in fruits weight and gene expression after exogenous ABA treatment. Endogenous ABA content throughout fruit development. b Weight of the fruits treated with different concentrations of exogenous ABA. X-axis: concentration of ABA treatment, y-axis: weight of mature fruit. Error bars were obtained from five measurements. c Expression of FtbZIP genes from group a at 25 DAP treated with 4 mg L− 1 exogenous ABA. Mock: the same amount of water treatment. Small letter(s) above the bars indicate significant differences (α = 0.05, LSD) among the treatments * and ** indicate significant correlations at the 0.05 and 0.01 levels, respectively

Similar articles

Cited by

References

    1. Riechmann JL, Ratcliffe OJ. A genomic perspective on plant transcription factors. Curr Opin Plant Biol. 2000;3(5):423–434. doi: 10.1016/S1369-5266(00)00107-2. - DOI - PubMed
    1. Warren AJ. Eukaryotic transcription factors. Curr Opin Struct Biol. 2002;12(1):107–114. doi: 10.1016/S0959-440X(02)00296-8. - DOI - PubMed
    1. Jinpu J, He Z, Lei K, Ge G, Jingchu L. PlantTFDB 3.0: a portal for the functional and evolutionary study of plant transcription factors. Nucleic Acids Res. 2014;42(Database issue):1182–1187. - PMC - PubMed
    1. Aashima N, Mukesh J, Tyagi AK, Khurana JP. Genomic survey and gene expression analysis of the basic leucine zipper transcription factor family in rice. Plant Physiol. 2008;146(2):333–350. - PMC - PubMed
    1. Landschulz WH, Johnson PF, Mcknight SL. The leucine zipper: a hypothetical structure common to a new class of DNA binding proteins. Science. 1988;240(4860):1759–1764. doi: 10.1126/science.3289117. - DOI - PubMed

Substances

LinkOut - more resources