

The initiation of puberty in Atlantic salmon brings about large changes in testicular gene expression that are modulated by the energy status
- PMID: 31185904
- PMCID: PMC6558769
- DOI: 10.1186/s12864-019-5869-9
The initiation of puberty in Atlantic salmon brings about large changes in testicular gene expression that are modulated by the energy status
Abstract
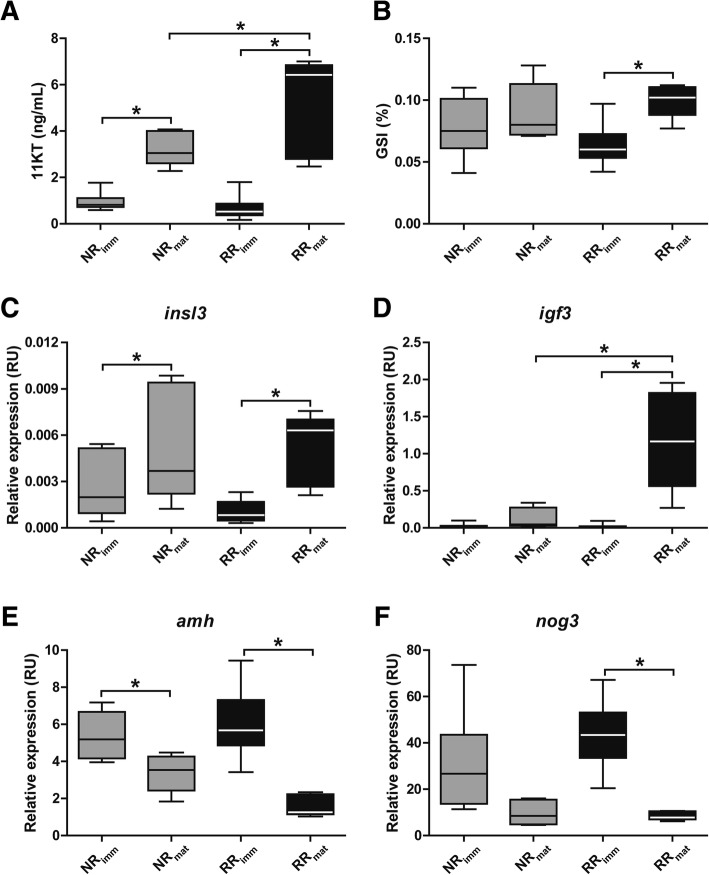
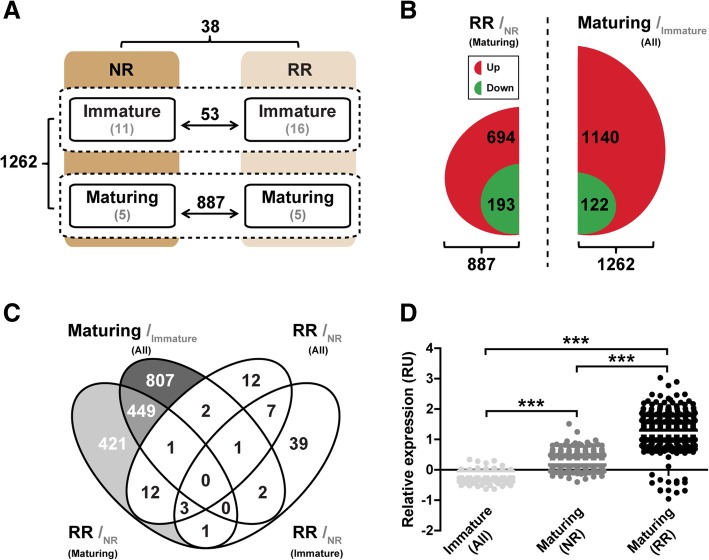
Background: When puberty starts before males reach harvest size, animal welfare and sustainability issues occur in Atlantic salmon (Salmo salar) aquaculture. Hallmarks of male puberty are an increased proliferation activity in the testis and elevated androgen production. Examining transcriptional changes in salmon testis during the transition from immature to maturing testes may help understanding the regulation of puberty, potentially leading to procedures to modulate its start. Since differences in body weight influence, via unknown mechanisms, the chances for entering puberty, we used two feed rations to create body weight differences.
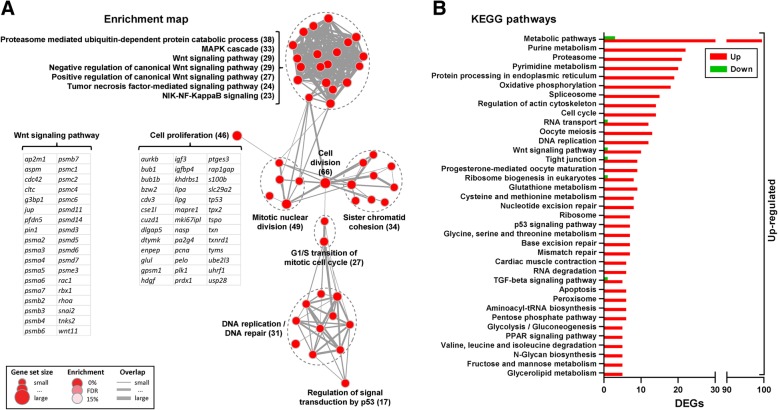
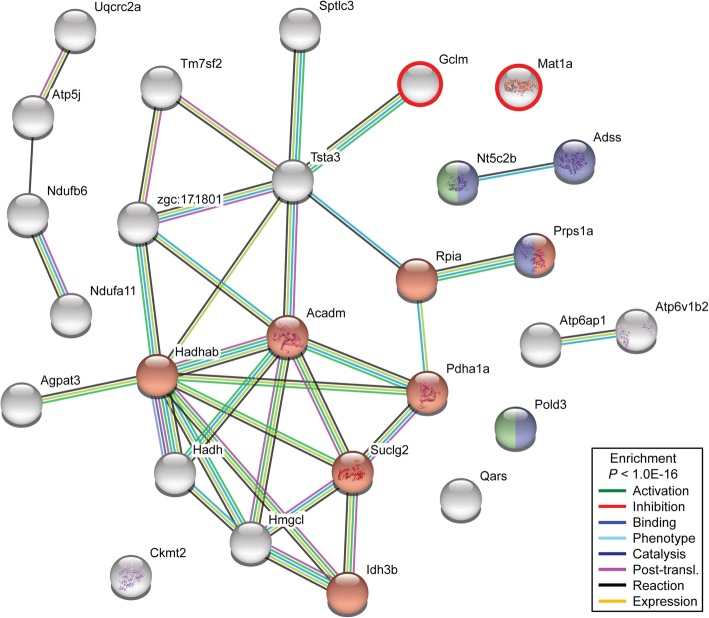
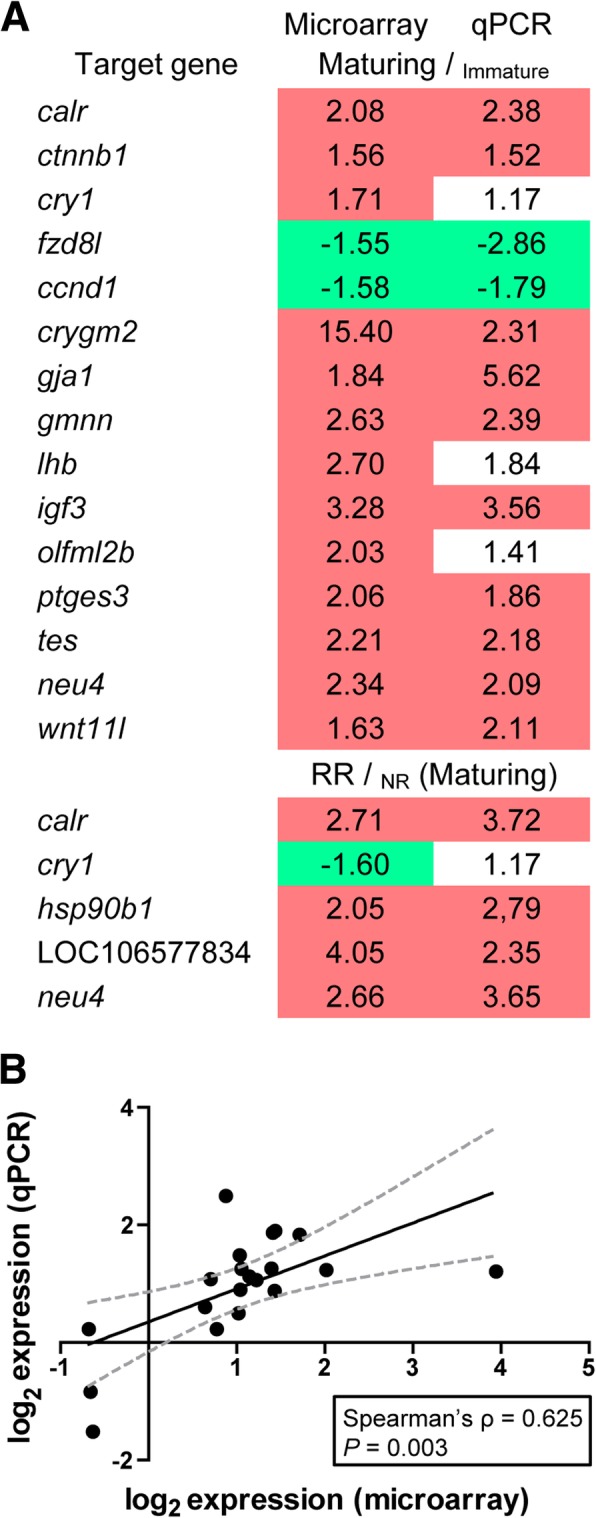
Results: Maturing testes were characterized by an elevated proliferation activity of Sertoli cells and of single undifferentiated spermatogonia. Pituitary gene expression data suggest increased Gnrh receptor and gonadotropin gene expression, potentially responsible for the elevated circulating androgen levels in maturing fish. Transcriptional changes in maturing testes included a broad variety of signaling systems (e.g. Tgfβ, Wnt, insulin/Igf, nuclear receptors), but also, activation of metabolic pathways such as anaerobic metabolism and protection against ROS. Feed restriction lowered the incidence of puberty. In males maturing despite feed restriction, plasma androgen levels were higher than in maturing fish receiving the full ration. A group of 449 genes that were up-regulated in maturing fully fed fish, was up-regulated more prominently in testis from fish maturing under caloric restriction. Moreover, 421 genes were specifically up-regulated in testes from fish maturing under caloric restriction, including carbon metabolism genes, a pathway relevant for nucleotide biosynthesis and for placing epigenetic marks.
Conclusions: Undifferentiated spermatogonia and Sertoli cell populations increased at the beginning of puberty, which was associated with the up-regulation of metabolic pathways (e.g. anaerobic and ROS pathways) known from other stem cell systems. The higher androgen levels in males maturing under caloric restriction may be responsible for the stronger up-regulation of a common set of (449) maturation-associated genes, and the specific up-regulation of another set of (421) genes. The latter opened regulatory and/or metabolic options for initiating puberty despite feed restriction. As a means to reduce the incidence of male puberty in salmon, however, caloric restriction seems unsuitable.
Keywords: Androgens; Nutrition; Puberty; Spermatogenesis; Testis; Transcriptomics.
Conflict of interest statement
The authors declare that they have no competing interests.
Figures
Similar articles
-
Pituitary Gonadotropin Gene Expression During Induced Onset of Postsmolt Maturation in Male Atlantic Salmon: In Vivo and Tissue Culture Studies.Front Endocrinol (Lausanne). 2022 Mar 15;13:826920. doi: 10.3389/fendo.2022.826920. eCollection 2022. Front Endocrinol (Lausanne). 2022. PMID: 35370944 Free PMC article.
-
Entry into puberty is reflected in changes in hormone production but not in testicular receptor expression in Atlantic salmon (Salmo salar).Reprod Biol Endocrinol. 2019 Jun 21;17(1):48. doi: 10.1186/s12958-019-0493-8. Reprod Biol Endocrinol. 2019. PMID: 31226998 Free PMC article.
-
Regulation of the seasonal leptin and leptin receptor expression profile during early sexual maturation and feed restriction in male Atlantic salmon, Salmo salar L., parr.Gen Comp Endocrinol. 2014 Aug 1;204:60-70. doi: 10.1016/j.ygcen.2014.04.033. Epub 2014 May 10. Gen Comp Endocrinol. 2014. PMID: 24818969
-
Leptin in fish: possible role in sexual maturation in male Atlantic salmon.Fish Physiol Biochem. 2013 Feb;39(1):103-6. doi: 10.1007/s10695-012-9731-0. Epub 2012 Oct 7. Fish Physiol Biochem. 2013. PMID: 23053613 Review.
-
Transcriptomic responses to functional feeds in Atlantic salmon (Salmo salar).Fish Shellfish Immunol. 2011 Nov;31(5):704-15. doi: 10.1016/j.fsi.2011.02.023. Epub 2011 Mar 4. Fish Shellfish Immunol. 2011. PMID: 21377530 Review.
Cited by
-
Fish reproductive biology - Reflecting on five decades of fundamental and translational research.Gen Comp Endocrinol. 2021 Jan 1;300:113544. doi: 10.1016/j.ygcen.2020.113544. Epub 2020 Jun 30. Gen Comp Endocrinol. 2021. PMID: 32615136 Free PMC article. Review.
-
Loss of stra8 Increases Germ Cell Apoptosis but Is Still Compatible With Sperm Production in Atlantic Salmon (Salmo salar).Front Cell Dev Biol. 2021 Apr 16;9:657192. doi: 10.3389/fcell.2021.657192. eCollection 2021. Front Cell Dev Biol. 2021. PMID: 33942021 Free PMC article.
-
Hippo-vgll3 signaling may contribute to sex differences in Atlantic salmon maturation age via contrasting adipose dynamics.Biol Sex Differ. 2025 Apr 2;16(1):23. doi: 10.1186/s13293-025-00705-8. Biol Sex Differ. 2025. PMID: 40176157 Free PMC article.
-
Pituitary Gonadotropin Gene Expression During Induced Onset of Postsmolt Maturation in Male Atlantic Salmon: In Vivo and Tissue Culture Studies.Front Endocrinol (Lausanne). 2022 Mar 15;13:826920. doi: 10.3389/fendo.2022.826920. eCollection 2022. Front Endocrinol (Lausanne). 2022. PMID: 35370944 Free PMC article.
-
Endocrine and Transcriptome Changes Associated with Testicular Growth and Differentiation in Atlantic Salmon (Salmo salar L.).Curr Issues Mol Biol. 2024 May 27;46(6):5337-5351. doi: 10.3390/cimb46060319. Curr Issues Mol Biol. 2024. PMID: 38920991 Free PMC article.
References
MeSH terms
Grants and funding
LinkOut - more resources
Full Text Sources
Molecular Biology Databases
Research Materials
