. 2019 Jun 11;11(1):89.
doi: 10.1186/s13148-019-0679-0.

DNA methylation profiling allows for characterization of atrial and ventricular cardiac tissues and hiPSC-CMs

Affiliations

DNA methylation profiling allows for characterization of atrial and ventricular cardiac tissues and hiPSC-CMs

Kirstin Hoff et al. Clin Epigenetics. .

Abstract

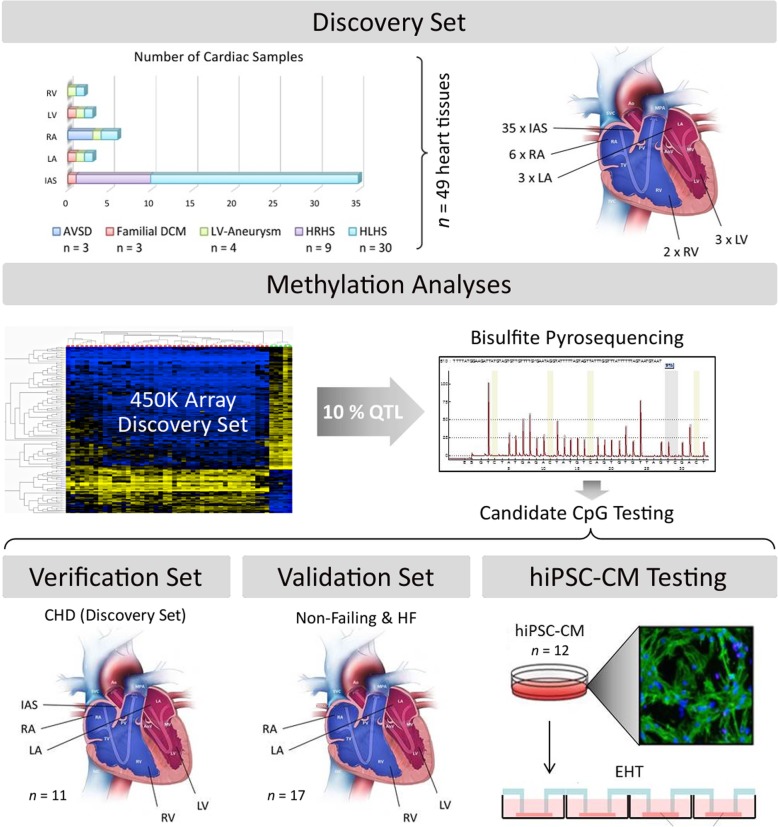
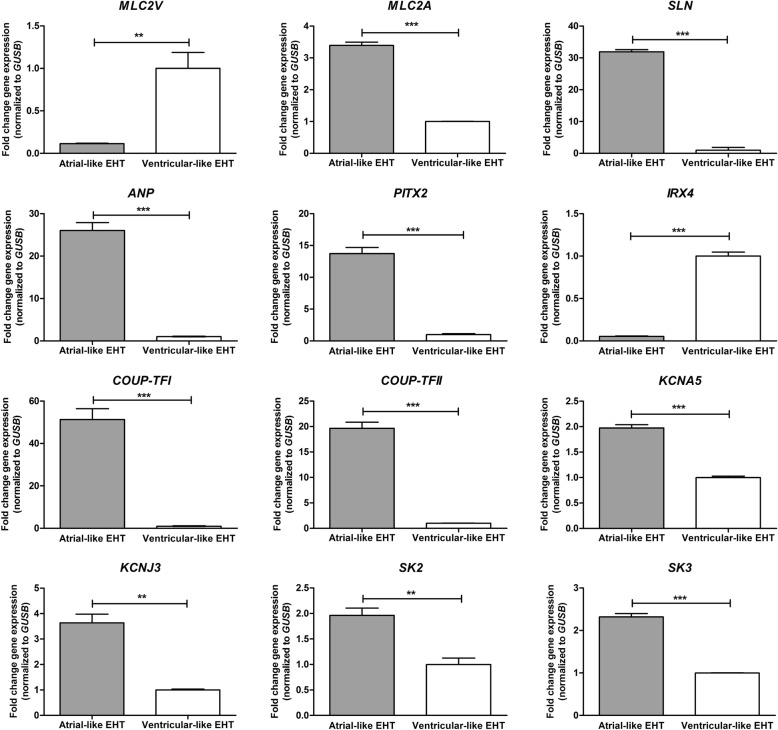
Background: Cardiac disease modelling using human-induced pluripotent stem cell-derived cardiomyocytes (hiPSC-CM) requires thorough insight into cardiac cell type differentiation processes. However, current methods to discriminate different cardiac cell types are mostly time-consuming, are costly and often provide imprecise phenotypic evaluation. DNA methylation plays a critical role during early heart development and cardiac cellular specification. We therefore investigated the DNA methylation pattern in different cardiac tissues to identify CpG loci for further cardiac cell type characterization.

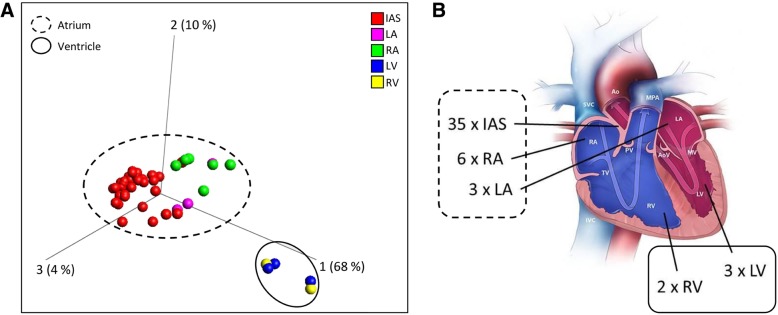
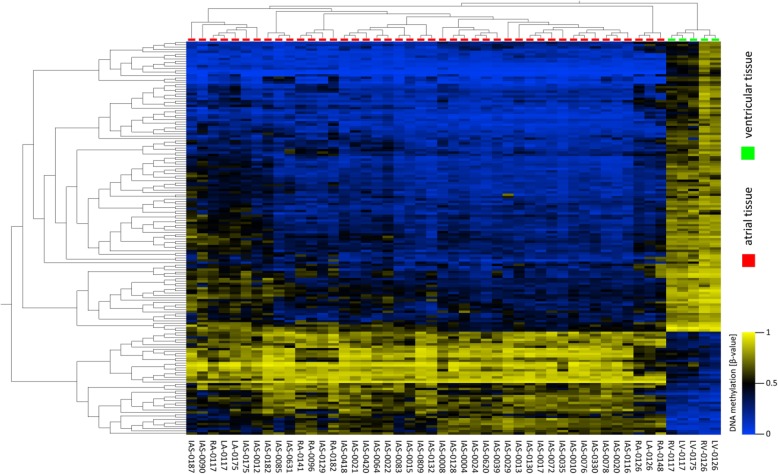
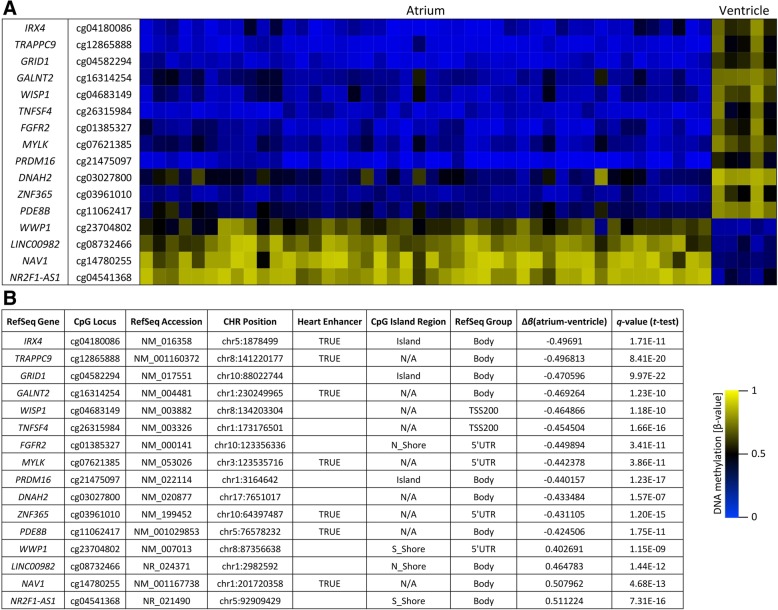
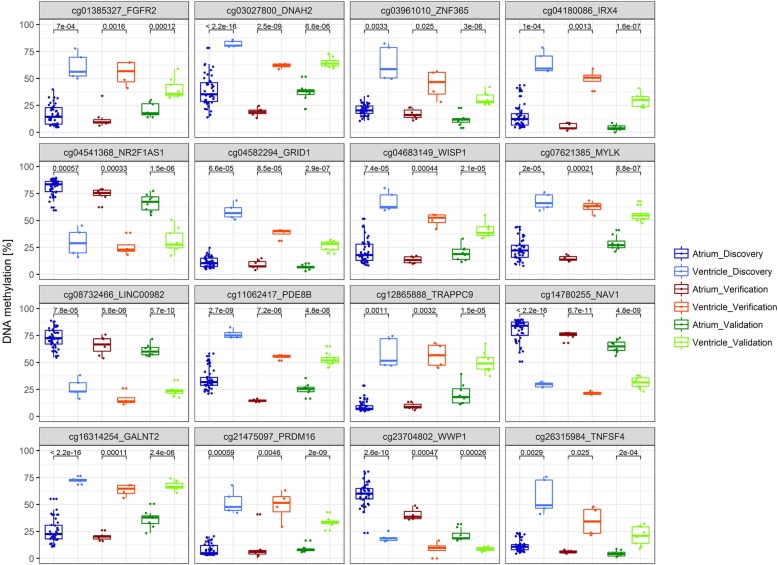
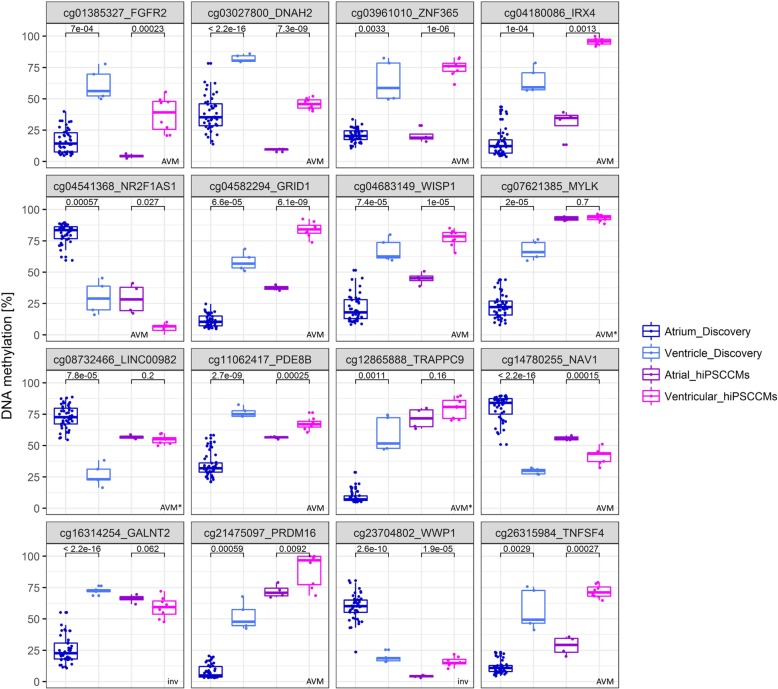
Results: An array-based genome-wide DNA methylation analysis using Illumina Infinium HumanMethylation450 BeadChips led to the identification of 168 differentially methylated CpG loci in atrial and ventricular human heart tissue samples (n = 49) from different patients with congenital heart defects (CHD). Systematic evaluation of atrial-ventricular DNA methylation pattern in cardiac tissues in an independent sample cohort of non-failing donor hearts and cardiac patients using bisulfite pyrosequencing helped us to define a subset of 16 differentially methylated CpG loci enabling precise characterization of human atrial and ventricular cardiac tissue samples. This defined set of reproducible cardiac tissue-specific DNA methylation sites allowed us to consistently detect the cellular identity of hiPSC-CM subtypes.

Conclusion: Testing DNA methylation of only a small set of defined CpG sites thus makes it possible to distinguish atrial and ventricular cardiac tissues and cardiac atrial and ventricular subtypes of hiPSC-CMs. This method represents a rapid and reliable system for phenotypic characterization of in vitro-generated cardiomyocytes and opens new opportunities for cardiovascular research and patient-specific therapy.

Keywords: 450K array; Bisulfite pyrosequencing; Cardiac tissue-specific DNA methylation; DNA methylation; Engineered heart tissue (EHT); Human induced pluripotent stem cell derived cardiomyocytes (hiPSC-CM).


Conflict of interest statement

The authors declare that they have no competing interests.

Figures

Fig. 1
Fig. 1
Study design. A discovery set comprising 49 human cardiac tissue samples from paediatric patients with different congenital heart diseases (CHD) was subjected to DNA methylation analysis using Illumina Infinium HumanMethylation450 BeadChips (‘450K arrays’). Having identified significant differential methylation patterns in atrial (left and right atrium (LA, RA), interatrial septum (IAS)) and ventricular (left and right ventricle (LV, RV)) tissues, the 10% quantile of CpG loci with greatest delta β-values among the differentially methylated CpG loci (16 loci) was selected to further evaluate their reproducibility using bisulfite pyrosequencing. As verification set, 11 heart tissue samples from the initial analysis were subjected to bisulfite pyrosequencing, followed by the analysis of 13 non-failing heart tissue samples from non-transplantable donor hearts as well as 4 heart tissue samples from adult patients with heart failure (HF) (validation set n = 17). To further distinguish the cellular identity of in vitro-generated human-induced pluripotent stem cell-derived cardiomyocytes (hiPSC-CMs), batches of atrial and ventricular hiPSC-CMs (n = 12) from 2D monolayers and 3D-engineered heart tissues (EHT) were subjected to bisulfite pyrosequencing. For detailed sample information, see Additional file 14: Table S1. Credits: images partly adapted from Centers for Disease Control and Prevention, National Center on Birth Defects and Developmental Disabilities [29] and Mannhardt et al., 2016 [26]
Fig. 2
Fig. 2
Principal component analysis of β-values at differentially methylated CpG loci from 49 cardiac tissue samples. a Principal component analysis based on β-values of differentially methylated 271 CpG loci (q ≤ 1 × 10−6 (σ/σmax > 0.4), ANOVA) of 49 different cardiac tissue samples (IAS, LA, RA, LV, RV) that were subjected to 450K array analysis. Subgroups of atrial and ventricular samples are marked as dashed and solid edging, respectively b. IAS: red spheres, LA: pink spheres, RA: green spheres, LV: blue spheres, RV: yellow spheres. Credits: Centers for Disease Control and Prevention, National Center on Birth Defects and Developmental Disabilities [29]
Fig. 3
Fig. 3
Hierarchical clustering (t test) of differentially methylated CpG loci in 49 cardiac tissue samples. One hundred and sixty-eight differentially methylated CpG loci (q ≤ 1 × 10−6 (σ/σmax > 0.4) t test) between 44 atrial (columns marked in red) and 5 ventricular heart tissue samples (columns marked in green) are depicted as hierarchical clustering analysis. Each column represents one sample (sample names and tissue types below), in case of sample 0126 and 0117 biological replicates are presented as mean values (for detailed information, see Additional file 14: Table S1). Each horizontal line represents the methylation levels of a given CpG loci across samples. Methylation levels are expressed as β-values from 0 to 1 (blue and yellow, unmethylated and completely methylated, respectively). All CpG loci show a difference of at least Δβ ≥ 0.3 (up to Δβ = 0.6) in their DNA methylation values between atrial and ventricular samples. No normalization was applied to colour code of the heat map, real β-values are shown
Fig. 4
Fig. 4
Candidate CpG loci with differential atrial-ventricular methylation pattern. Identified CpG loci (16 loci) and associated genes with greatest DNA methylation value differences (Δβ-value) between atrial and ventricular samples based on the t test (q ≤ 1 × 10−6, σ/σmax > 0.4) comparing 450K array data of 44 atrial and 5 ventricular heart tissue samples (a). All CpG loci show a difference of at least Δβ ≥ 0.4 in their DNA methylation values (see column ‘Δβ(atrium-ventricle)’) between atrial and ventricular samples (b). Additional information regarding chromosomal position (CHR), CpG island regions (N_Shore, 0–2 kb upstream (5′); S_Shore, 0–2 kb downstream (3′) of island) and RefSeq Group gene position annotation (TSS200, 0–200 bases upstream of the transcriptional start site; body, intragenic localization of the CpG site) are given according to Illumina’s 450K array classifications and UCSC classifications [37]. Heart enhancer, overlap of CpG locus with predicted human heart enhancers identified by a study of Dickel et al. [35] are marked as ‘true’ (for details, see Additional file 15: Table S2). These 16 CpG loci were selected as candidate CpG loci to test further sample cohorts using bisulfite pyrosequencing
Fig. 5
Fig. 5
Bisulfite pyrosequencing analysis of verification and validation set. Bisulfite pyrosequencing of 16 candidate CpG loci in atrial and ventricular cardiac tissue samples (detailed sample information, see Additional file 14: Table S1). The DNA methylation values (percentage) of three analysis sets are depicted: (1) initial discovery set (450K array analysis of atrial (n = 44, coloured dark blue) and ventricular (n = 5, coloured light blue) cardiac tissues from patients with CHDs), (2) verification set (atrial samples (n = 7, coloured dark red) and ventricular samples (n = 4, coloured orange) from the initially analysed sample cohort of the discovery set) and (3) validation set (four heart tissue samples (1x LA and 3x RA tissue) from adult patients with heart failure and 13 non-failing heart tissue samples (n = 4 atrial and n = 9 ventricular samples; coloured dark green and light green, respectively). All 16 candidate CpG loci show significant (p < 0.05) DNA methylation differences in atrial compared to ventricular cardiac tissue samples. Data is presented as standard box-and-whiskers plots (whiskers, 5th—95th percentile)
Fig. 6
Fig. 6
mRNA expression of selected genes in atrial-like and ventricular-like hiPSC-CM EHTs. qPCR experiments were performed on atrial and ventricular-like hiPSC-CMs from three independent hiPSC-CM EHT generations, each as duplicates (n = 6). Expression data was normalized to GUSB housekeeping gene and compared to atrial or ventricular-like hiPSC-CM EHT expression (∆∆ CT method), p < 0.05 (Student’s t test), bars show mean ± SEM
Fig. 7
Fig. 7
Bisulfite pyrosequencing analysis of candidate CpG loci in hiPSC-CMs: test of AVM pattern. The methylation values (percentage) of the initial discovery set (450K array analysis of atrial (n = 44, coloured dark blue) and ventricular (n = 5, coloured light blue) cardiac tissues from patients with CHDs) and in vitro-cultivated atrial and ventricular subtypes of hiPSC-CM 2D monolayers and 3D-engineered heart tissues (bisulfite pyrosequencing analysis, n = 4 atrial-like and n = 8 ventricular-like hiPSC-CMs; coloured dark violet and magenta, respectively) are depicted. CpG loci with significant (p < 0.05) differences in atrial and ventricular-like hiPSC-CMs showing similar AVM pattern as compared to the pattern in primary human atrial and ventricular cardiac tissues (discovery set) are marked with ‘AVM’. ‘Tendency loci’ with similar AVM pattern, that did not reach significance, are marked with ‘AVM*’ and loci showing opposite AVM pattern are marked with ‘inv’. Data is presented as standard box-and-whiskers plots (whiskers, 5th—95th percentile)

Similar articles

Cited by

References

    1. Guo H, Zhu P, Yan L, et al. The DNA methylation landscape of human early embryos. Nature. 2014;511:606. doi: 10.1038/nature13544. - DOI - PubMed
    1. Smith ZD, Meissner A. DNA methylation: roles in mammalian development. Nat Rev Genet. 2013;14:204–220. doi: 10.1038/nrg3354. - DOI - PubMed
    1. Jones PA. Functions of DNA methylation: islands, start sites, gene bodies and beyond. Nat Rev Genet. 2012;13:484–492. doi: 10.1038/nrg3230. - DOI - PubMed
    1. Boyes J, Bird A. DNA methylation inhibits transcription indirectly via a methyl-CpG binding protein. Cell. 1991;64:1123–1134. doi: 10.1016/0092-8674(91)90267-3. - DOI - PubMed
    1. Kitamura E, Igarashi J, Morohashi A, et al. Analysis of tissue-specific differentially methylated regions (TDMs) in humans. Genomics. 2007;89:326–337. doi: 10.1016/j.ygeno.2006.11.006. - DOI - PMC - PubMed

Publication types

MeSH terms