. 2019 Jun 11;7(1):86.
doi: 10.1186/s40478-019-0740-4.

In vivo real-time dynamics of ATP and ROS production in axonal mitochondria show decoupling in mouse models of peripheral neuropathies

Affiliations

In vivo real-time dynamics of ATP and ROS production in axonal mitochondria show decoupling in mouse models of peripheral neuropathies

Gerben van Hameren et al. Acta Neuropathol Commun. .

Erratum in

Abstract

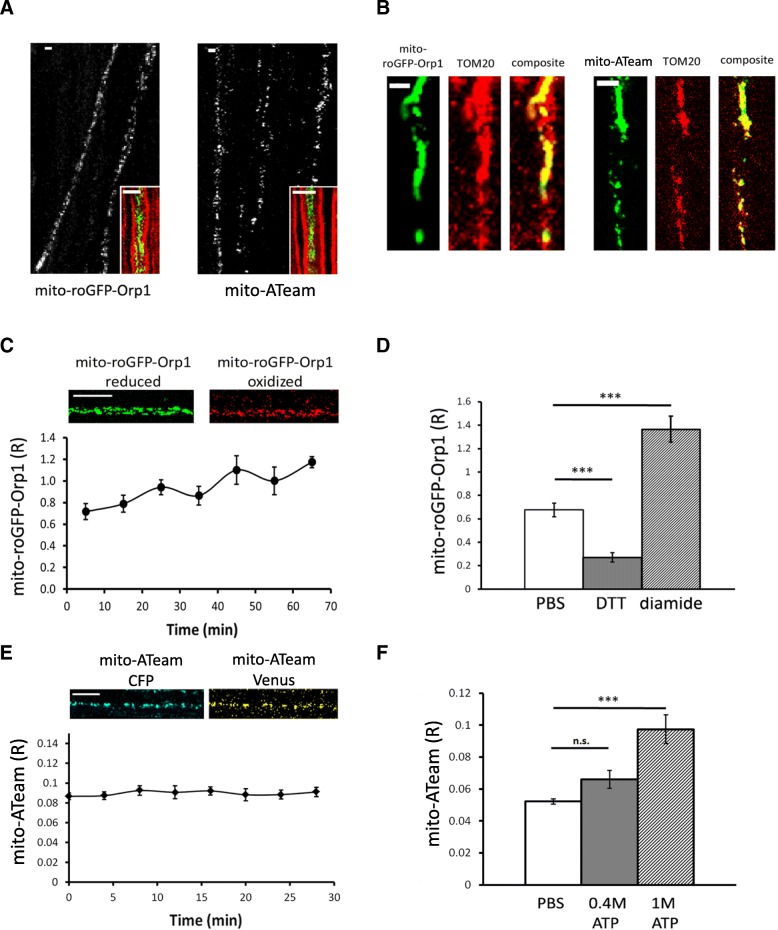
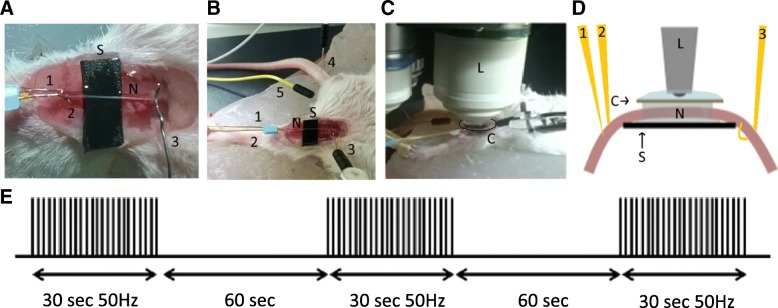
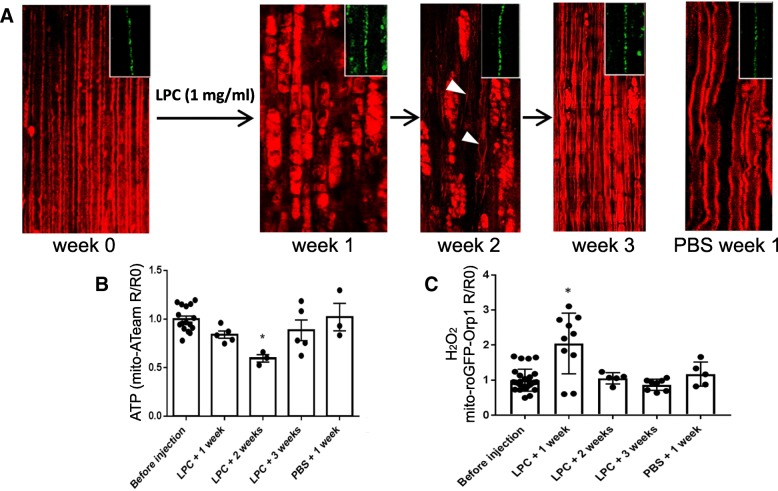
Mitochondria are critical for the function and maintenance of myelinated axons notably through Adenosine triphosphate (ATP) production. A direct by-product of this ATP production is reactive oxygen species (ROS), which are highly deleterious for neurons. While ATP shortage and ROS levels increase are involved in several neurodegenerative diseases, it is still unclear whether the real-time dynamics of both ATP and ROS production in axonal mitochondria are altered by axonal or demyelinating neuropathies. To answer this question, we imaged and quantified mitochondrial ATP and hydrogen peroxide (H2O2) in resting or stimulated peripheral nerve myelinated axons in vivo, using genetically-encoded fluorescent probes, two-photon time-lapse and CARS imaging. We found that ATP and H2O2 productions are intrinsically higher in nodes of Ranvier even in resting conditions. Axonal firing increased both ATP and H2O2 productions but with different dynamics: ROS production peaked shortly and transiently after the stimulation while ATP production increased gradually for a longer period of time. In neuropathic MFN2R94Q mice, mimicking Charcot-Marie-Tooth 2A disease, defective mitochondria failed to upregulate ATP production following axonal activity. However, elevated H2O2 production was largely sustained. Finally, inducing demyelination with lysophosphatidylcholine resulted in a reduced level of ATP while H2O2 level soared. Taken together, our results suggest that ATP and ROS productions are decoupled under neuropathic conditions, which may compromise axonal function and integrity.

Keywords: Axonal activity; Demyelination; MFN2; Mitochondria; ROS.


Conflict of interest statement

The authors declare that they have no competing interests.

Figures

Fig. 1
Fig. 1
In vivo validation of the fluorescent probes. a Several axons expressing mito-roGFP-Orp1 or mito-ATeam probe can be observed in teased fibers of mouse sciatic nerve 1 month after the virus injection. CARS imaging (inserts) shows that axons expressing mito-roGFP-Orp1 or mito-ATeam (green) are surrounded by a myelin sheath (red). Scale bars = 3 μm. b Mito-roGFP-Orp1 expression (green) partially colocalizes with mitochondrial marker TOM20 (red) in the axon. Similarly, mito-ATeam partially colocalizes with TOM20 in axonal mitochondria. This partial colocalization is due to the heterogenous distribution of TOM20 in outer mitochondrial membrane [74]. Scale bars = 3 μm. c A fluorescent signal of mito-roGFP-Orp1 is detected when the probe is reduced and when it is oxidized by H2O2. The ratio of mito-roGFP-Orp1 fluorescence measured in vivo (n = 6 axons; 6 mice) shows a slight increase over time. Scale bar = 10 μm d Mito-roGFP-Orp1 fluorescence ratio decreases with DTT (p = 0.006; n = 3 axons, 3 mice) and increases after injection of diamide into the nerve (p = 0.003; n = 4 axons, 4 mice). e A fluorescent signal of the CFP subunit and Venus subunit of mito-ATeam is detected. Mito-ATeam fluorescence ratio measured in vivo shows no significant change over time (n = 18 axons; 3 mice). Scale bar = 10 μm. f Mito-ATeam fluorescence ratio increases after injection of 0.4 M (p = 0.06; n = 3 axons, 3 mice) and 1 M (p = 7.5E-4; n = 6 axons, 4 mice) ATP into the sciatic nerve. All error bars show SEM. Statistical analysis shows Student two-tailed T-tests
Fig. 2
Fig. 2
Setup of the saphenous nerve imaging experiment. a After deep anesthesia, the mouse is placed on its back, the skin of its left inner tight is removed and the saphenous nerve (N) is placed on a plastic strip (S). Two stimulation microelectrodes (1 and 2) are inserted on both sides of the nerve on the plastic strip and one hook-shaped recording electrode (3) is holding the nerve on the opposite side. b The ground electrode (4) is inserted in the mouse tail and the negative electrode (5) in the groin area. c A glass coverslip (Co) is then placed on the nerve soaked in PBS and the mouse is then placed under the two-photon microscope immersion lens 20X (L) in water. d Schematic view of the imaging setup. e Schematic representation of the nerve stimulation pattern used to induce APs. The generation of APs was verified using the recording electrode. Negative electrode was used to correct for background signal
Fig. 3
Fig. 3
Effect of burst nerve stimulation on mitochondrial ATP and H2O2 levels. a Upper panels: Nerve stimulation induced changes in the fluorescence signal of both the CFP and Venus subunit of mito-ATeam as illustrated by the Venus/CFP overlay pictures. Lower panel: graph showing mito-ATeam fluorescence ratio normalized to pre-stimulation values (R/R0) following two successive nerve stimulation period (black bars at the top). The first stimulation results in a slight, non-significant increase; a significant increase is measured after a second stimulation (p = 0.0171 at t = 45, p = 0.0001 at t = 50, p = 0.049 at t = 55; F-value = 2.872; Df = 15; n = 9 axons in 3 mice). b Upper panels: Nerve stimulation induced changes in the fluorescence signal of both the oxidized and reduced forms of GFP in mito-roGFP-Orp1 as illustrated by the overlay pictures. Lower panel: graph showing mito-roGFP-Orp1 fluorescence ratio normalized on pre-stimulation values (R/R0) following two successive nerve stimulation (black bars at the top). Both stimulations result in a significant increase 5 min after the stimulation (p = 0.007; p = 0.04; F-value = 2.804; Df = 14; n = 14 axons in 7 mice). c Graphs described in a and b were overlaid to show the relative dynamics of ATP and ROS levels after nerve stimulations. Scale bars = 5 μm. Error bars show SEM. Statistical tests are one-way ANOVA
Fig. 4
Fig. 4
ATP and H2O2 levels of MFN2R94Q mice. a Graph showing mito-ATeam fluorescence ratio in resting axonal mitochondria of wild-type or mutant MFN2R94Q mice (Student two-tailed T-test p = 0.809; n = 18 axons, 7 mice per group). b Graph showing mito-ATeam fluorescence ratio normalized on pre-stimulation values (R/R0) following two successive nerve stimulation periods (black bars at the top). The first period of stimulation resulted in a slight, non-significant increase; the second stimulation period did not generate any change (n = 14 axons in 5 mice). c Graphs showing mito-ATeam R/R0 in wild-type (Fig. 3a) and mutant MFN2R94Q mice (b) were overlaid to show the relative dynamics of ATP levels in both genotypes after nerve stimulations (Two way ANOVA, p = 0.011 at t = 45, p = 4.8E-5 at t = 50, p = 0.02 at t = 55, F-value = 19,27; Df = 1). d Graph showing mito-roGFP-Orp1 fluorescence ratio in resting axonal mitochondria of wild-type or mutant MFN2R94Q mice (Student two-tailed T-test p = 0.337; n = 16 axons, 8 mice per group). e Graph showing mito-roGFP-Orp1 fluorescence ratio normalized on pre-stimulation values (R/R0) following two successive nerve stimulation periods (black bars at the top). Both stimulations result in a significant increase (p = 0.013 at t = 15, p = 0.020 at t = 20, p = 0.044 at t = 25 and p = 0.038 at t = 45; F-value = 3.095; Df = 14; n = 11 axons in 4 mice). f Graphs showing mito-roGFP-Orp1 R/R0 in wild-type (Fig. 3b) and mutant MFN2R94Q mice (e) were overlaid to show the relative dynamics of H2O2 levels in both genotypes after nerve stimulations. A significant higher H2O2 level is detected in wild-type first (Two way ANOVA, p = 0.007 at t = 5, F-value = 5484; Df = 1), then a higher H2O2 level is detected in mutant MFN2R94Q (p = 0.014 at t = 15, p = 0.047 at t = 40). Error bars show SEM. # = p-value< 0.05. ## = p-value< 0.01. ### = p-value< 0.001
Fig. 5
Fig. 5
ATP and H2O2 levels are different along axons. a Two-photons imaging of CFP (blue) and Venus (yellow) fluorescence of mito-ATeam was combined with CARS imaging of the myelin sheath (red). CARS imaging gap shows a node of Ranvier (arrowhead). Using the combined images, mitochondria located in the node of Ranvier and mitochondria located in internodes can be identified (right panel). Scale bar = 10 μm b Graph showing mito-ATeam fluorescence ratio in axonal mitochondria located in nodes of Ranvier (N) or internodes (IN) of wild-type (WT) or MFN2R94Q mice (MFN2 mutant). In wild-type mice, ATP levels are higher in mitochondria in nodes of Ranvier than in internodes (p = 0.035; n = 14 axons in 7 mice). In MFN2R94Q mice, ATP levels in node of Ranvier mitochondria are equal to internode mitochondria (n = 7 nodes in 3 mice). c Graph showing mito-roGFP-Orp1 fluorescence ratio in axonal mitochondria located in nodes of Ranvier or internodes of wild-type or mutant MFN2R94Q mice. In both wild-type mice and mutant MFN2R94Q mice, H2O2 levels are higher in mitochondria in nodes of Ranvier than in internodes (WT: p = 0.009; n = 8 axons in 3 mice. MFN2R94Q: p = 0.019; n = 9 axons in 3 mice). Error bars show SEM. Statistical tests are paired two-sided T-tests
Fig. 6
Fig. 6
Impact of demyelination on axonal mitochondria ATP and H2O2. a CARS imaging is used to visualize myelin. At week 0, before injection of LPC, most axons are myelinated. 1 week after LPC injection, axons are demyelinated and myelin debris and ovoids are observed. At week 2, thinly myelinated axons are observed in between the myelin debris (arrowheads) and at week 3, almost all axons are myelinated again, thus resembling a healthy nerve. PBS injection induces small conformational changes, but no formation of ovoids or debris. Inserts show that neuronal mitochondria remain visible throughout the whole process. b Graph showing mito-ATeam fluorescence ratio (R) in axonal mitochondria normalized on pre-demyelination values (R0) following demyelination. Following LPC injection, ATP levels are unchanged after 1 week (p = 0.085; n = 5 mice; 27 axons), decreased after 2 weeks (p = 0.019; n = 3 mice, 24 axons) and restored after 3 weeks (p = 0.491; n = 5 mice; 31 axons). PBS injection results in no significant change (p = 0.799; n = 3 mice; 23 axons). c Graph showing mito-roGFP-Orp1 fluorescence ratio (R) in axonal mitochondria normalized on pre-demyelination values (R0) following demyelination. Following LPC injection, H2O2 levels are increased after 1 week (p = 0.031; n = 10 mice, 17 axons), and unchanged after 2 weeks (p = 0.663; n = 5 mice, 9 axons) and after 3 weeks (p = 0.450; n = 8 mice, 13 axons). PBS injection results in no significant change (p = 0.121; n = 3 mice, 5 axons)

References

    1. Ainbinder A, Boncompagni S, Protasi F, Dirksen RT. Role of Mitofusin-2 in mitochondrial localization and calcium uptake in skeletal muscle. Cell Calcium. 2015;57:14–24. doi: 10.1016/j.ceca.2014.11.002. - DOI - PMC - PubMed
    1. Albrecht SC, Barata AG, Großhans J, Teleman AA, Dick TP. In vivo mapping of hydrogen peroxide and oxidized glutathione reveals chemical and regional specificity of redox homeostasis. Cell Metab. 2011;14:819–829. doi: 10.1016/j.cmet.2011.10.010. - DOI - PubMed
    1. Allt G, Ghabriel MN, Sikri K. Lysophosphatidyl choline-induced demyelination. Acta Neuropathol (Berl) 1988;75:456–464. doi: 10.1007/BF00687132. - DOI - PubMed
    1. Ames A. CNS energy metabolism as related to function. Brain Res Rev. 2000;34:42–68. doi: 10.1016/S0165-0173(00)00038-2. - DOI - PubMed
    1. Attwell D, Laughlin SB. An energy budget for signaling in the grey matter of the brain. J Cereb Blood Flow Metab. 2001;21:1133–1145. doi: 10.1097/00004647-200110000-00001. - DOI - PubMed

Publication types

MeSH terms

Substances