. 2019 Jun 11;4(4):e00061-19.
doi: 10.1128/mSystems.00061-19.

Metaphenomic Responses of a Native Prairie Soil Microbiome to Moisture Perturbations

Affiliations

Metaphenomic Responses of a Native Prairie Soil Microbiome to Moisture Perturbations

Taniya Roy Chowdhury et al. mSystems. .

Abstract

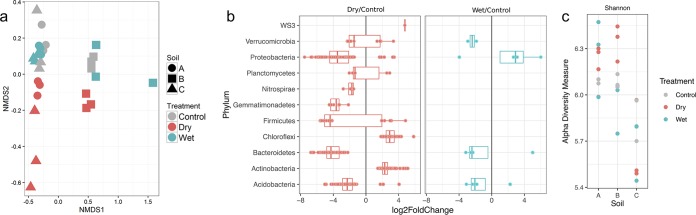
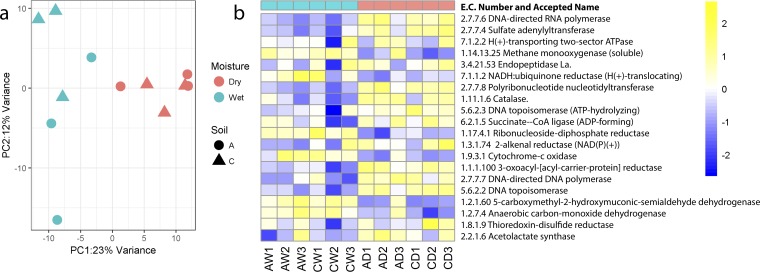
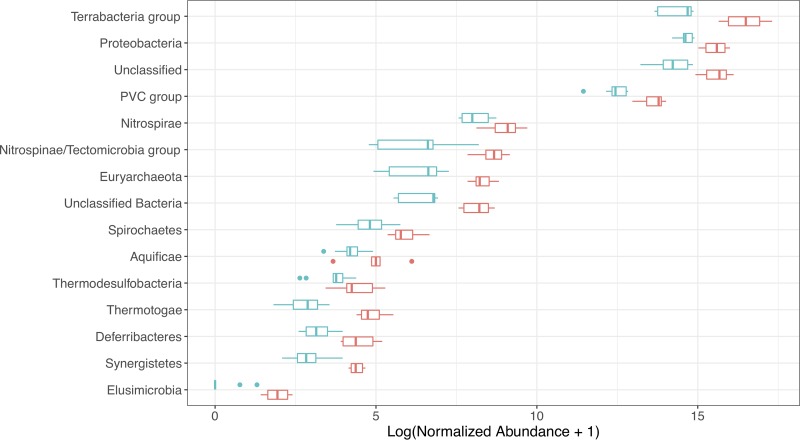
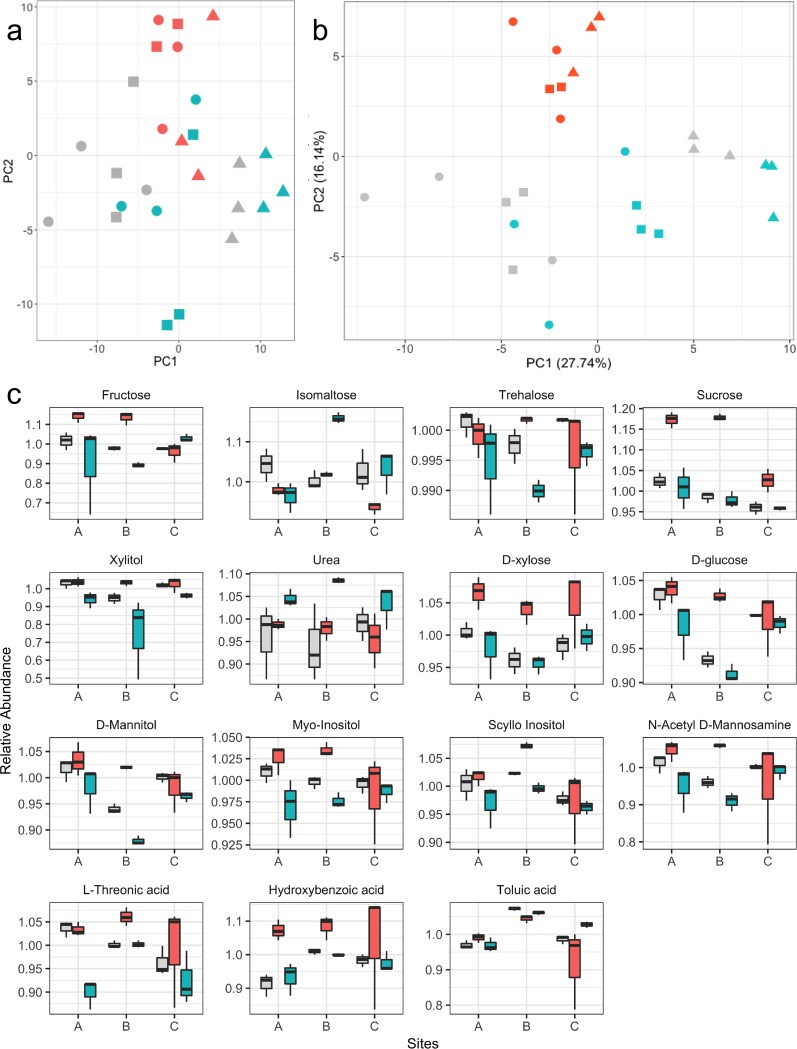
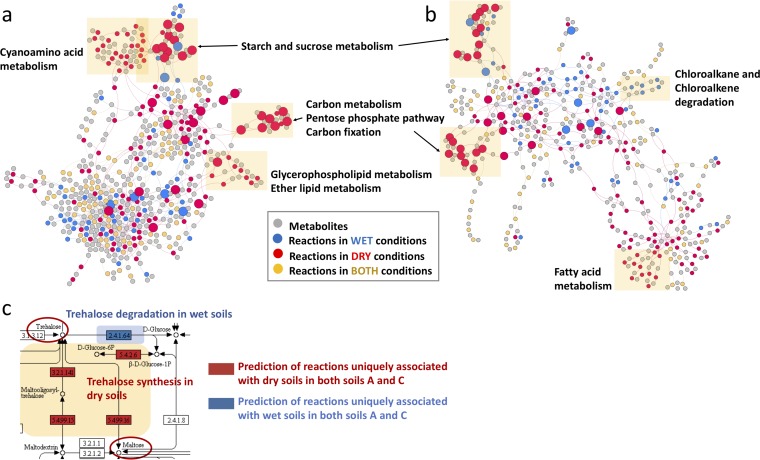
Climate change is causing shifts in precipitation patterns in the central grasslands of the United States, with largely unknown consequences on the collective physiological responses of the soil microbial community, i.e., the metaphenome. Here, we used an untargeted omics approach to determine the soil microbial community's metaphenomic response to soil moisture and to define specific metabolic signatures of the response. Specifically, we aimed to develop the technical approaches and metabolic mapping framework necessary for future systematic ecological studies. We collected soil from three locations at the Konza Long-Term Ecological Research (LTER) field station in Kansas, and the soils were incubated for 15 days under dry or wet conditions and compared to field-moist controls. The microbiome response to wetting or drying was determined by 16S rRNA amplicon sequencing, metatranscriptomics, and metabolomics, and the resulting shifts in taxa, gene expression, and metabolites were assessed. Soil drying resulted in significant shifts in both the composition and function of the soil microbiome. In contrast, there were few changes following wetting. The combined metabolic and metatranscriptomic data were used to generate reaction networks to determine the metaphenomic response to soil moisture transitions. Site location was a strong determinant of the response of the soil microbiome to moisture perturbations. However, some specific metabolic pathways changed consistently across sites, including an increase in pathways and metabolites for production of sugars and other osmolytes as a response to drying. Using this approach, we demonstrate that despite the high complexity of the soil habitat, it is possible to generate insight into the effect of environmental change on the soil microbiome and its physiology and functions, thus laying the groundwork for future, targeted studies.IMPORTANCE Climate change is predicted to result in increased drought extent and intensity in the highly productive, former tallgrass prairie region of the continental United States. These soils store large reserves of carbon. The decrease in soil moisture due to drought has largely unknown consequences on soil carbon cycling and other key biogeochemical cycles carried out by soil microbiomes. In this study, we found that soil drying had a significant impact on the structure and function of soil microbial communities, including shifts in expression of specific metabolic pathways, such as those leading toward production of osmoprotectant compounds. This study demonstrates the application of an untargeted multi-omics approach to decipher details of the soil microbial community's metaphenotypic response to environmental perturbations and should be applicable to studies of other complex microbial systems as well.

Keywords: metaphenome; metatranscriptome; multi-omics; soil microbiome.


Figures

FIG 1
FIG 1
Soil microbiome response to wetting and drying. (a) Nonmetric multidimensional scaling (NMDS) plot of Bray-Curtis dissimilarities showing the microbial community structure estimated by 16S rRNA gene sequencing of soils collected from 3 Kansas prairie field locations. Site (A, circles; B, squares; C, triangles) and treatment (blue, wet; red, dry; gray, ambient field-moisture control). The stress value for the NMDS is 0.076. All sequence count data were normalized to the upper 75th quantile. (b) Differential abundances of OTUs within phyla that were observed to significantly shift in response to drying and wetting relative to continuous moisture control conditions (log2 fold change, adjusted P value < 0.01). (c) Alpha diversity (Shannon’s index) of the soil microbiome in soils A, B, and C, for control (gray), dry (red), and wet (blue) treatments.
FIG 2
FIG 2
Response of soil metatranscriptome to moisture perturbations. (a) Metatranscriptome data shown as a PCoA ordination of Bray-Curtis dissimilarities of sequence data categorized by function, i.e., Enzyme Commission (EC) number. Site (A, circles; C, triangles) and treatment (blue, wet; red, dry). All sequence count data were normalized to the upper 75th quantile. (b) Heat map showing the top 20 most abundant transcripts (ECs) observed under dry relative to wet conditions. The x axis indicates soil sample (A or C), treatment (W, wet; D, dry), and replicate (1, 2, or 3). Moisture conditions are indicated by the header row in blue (wet) or red (dry). The color gradient for each cell is scaled to a log2 fold change of −2 to 2.
FIG 3
FIG 3
Transcriptional response of different phyla to soil wetting and drying. Log-normalized abundance of active members of the soil microbial community that significantly shifted in abundance in response to drying relative to the wet conditions, as revealed by mapping transcripts to contig-level taxonomies derived from the soil metagenome. All sequence count data were normalized to the upper 75th quantile. Log10 values of the normalized read counts are presented on the x axis, and taxa that shifted significantly in abundance at the phylum level are shown on the y axis. Changes in read count were considered significant for log2 fold change of >2.0 and Padj of <0.05.
FIG 4
FIG 4
Impact of soil moisture treatments on the soil metabolome. (a) Global metabolome data shown as a projection pursuit principal-component analysis (PPCA) of all detected metabolites. Relative abundance data for metabolites were log2 transformed and median centered. The % on the axes represents the variance explained by each of the coordinates. Site (A, circles; B, triangles; C, squares) and treatment (gray, control; blue, wet; red, dry). (b) Metabolite data shown as a projection pursuit principal-component analysis (PPCA) of metabolites with significant treatment effects for at least one site. (c) Fifteen of 70 detected metabolites that changed significantly under the wet or dry treatments compared to control (P < 0.05, one-way ANOVA). Whiskers indicate the most extreme values within 1.5 multiplied by the interquartile region. Box, 25% quartile; median, 75% quartile. Pairwise comparisons of means to test treatment effects were performed after outlier removal.
FIG 5
FIG 5
Prediction by MEMPIS of the moisture impact on biochemistry in native prairie soil. (a and b) Reaction-metabolite integrative bipartite networks for soils A (a) and C (b) are shown. Gray symbols indicate metabolites, and lines indicate relationships between reactions or metabolites based on KEGG annotation. Colored symbols indicate reactions that are more prevalent under specific incubation conditions: blue, wet; red, dry; yellow, both. Yellow shading highlights specific pathways that are more prevalent under dry conditions. Larger nodes represent the commonly predicted reactions in both soils A and C, while small nodes represent the uniquely predicted reactions in the individual soil. (c) Predicted reactions for trehalose synthesis and degradation in the starch and sucrose metabolism pathways are shown. Colored boxes indicate the predicted reactions uniquely associated with dry and wet conditions in both soils A and C.

References

    1. Cook BI, Seager R, Miller RL. 2011. Atmospheric circulation anomalies during two persistent North American droughts: 1932–1939 and 1948–1957. Clim Dyn 36:2339–2355. doi:10.1007/s00382-010-0807-1. - DOI
    1. Intergovernmental Panel on Climate Change. 2013. The physical science basis: working group I contribution to the fifth assessment report of the Intergovernmental Panel on Climate Change. Cambridge University Press, New York, NY.
    1. Taylor C, de Jeu R, Guichard F, Harris P, Dorigo W. 2012. Afternoon rain more likely over drier soils. Nature 489:423–426. doi:10.1038/nature11377. - DOI - PubMed
    1. Porporato A, Vico G, Fay P. 2006. Superstatistics of hydro-climatic fluctuations and interannual ecosystem productivity. Geophys Res Lett 33:L15402. doi:10.1029/2006GL026412. - DOI
    1. Guo Y, Gong P, Amundson R, Yu Q. 2006. Analysis of factors controlling soil carbon in the conterminous United States. Soil Sci Soc Am J 70:601–612. doi:10.2136/sssaj2005.0163. - DOI