. 2019 Jun 25;116(26):12804-12809.
doi: 10.1073/pnas.1900102116. Epub 2019 Jun 11.

Massively parallel screening of synthetic microbial communities

Affiliations

Massively parallel screening of synthetic microbial communities

Jared Kehe et al. Proc Natl Acad Sci U S A. .

Abstract

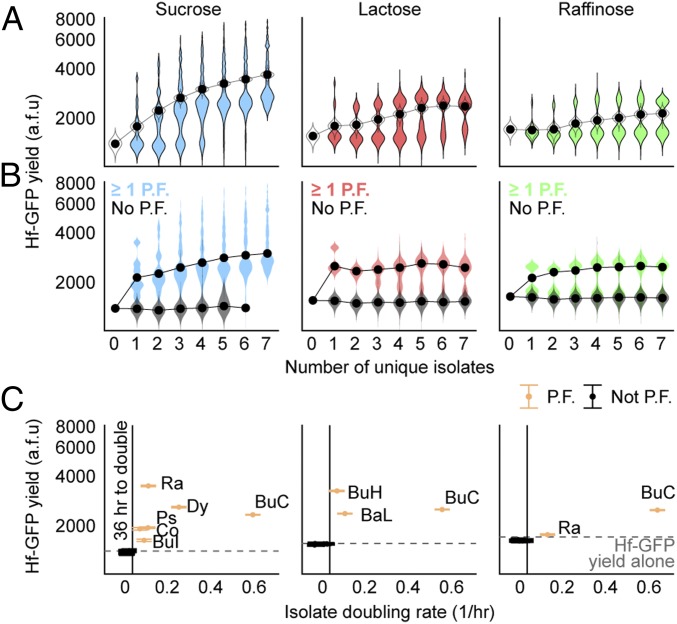
Microbial communities have numerous potential applications in biotechnology, agriculture, and medicine. Nevertheless, the limited accuracy with which we can predict interspecies interactions and environmental dependencies hinders efforts to rationally engineer beneficial consortia. Empirical screening is a complementary approach wherein synthetic communities are combinatorially constructed and assayed in high throughput. However, assembling many combinations of microbes is logistically complex and difficult to achieve on a timescale commensurate with microbial growth. Here, we introduce the kChip, a droplets-based platform that performs rapid, massively parallel, bottom-up construction and screening of synthetic microbial communities. We first show that the kChip enables phenotypic characterization of microbes across environmental conditions. Next, in a screen of ∼100,000 multispecies communities comprising up to 19 soil isolates, we identified sets that promote the growth of the model plant symbiont Herbaspirillum frisingense in a manner robust to carbon source variation and the presence of additional species. Broadly, kChip screening can identify multispecies consortia possessing any optically assayable function, including facilitation of biocontrol agents, suppression of pathogens, degradation of recalcitrant substrates, and robustness of these functions to perturbation, with many applications across basic and applied microbial ecology.

Keywords: community assembly; droplet microfluidics; high-throughput screening; microbial interactions; synthetic ecology.


Conflict of interest statement

Conflict of interest statement: P.C.B. is an extramural faculty member of MIT’s Koch Institute for Integrative Cancer Research and a consultant to and equity holder in two companies in the microfluidics industry, 10X Genomics and General Automation Lab Technologies. The Broad Institute and MIT may seek to commercialize aspects of this work, and related applications for intellectual property have been filed.

Figures

Fig. 1.
Fig. 1.
kChip enables massively parallel construction of microbial communities. (A) To run a kChip screen, 1-nL droplets are first produced. Each droplet contains a color code (a specific ratio of three fluorescent dyes) that maps to a corresponding input. After they have been pooled, droplets are loaded onto the kChip, where they randomly group into microwells (SI Appendix, Fig. S1). The microwells are designed to group precisely k droplets. The kChip is imaged to identify the contents of each microwell from the droplet color codes. Droplets are then merged within their respective microwells via exposure to an alternating-current electric field, generating parallel synthetic communities. Community phenotypes can be tracked via optical assays, including fluorescent protein expression and respiration-driven reduction of resazurin to the fluorescent product resorufin. (B) Example micrographs show grouping and merging of droplets for different microwell types, the designs for which are described in SI Appendix, Fig. S2. Microwells are densely packed on the kChip, with microwell density varying inversely with size (k). A single microwell type can be arrayed across a kChip (“Full kChip”). For the screening application reported in Figs. 3 and 4, we have generated a “k = {1:7;19} Chip” that includes different microwell types arranged in parallel.
Fig. 2.
Fig. 2.
Carbon utilization profiles of labeled and unlabeled strains were measured on k = 2 Chips. (A) Droplet libraries can be made from a library of fluorescently labeled strains (SI Appendix, Table S1) and a set of carbon sources (SI Appendix, Table S2). The ability of each strain to grow on each carbon source can be measured by monitoring microwells that receive one microbe-containing droplet and one carbon source-containing droplet. (B) To measure growth of unlabeled strains, the dye resazurin is added to carbon source inputs before droplet production (postmerge concentration of 40 μM). Resazurin is reduced to the fluorescent product resorufin in the presence of metabolically active cells. (C) We measured fluorescence for a panel of 10 fluorescent strains (starting OD600 = 0.02) across 15 conditions [13 carbon sources at 0.5% (wt/vol), one additional glucose replicate control, and one negative control (no carbon)] in k = 2 Chip microwells (21 °C, no shaking) as well as 200-μL cultures in 96-well plates (21 °C, 220 rpm). Heatmaps show the relative signal at 50 h, with interleaved columns corresponding to the kChip and 96-well plates (Pearson r = 0.868) (full time course is shown in SI Appendix, Fig. S6). (D) We measured the resazurin signal (fluorescence due to resorufin accumulation) for three strains (starting OD600 = 0.005) across four carbon source conditions in k = 2 Chip microwells (21 °C, no shaking) and compared those signals with OD600 measurements from 200-μL cultures in 96-well plates (21 °C, 220 rpm). Heatmaps show signal at 22 h (Pearson r = 0.969) (full time course is shown in SI Appendix, Fig. S8). In C and D, the relative signal for each row is obtained by normalizing to the maximum across all carbon sources and time points after background subtraction. Ec, Escherichia coli; GlcNAc, N-acetylglucosamine; Hf, Herbaspirillum frisingense; Pae, Pseudomonas aeruginosa; Pau, Pseudomonas aurantiaca; Pch, Pseudomonas chlororaphis; Pci, Pseudomonas citronellolis; Pf, Pseudomonas fluorescens; Pp, Pseudomonas putida; Ps, Pseudomonas syringae; Pv, Pseudomonas veronii; Rep, replicate.
Fig. 3.
Fig. 3.
High-throughput kChip screening identifies H. frisingense-promoting compositions that are robust to carbon source and community context. (A) Screen schematic to identify Hf-GFP–promoting compositions. Assays are constructed whereby Hf-GFP represents half of the starting biomass (starting Hf-GFP OD600 = 0.02) and the other half is divided evenly among one to seven or 19 soil isolate inputs (starting total isolate OD600 = 0.02 if no control droplets are present). Each of these communities is constructed in one of six media that each contain a single carbon source. Each carbon source enables a different Hf-GFP monoculture yield (SI Appendix, Fig. S10). Droplets containing the same carbon source are pooled and loaded onto the same kChip (six kChips in total, 21 °C, no shaking). After droplet merging, Hf-GFP yield is measured (24 h, 48 h, and 72 h) in each community/carbon source environment. (B) Total number of assay points collected for different values of k (about evenly divided among the six kChips; Dataset S2). (C) Ranked Hf-GFP yield at 72 h for all constructed compositions. A median is represented when a composition is replicated more than one time (with a mean calculated in instances of two replicates), error bar = SEM, and dotted line = Hf-GFP yield in monoculture. (D) Effect of each s-sized composition on Hf-GFP was analyzed in two ways to identify the most facilitative and robust compositions. Here, the composition [BaL + Ra + Ps] is used as an example. (Top) First, all instances of [BaL + Ra + Ps] appearing in k = 3 microwells were identified across all carbon sources, and the median Hf-GFP yield for these was calculated (“Hf-GFP median yield”). (Bottom) Second, all instances of [BaL + Ra + Ps + one or more additional isolate] in k ≥ 4 microwells were identified across all carbon sources, and the 10th percentile of Hf-GFP yield for these was calculated (“Hf-GFP robustness”). The color of each data point indicates the carbon source. Gray dotted line = minimal viable Hf-GFP yield (1,500 GFP counts, or 1 SD above Hf-GFP monoculture yield in sucrose medium). (E) For compositions represented 30 or more times across all carbon sources (only k = 1, k = 2, and k = 3 compositions met this criterion; SI Appendix, Fig. S13), Hf-GFP median yield and Hf-GFP robustness were calculated as described in D. Dark blue points indicate a composition contains at least BuC. Dark green points indicate a composition contains at least [BaL + Ra]. The diagonal line is the x = y line. a.f.u., arbitrary fluorescence units; Av, Averyella dalhousiensis; Ch, Chryseobacterium sp.; Co, Collimonas sp.; Ew, Ewingella americana; Ps, Pseudomonas fluorescens.
Fig. 4.
Fig. 4.
Facilitation increases with community richness and is driven by a subset of strains. (A) In a medium containing sucrose, lactose, or raffinose, Hf-GFP yield increased with community richness. Colored distributions indicate median Hf-GFP yields for all unique compositions at a given k (i.e., all droplets in a given combination contain different strains). The black data point indicates the median of distribution. Outlined distributions represent medians of 100 bootstrap-resampled datasets at each k, whereby the Hf-GFP yield dataset for each k was resampled with replacement (with a resampling sample size equal to the actual sampling size), and a median of the resampled data was calculated each time. (B) Presence of one or more primary facilitator (P.F.) (SI Appendix, Fig. S19) was necessary and typically sufficient to enable Hf-GFP growth and drive a facilitative effect when additional isolates were present. In the case of raffinose, one of the two primary facilitators (Ra) facilitated Hf-GFP weakly, giving rise to a clear bimodal distribution. Colored distributions indicate Hf-GFP growth in communities possessing one or more primary facilitators. Gray distributions indicate Hf-GFP yield in communities with no primary facilitators (with distributions absent when there were no communities in the dataset consisting of all unique inputs and no primary facilitators). (C) Resazurin assay was conducted on a separate k = 2 Chip in parallel with the screen to measure the growth rate of each isolate (SI Appendix, Fig. S20). The subset of isolates that grew on a given carbon source (defined as one or more doubling of resorufin fluorescence by 36 h) corresponded to the subsets of isolates identified as primary facilitators. The number of data points in each distribution is given in Dataset S2. a.f.u., arbitrary fluorescence units; BuH, Burkholderia sp. II; BuI, Burkholderia sp. III; Co, Collimonas sp.; Ps, Pseudomonas fluorescens.

References

    1. Hemingway J. D., et al. , Microbial oxidation of lithospheric organic carbon in rapidly eroding tropical mountain soils. Science 360, 209–212 (2018). - PubMed
    1. Bardgett R. D., Freeman C., Ostle N. J., Microbial contributions to climate change through carbon cycle feedbacks. ISME J. 2, 805–814 (2008). - PubMed
    1. Shi S., et al. , Plant roots alter microbial functional genes supporting root litter decomposition. Soil Biol. Biochem. 127, 90–99 (2018).
    1. Buffie C. G., et al. , Precision microbiome reconstitution restores bile acid mediated resistance to Clostridium difficile. Nature 517, 205–208 (2015). - PMC - PubMed
    1. Berendsen R. L., Pieterse C. M. J., Bakker P. A., The rhizosphere microbiome and plant health. Trends Plant Sci. 17, 478–486 (2012). - PubMed

Publication types

MeSH terms

LinkOut - more resources