. 2019 Jun 11;10(1):2416.
doi: 10.1038/s41467-019-10369-9.

LIF regulates CXCL9 in tumor-associated macrophages and prevents CD8+ T cell tumor-infiltration impairing anti-PD1 therapy

Affiliations

LIF regulates CXCL9 in tumor-associated macrophages and prevents CD8+ T cell tumor-infiltration impairing anti-PD1 therapy

Mónica Pascual-García et al. Nat Commun. .

Abstract

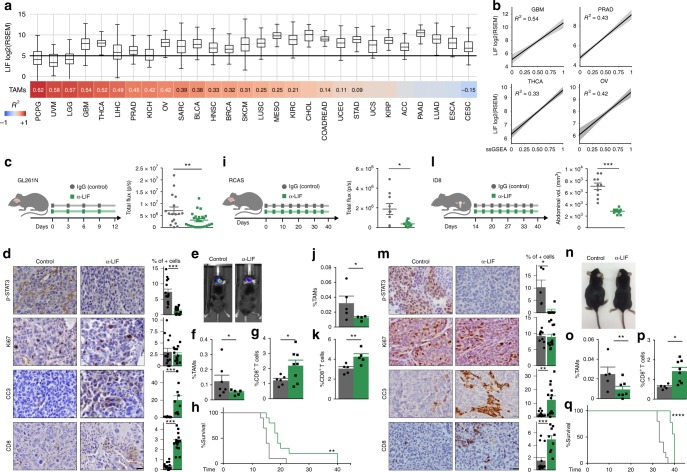
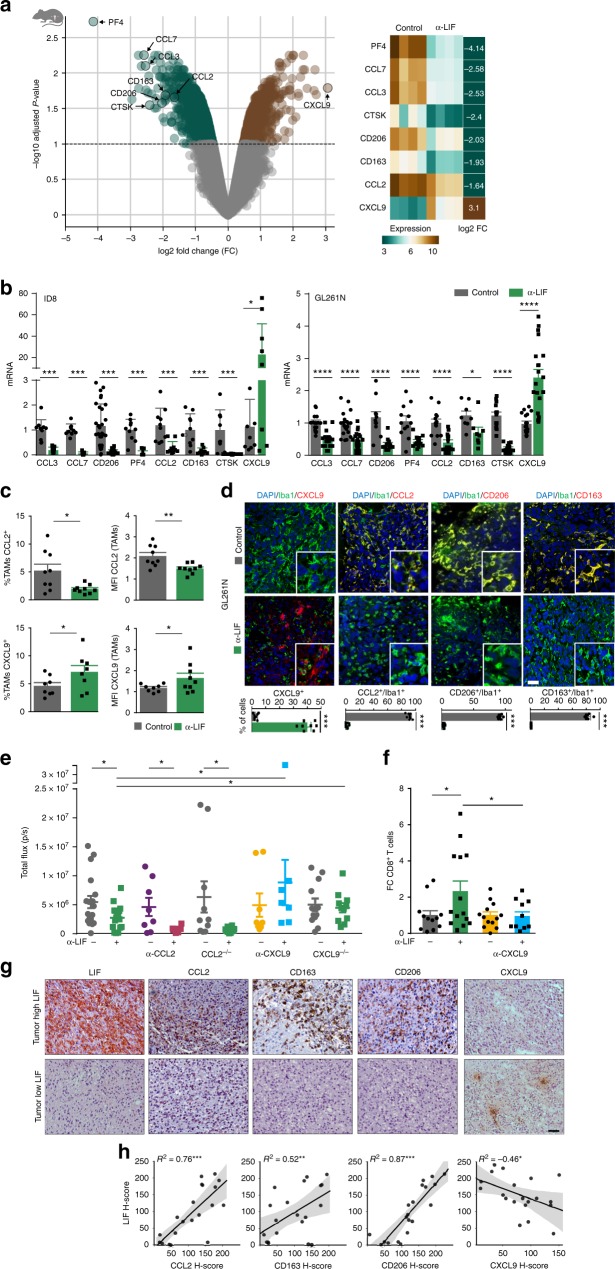
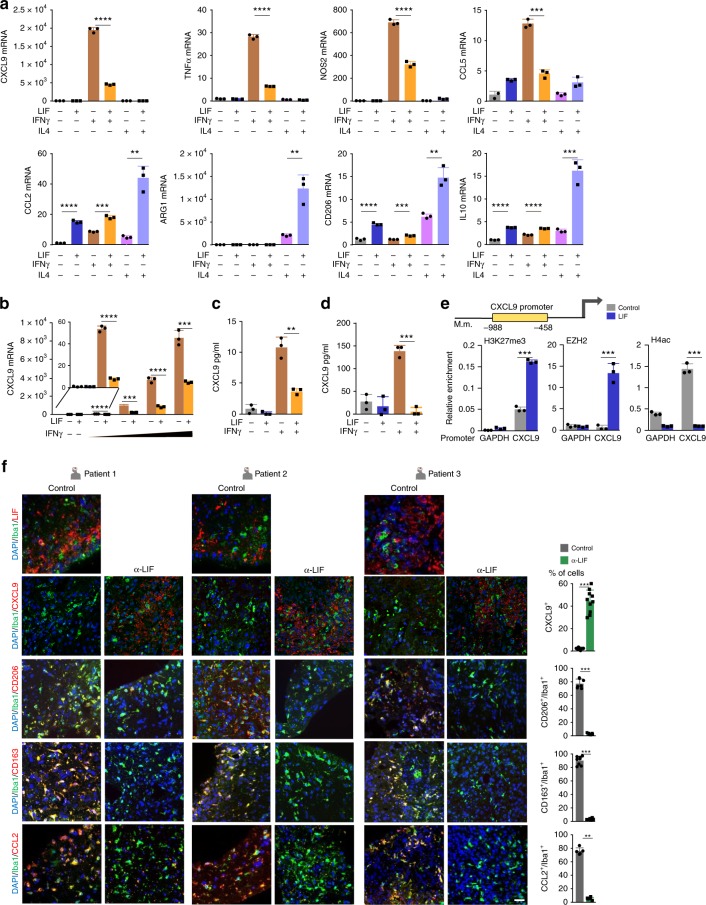
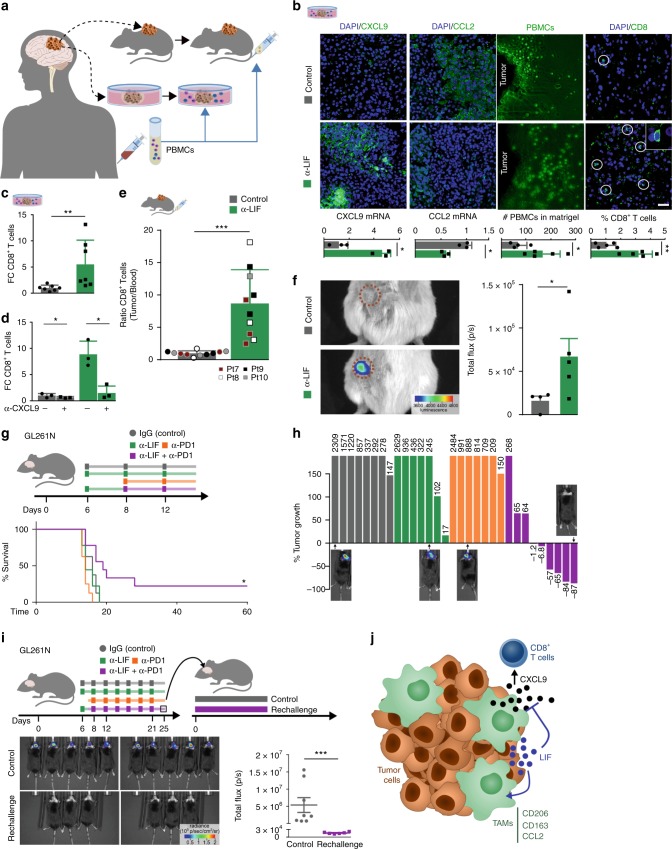
Cancer response to immunotherapy depends on the infiltration of CD8+ T cells and the presence of tumor-associated macrophages within tumors. Still, little is known about the determinants of these factors. We show that LIF assumes a crucial role in the regulation of CD8+ T cell tumor infiltration, while promoting the presence of protumoral tumor-associated macrophages. We observe that the blockade of LIF in tumors expressing high levels of LIF decreases CD206, CD163 and CCL2 and induces CXCL9 expression in tumor-associated macrophages. The blockade of LIF releases the epigenetic silencing of CXCL9 triggering CD8+ T cell tumor infiltration. The combination of LIF neutralizing antibodies with the inhibition of the PD1 immune checkpoint promotes tumor regression, immunological memory and an increase in overall survival.


Conflict of interest statement

J.S. is a founder of Mosaic Biomedicals and share holder of Northern Biologics. J.S. received grant/research support from Mosaic Biomedicals, Northern Biologics and Roche/Glycart. J.T. reports scientific consultancy role for Array Biopharma, AstraZeneca, Bayer, BeiGene, Boehringer Ingelheim, Chugai, Genentech Inc., Genmab A/S, Halozyme, Imugene Limited, Inflection Biosciences Limited, Ipsen, Kura Oncology, Lilly, MSD, Menarini, Merck Serono, Merrimack, Merus, Molecular Partners, Novartis, Peptomyc, Pfizer, Pharmacyclics, ProteoDesign SL, Rafael Pharmaceuticals, F. Hoffmann–La Roche Ltd., Sanofi, SeaGen, Seattle Genetics, Servier, Symphogen, Taiho, VCN Biosciences, Biocartis, Foundation Medicine, HalioDX SAS and Roche Diagnostics. E.P. reports scientific consultancy role for Celgene. E.P. reports scientific consultancy role for Celgene. E.G. received grant/research support from Novartis. E.G. reports scientific consultancy role for Roche/Genentech, Hoffmann La Roche, Ellipses Pharma, Neomed Therapeutics, Boehringer Ingelheim, Janssen Globlas Services, AstraZeneca. I.B. reports scientific consultancy role for Orion Pharma. P.N. reports scientific consultancy role for Bayer, Novartis and Merck Sharp and Dohme. The remaining authors declare no competing interests.

Figures

Fig. 1
Fig. 1
LIF blockade decreases tumor growth and regulates immune cell infiltration. a Top-panel, distribution of LIF mRNA expression (log2 RSEM) across 28 distinct solid tumors (see Supplementary Data 1b) in boxplots (middle line depicts the median and the whiskers the interquartile range). Black line represents the estimated cut-off between low expression/background noise. Bottom panel, correlation values (Pearson R2 values) between LIF expression and the relative abundance of TAMs based on ssGSEA of the gene signature (see Supplementary Data 1a). Correlation values are only shown if the correlation is significant (adjusted P-value < 0.1) (see Supplementary Data 1c). Cancer types are sorted according correlation value between LIF and TAMs relative abundance. b Linear regression plots of LIF expression and relative abundance (ssGSEA rescaled from 0 to 1 for visualization purposes) of TAMs in GBM, prostate adenocarcinoma (PRAD), thyroid carcinoma (THCA) and ovarian carcinoma (OV) cohorts. Shade represents the confidence intervals of the regression estimate. c, i, l Tumor growth of GL261N (c), RCAS (i), and ID8 (l) models measured as total flux (p/s) or abdominal volume (mm3), respectively. Scheme representing the experimental procedure is shown. Anti-LIF or isotype control (IgG) treatment started on the day of surgery (GL261N and RCAS) or 14 days post-inoculation (dpi) (ID8). d, m Representative p-STAT3, Ki67, CC3, and CD8 IHC images and percentages of staining for GL261N (d) and ID8 (m) tumors. e, n Representative images of GL261N (e) and ID8 (n) tumor-bearing mice treated with anti-LIF or IgG. fg, jk, op, Percentages of CD11b+ F4/80+ CD163+ CD206+ MHCIIlow TAMs (f, o) or CD11b+ Ly6G Ly6C CD163+ CD206+ MHCIIlow (j) and CD8+ T cells (CD3+ CD8+) of GL261N (g), RCAS (k), and ID8 (p) tumors analysed by flow cytometry. h, q, Overall survival of GL261N (h) and ID8 (q) models treated with anti-LIF or IgG. Data are mean ± SEM. Statistical analyses by Mann–Whitney T-test and Log-rank test. *P < 0.05; **P < 0.01; ***P < 0.001; ****P < 0.0001
Fig. 2
Fig. 2
LIF regulates CXCL9, CCL2, CD206, and CD163 in TAMs. a Differential expression analysis of isolated CD11b+ cells from anti-LIF treated ID8 mice vs. control. Volcano plot representing the genes significantly (Q-value < 0.1) overexpressed (brown) and significantly underexpressed (turquoise). Heatmap representing the expression values of the indicated genes, each column represents a sample and each row a gene. The last column represents the log2 fold change (log2 FC) of gene expression. b mRNA expression for the indicated genes in isolated CD11b+ cells from anti-LIF treated or untreated ID8 and GL261N tumors. c Percentage and mean fluorescence intensity (MFI) of CCL2 and CXCL9 in TAMs (CD11b+ Ly6G Ly6C) from anti-LIF treated or untreated GL261N tumors. d Representative IF images of Iba1 and the indicated markers stainings of GL261N tumors (see Supplementary Fig. 4). Scale bar, 20 μm. Bottom, percentage of double positive cells relative to the TAM marker positive cells. CXCL9 quantification is relative to the total number of cells. e Tumor growth of GL261N in WT, CXCL9−/−, and CCL2−/− mice or mice treated with the indicated antibodies is shown as total flux (p/s). f Fold change (FC) of tumor infiltrating CD8+ T cells in the indicated treatments. Data are mean ± SEM. g, h Representative IHC of the indicated markers from 20 GBM tumors. The degree of staining was quantified using H-score method. Correlations between LIF and CCL2, CD206, CD163, and CXCL9 with the R-squared coefficients (R2) were calculated (h). Statistical analyses by Mann–Whitney T-test. *P < 0.05; **P < 0.01; ***P < 0.001; ****P < 0.0001
Fig. 3
Fig. 3
LIF represses CXCL9 through epigenetic silencing. a, b qRT-PCR analysis of the indicated genes in BMDMs. BMDMs were pre-incubated with 20 ng/ml LIF for 72 h and then stimulated with 5 ng/ml IFNγ or 10 μg/ml IL4 during 6 h (a) or with 0.1, 0.5, 1 and 5 ng/ml IFNγ for 24 h (b). c CXCL9 ELISA from BMDMs pre-incubated with 20 ng/ml LIF and then stimulated with 0.1 ng/ml IFNγ for 24 h. d CXCL9 ELISA from human CD11b+sorted cells (77% CD11b+ CD14+, see Supplementary Fig. 7b, c) from human GBM cultured with 20 ng/ml LIF for 72 h and then with 0.1 ng/ml IFNγ for 24 h. e ChIP of Tri-methyl-histone H3 (H3K27me3), EZH2 and acetyl-histone4 (H4ac) was performed in BMDMs treated with 20 ng/ml LIF for 72 h. Scheme shows the analysed CXCL9 promoter region. Representative data are presented as mean ± SD. f Representative images of IF of the indicated markers in human GBM organotypic slices (patients 1, 2, 3) incubated with 10 μg/ml anti-LIF for 3 days. Scale bar, 20 μm. (see Supplementary Fig. 8). Bottom, percentage of double positive cells relative to Iba1+ cells and percentage of CXCL9+ cells relative to the total number of cells. Data are mean of all patients ± SEM. Statistical analyses by Student’s t-test or Mann–Whitney T-test. *P < 0.05, **P < 0.01; ***P < 0.001; ****P < 0.0001
Fig. 4
Fig. 4
LIF blockade induces CD8+ T cell tumor infiltration and promotes tumor regression when combined with anti-PD1. a Schematic representation of GBM patient-derived xenografts and human organotypic models. b Organotypic specimens were treated with anti-LIF for 72 h and then cultured with PBMCs for 24 h. CXCL9 and CCL2 mRNA expression levels are shown. Representative images (patient 4, 5, 6) of CFSE-stained PBMCs into Matrigel containing GBM specimens and IF of the indicated factors in organotypic tissues are displayed. Bars represent quantification of five different fields of each condition. Data are presented as mean ± SD. Scale bar, 20 μm. c, d FC of CD8+ T infiltrating cells detected by flow cytometry in organotypic tissues treated with anti-LIF (c, d) and/or anti-CXCL9 (1.5 μg/ml) (d) for 72 h and then cultured with PBMCs for 48 h (patient 4, 5, 6). e CD8+ T infiltrating cells into subcutaneously engrafted GBM specimens in NSG mice. Bar graph represents the ratio of CD8+ T cells detected by flow cytometry in the tissue vs. CD8+ T cells detected in the blood of the same animal. Four patients (7, 8, 9, 10) with their corresponding PBMCs were evaluated and are represented with different colors. f Representative images of treated or untreated patient-derived xenografts (PDX) bearing mice 48 h after luciferase CD3+ T cells inoculation. T cells infiltration is measured as total flux (p/s) within the tumor. Data are mean ± SEM. g Scheme represents the experimental procedure of GL261N mice treated with anti-LIF, anti-PD1 or the combination. Overall survival determined by Kaplan-Meier curves is shown. h Tumor growth of the treated GL261N model represented as a fold change of tumor size between 13 and 6 dpi. Representative images are shown. i Scheme representing the experimental procedure for regression study. Images of mice and tumor size measured by total flux (p/s) at 13 dpi are shown. j Schematic representation shows the effect of LIF in CD8+ T cell tumor infiltration. Statistical analyses by Mann–Whitney T-test or Log-rank test. *P < 0.05; **P < 0.01; ***P < 0.001

References

    1. Mathieu ME, et al. LIF-dependent signaling: new pieces in the Lego. Stem Cell Rev. 2012;8:1–15. doi: 10.1007/s12015-011-9261-7. - DOI - PMC - PubMed
    1. Trouillas M, et al. The LIF cytokine: towards adulthood. Eur. Cytokine Netw. 2009;20:51–62. - PubMed
    1. Rathjen PD, et al. Developmentally programmed induction of differentiation inhibiting activity and the control of stem cell populations. Genes Dev. 1990;4:2308–2318. doi: 10.1101/gad.4.12b.2308. - DOI - PubMed
    1. Stewart CL, et al. Blastocyst implantation depends on maternal expression of leukaemia inhibitory factor. Nature. 1992;359:76–79. doi: 10.1038/359076a0. - DOI - PubMed
    1. Kralickova M, et al. Leukemia inhibitory factor gene mutations in the population of infertile women are not restricted to nulligravid patients. Eur. J. Obstet. Gynecol. Reprod. Biol. 2006;127:231–235. doi: 10.1016/j.ejogrb.2006.02.008. - DOI - PubMed

Publication types

MeSH terms