. 2019 Jun 11;10(1):2542.
doi: 10.1038/s41467-019-10508-2.

Translatome analysis reveals altered serine and glycine metabolism in T-cell acute lymphoblastic leukemia cells

Affiliations

Translatome analysis reveals altered serine and glycine metabolism in T-cell acute lymphoblastic leukemia cells

Kim R Kampen et al. Nat Commun. .

Abstract

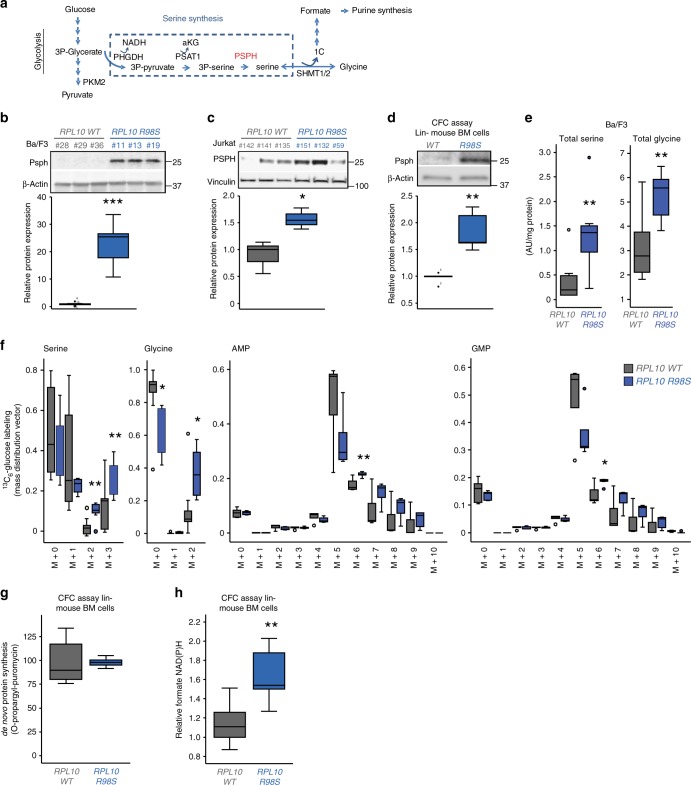
Somatic ribosomal protein mutations have recently been described in cancer, yet their impact on cellular transcription and translation remains poorly understood. Here, we integrate mRNA sequencing, ribosome footprinting, polysomal RNA sequencing and mass spectrometry datasets from a mouse lymphoid cell model to characterize the T-cell acute lymphoblastic leukemia (T-ALL) associated ribosomal RPL10 R98S mutation. Surprisingly, RPL10 R98S induces changes in protein levels primarily through transcriptional rather than translation efficiency changes. Phosphoserine phosphatase (PSPH), encoding a key serine biosynthesis enzyme, was the only gene with elevated transcription and translation leading to protein overexpression. PSPH upregulation is a general phenomenon in T-ALL patient samples, associated with elevated serine and glycine levels in xenograft mice. Reduction of PSPH expression suppresses proliferation of T-ALL cell lines and their capacity to expand in mice. We identify ribosomal mutation driven induction of serine biosynthesis and provide evidence supporting dependence of T-ALL cells on PSPH.


Conflict of interest statement

The authors declare no competing interests.

Figures

Fig. 1
Fig. 1
RPL10 R98S and RPL10 WT cells show distinct ribosome footprinting signatures. a Outline of the study design. b Distribution of the length of ribosome footprints (RPF, ribosome-protected mRNA fragments). c Left: triplet periodicity of ribosome footprinting reads; right: lack of triplet periodicity for mRNA-sequencing reads. The fraction of reads assigned to each of the three frames of translation is reported for each read length. d Metagene profiles of RPF densities around the start and stop codons (indicated by 0). The number of RPFs per position was averaged over all transcripts and normalized for the total number of mapped RPFs. e Principal component analysis based on normalized RPF counts
Fig. 2
Fig. 2
Transcriptional changes associated with RPL10 R98S. a Correlation between changes in total mRNA and RPF levels. Only genes with counts in both ribosome footprinting and matched mRNA sequencing libraries are plotted (n = 10,645). Reported log2-transformed fold changes were calculated by DESeq2. Cor Pearson correlation coefficient. b Principal component analysis based on mRNA levels (normalized read counts) from the mRNA-sequencing dataset associated with ribosome footprinting. c, d Network representation of transcriptionally upregulated (C) or downregulated genes (D) in RPL10 R98S cells. Upregulated or downregulated genes are displayed as white circles and the 8 top scoring transcription factors predicted as their regulators (iRegulon) are shown by colored squares. For each transcription factor, the number of genes that it is predicted to regulate in our mRNA-sequencing data and the normalized enrichment score (NES) are reported. A transcription factor-binding motif can be shared by several members of a transcription factor family. Only the highest scoring one as predicted by iRegulon is shown, while other transcription factors of the family may be responsible for observed mRNA expression changes. e Immunoblot analysis of Helios/Ikzf2 expression in RPL10 WT versus R98S expressing Ba/F3 and Jurkat cells. P-values were calculated using a two-tailed Student’s t-test. All box-plots show the median and error bars define data distribution
Fig. 3
Fig. 3
Significant TE changes identified by ribosome footprinting or polysomal RNA sequencing. a Circular heatmap representing the protein-coding genes with significant changes in TE (Babel, FDR < 0.1, Z-test with Benjamini–Hochberg correction, n = 3 biologically independent RPL10 WT and R98S Ba/F3 clones), identified by polysomal RNA sequencing (outer circle) or ribosome footprinting (middle circle). Corresponding protein changes, when available, are shown in the inner circle. The color scale represents the signed p-value associated to the change (which indicates both significance and direction of the change). Statistically significant changes are indicated by a star (*) and correspond to FDR < 0.1 for TE changes (Babel, Z-test with Benjamini–Hochberg correction, n = 3 biologically independent RPL10 WT and R98S Ba/F3 clones) and p-value < 0.01 for protein change (T-test on normalized spectra from quantitative mass spectrometry, n = 3 biologically independent RPL10 WT and R98S Ba/F3 clones). Only genes with at least 10 aligned ribosome footprints or polysomal RNA reads and at least 10 reads in the corresponding mRNA sequencing dataset for each sample are considered. Genes not passing this threshold or genes with no corresponding protein mass spectrometry measurement are indicated as not available. b Representation of the normalized RPFs for RPL10 WT and R98S Ba/F3 clones aligned to PSPH 5’ untranslated region (5’UTR), coding sequence (CDS, in yellow), and 3’UTR (ENSMUST00000031399). Four arrows indicate the upstream ORFs (positions: 10–369; 373–447; 463–561; 613–681) as predicted by altORFev (10.1093/bioinformatics/btw736). These plots contain pooled data from three RPL10 WT versus three R98S Ba/F3 clones. c Percentages of significant protein changes (quantitative mass spectrometry, T-test, p-value < 0.01) associated with significant mRNA changes (differential expression analysis by DESeq2, two-sided Wald test with Benjamini–Hochberg correction, FDR < 0.1, n = 3 biologically independent RPL10 WT and R98S Ba/F3 clones) and/or with significant TE changes (Babel, Z-test with Benjamini–Hochberg correction, FDR < 0.1, n = 3 biologically independent RPL10 WT and R98S Ba/F3 clones) or neither. Both ribosome footprinting and polysomal RNA sequencing matching mRNA-sequencing datasets were considered for changes in mRNA levels. Changes in TE identified by ribosome footprinting and/or polysomal RNA sequencing were both considered. d Scatterplot representing the correlation between the log2-transformed fold change (RPL10 R98S versus RPL10 WT) in RPF counts and the log2-transformed fold change in polysomal RNA-sequencing counts. e Scatterplots representing the correlation between the log2-transformed fold changes (RPL10 R98S versus RPL10 WT) in RPF counts (on the left) or polysomal RNA-sequencing counts (on the right) and the log2-transformed fold change in normalized protein spectral counts. Cor Pearson correlation coefficient
Fig. 4
Fig. 4
Upregulation of Psph in RPL10 R98S cells induces serine/glycine synthesis. a Schematic overview of serine/glycine synthesis branching from glycolysis. b, d Immunoblot analysis of Psph in several RPL10 WT and R98S cell models: b Ba/F3 lymphoid cells, c Jurkat T-ALL cells, and d lineage negative (lin−) bone marrow (BM) cells. Quantifications below the blots include data from at least three biological replicates. e Total intracellular serine and glycine concentrations in RPL10 WT and R98S Ba/F3 cells. Eight independent Ba/F3 RPL10 WT clones versus six RPL10 R98S clones were analyzed. f Metabolic tracer analysis using 13C6-glucose, measuring serine/glycine and associated tracing into purine precursors AMP and GMP. For serine/glycine measurements, we combined two independent experiments comparing eight Ba/F3 RPL10 R98S WT clones with six RPL10 R98S clones. Six independent Ba/F3 RPL10 WT clones versus five RPL10 R98S clones are analyzed for AMP and GMP. g Flow cytometry analysis of de novo protein synthesis by O-propargyl-puromycin (OPP) incorporation for Rpl10 WT and R98S lin− BM cells. Results from triplicate samples from two independent mouse donors are shown and relative mean fluorescent intensity (MFI) is plotted. h Relative formate NAD(P)H levels in the bone marrow of WT and R98S mutant mice. Formate NAD(P)H levels were subtracted from background NAD(P)H levels and corrected for protein input. The box-plots include combined results of two independent experiments comparing three WT versus three R98S mutant BM CFC assay samples, derived from independent donor mice. All box-plots show the median and error bars define data distribution. Statistical analysis *p-value < 0.05, **p-value < 0.01, ***p-value < 0.001. #clone IDs of Ba/F3 and Jurkat. p-values were calculated using a two-tailed Student’s t-test. Color codes: gray indicates RPL10 WT control clones and blue indicates RPL10 R98S clones
Fig. 5
Fig. 5
T-ALL-derived circulating serine and glycine can facilitate a cell survival benefit for leukemia supporting cells. a PHGDH, PSAT1, PSPH, and SHMT2 Affymetrix MAS 5.0 mRNA expression levels obtained from the R2 AMC genomics analysis and visualization platform (Meijerink dataset). Data were extracted and re-plotted comparing normal bone marrow (green, NBM, n = 7) control samples and pediatric T-ALL samples (orange, n = 117). b Metabolite levels measured by ion exchange chromatography in plasma samples from control mice (green) and mice xenografted with the indicated T-ALL samples (orange). Metabolites are reported in μmol/L. From left to right, the boxplots represent phospho-serine, serine and glycine. X# indicates the T-ALL PDX sample ID. Control mice n = 4 and PDX mice X11 n = 5, X12 n = 5, X13 n = 5, X14 n = 2, X15 n = 5. RPL10 R98S cases are indicated in blue. c Ion exchange chromatography determined serine and glycine levels in pooled conditioned media from either RPL10 WT or R98S Ba/F3 clones (n = 2 independent biological measurements of pooled CM n = 3). Data are represented as mean ± standard deviation. d 13C6-Glucose tracing of labeled serine and glycine released in the conditioned media of six Ba/F3 RPL10 WT clones versus five R98S clones. e Glycine and serine uptake rates comparing n = 6 Ba/F3 RPL10 WT clones versus n = 5 R98S clones. f Absolute viable cell counts of parental Ba/F3 cells to which conditioned medium (CM) taken from RPL10 WT or R98S cells was added, with or without addition of 20 μM serine. g Cell culture confluency plots illustrating the survival of bone marrow stromal cells and myeloid macrophages in presence and absence of 400 μM serine or glycine. Data are represented as mean ± standard deviation. All box-plots show the median and error bars define data distribution. Statistical analysis *p-value < 0.05, **p-value < 0.01, ***p-value < 0.001. p-Values were calculated using a two-tailed Student’s t-test
Fig. 6
Fig. 6
PSPH suppression blocks the expansion potential of human T-ALL cells in vitro. a Fluorescent immunoblot analysis of PSPH protein levels in KE37, DND41, and RPMI8402 cells upon knockdown of PSPH using two independent shRNAs, with the quantification of three independent blots on the right. b Left: growth curves representing proliferation of PSPH knockdown cells over time for T-ALL cell lines KE37, DND41, and RPMI8402. Middle: Proliferation index which was calculated based on pooling of at least three individual data points from the left plot in order to quantify the effects of PSPH shRNA interference on T-ALL cell proliferation. Right: Apoptosis in PSPH knockdown cells (three averaged data points). Data are represented as mean ± standard deviation. c Immunoblot analysis of phosphorylated CDK2 at threonine 160. d Left histograms: BrdU incorporation or PI cell cycle flow cytometry analysis of representative scrambled control and PSPH knockdown T-ALL cell lines. Right: Quantification of the percentage cycling cells in cultures of scrambled, shPSPH#1, and shPSPH#2 KE37, DND41, and RPMI8402 T-ALL cells. For technical reasons, some T-ALL lines were only analyzed by either BrdU or PI cell cycle analysis, and at least in two independent experiments per sample. e Relative formate-derived NAD(P)H levels in scrambled control and PSPH knockdown T-ALL cells (combined results for KE37, RPMI8402, DND41, X12). Background NAD(P)H levels were subtracted from formate-derived NAD(P)H levels and the data were corrected for protein input. The box-plots include combined results of two independent experiments. f Flow cytometry analysis of de novo protein synthesis by O-propargyl-puromycin (OPP) incorporation. Relative protein synthesis as shown in the figure was calculated as shPSPH#1 and shPSPH#2 OPP MFI relative to scrambled control cells for KE37, RPMI8402, and DND41. All box-plots show the median and error bars define data distribution. Statistical analysis *p-value < 0.05, **p-value < 0.01, ***p-value < 0.001. p-values were calculated using a two-tailed Student’s t-test
Fig. 7
Fig. 7
PSPH suppression blocks the expansion potential of human T-ALL cells in vivo. a Left: Schematic experimental overview of the in vivo set-up to test the effects of PSPH knockdown on leukemia engraftment and progression by tail vein injection of 1*106 scrambled control, shPSPH#1, or shPSPH#2-transduced cells 24 h after initial transduction. Right: immunoblot confirmation of PSPH knockdown in the cells that were injected in the mice. b Percentage of mCherry-expressing cells in the bone marrow of leukemic mice as determined by flow cytometry. c Spleen weights of the leukemic mice at disease end stage. Data are shown as individual data points accompanied by the median and whiskers representing data distribution. d Percentage of mCherry-expressing cells in the spleen of leukemic mice as determined by flow cytometry. All box-plots show the median and error bars define data distribution. Statistical analysis: *p-value < 0.05, **p-value < 0.01, ***p-value < 0.001. p-values were calculated using a two-tailed Student’s t-test
Fig. 8
Fig. 8
Schematic overview of PSPH upregulation in T-ALL. T-ALL cells display increased PSPH expression, which is mediated by transcriptional and translational upregulation in cells with the RPL10 R98S mutation. Overexpression of PSPH promotes serine/glycine production that supports the survival of neighboring cells. Moreover, serine catabolism fuels formate production and subsequent purine synthesis that enhances proliferation of the leukemic cell itself

References

    1. Sulima SO, Hofman IJF, De Keersmaecker K, Dinman JD. How ribosomes translate cancer. Cancer Discov. 2017;7:1069–1087. doi: 10.1158/2159-8290.CD-17-0550. - DOI - PMC - PubMed
    1. Rao S, et al. Inactivation of ribosomal protein L22 promotes transformation by induction of the stemness factor, Lin28B. Blood. 2012;120:3764–3773. doi: 10.1182/blood-2012-03-415349. - DOI - PMC - PubMed
    1. Novetsky AP, et al. Frequent mutations in the RPL22 gene and its clinical and functional implications. Gynecol. Oncol. 2012;128:470–474. doi: 10.1016/j.ygyno.2012.10.026. - DOI - PMC - PubMed
    1. Hofman IJF, et al. Low frequency mutations in ribosomal proteins RPL10 and RPL5 in multiple myeloma. Haematologica. 2017;102:e317–e320. doi: 10.3324/haematol.2016.162198. - DOI - PMC - PubMed
    1. De Keersmaecker K, et al. Exome sequencing identifies mutation in CNOT3 and ribosomal genes RPL5 and RPL10 in T-cell acute lymphoblastic leukemia. Nat. Genet. 2012;45:186–190. doi: 10.1038/ng.2508. - DOI - PMC - PubMed

Publication types

MeSH terms