. 2019 Jun 11;10(1):2548.
doi: 10.1038/s41467-019-10461-0.

Integrated analysis of environmental and genetic influences on cord blood DNA methylation in new-borns

Collaborators, Affiliations

Integrated analysis of environmental and genetic influences on cord blood DNA methylation in new-borns

Darina Czamara et al. Nat Commun. .

Abstract

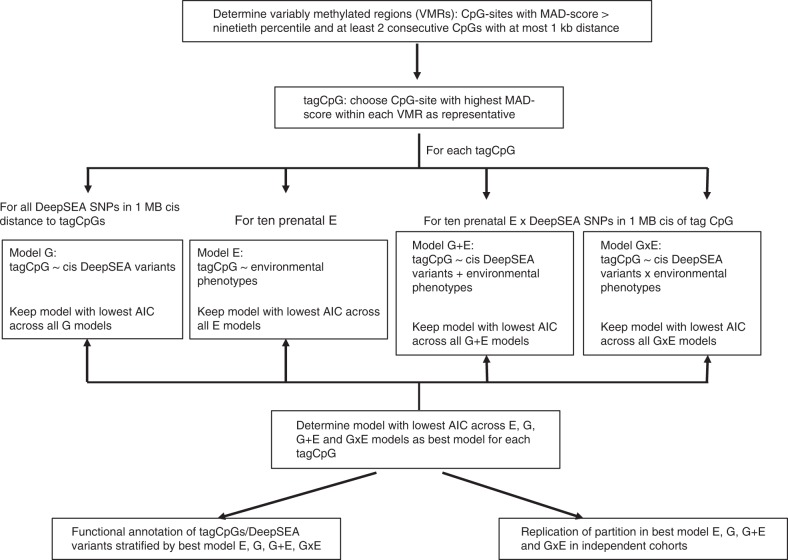
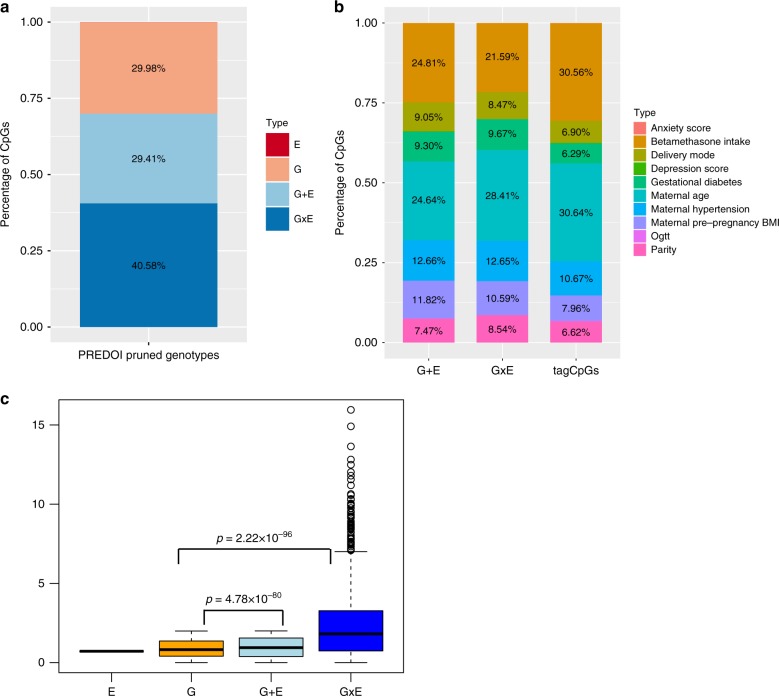
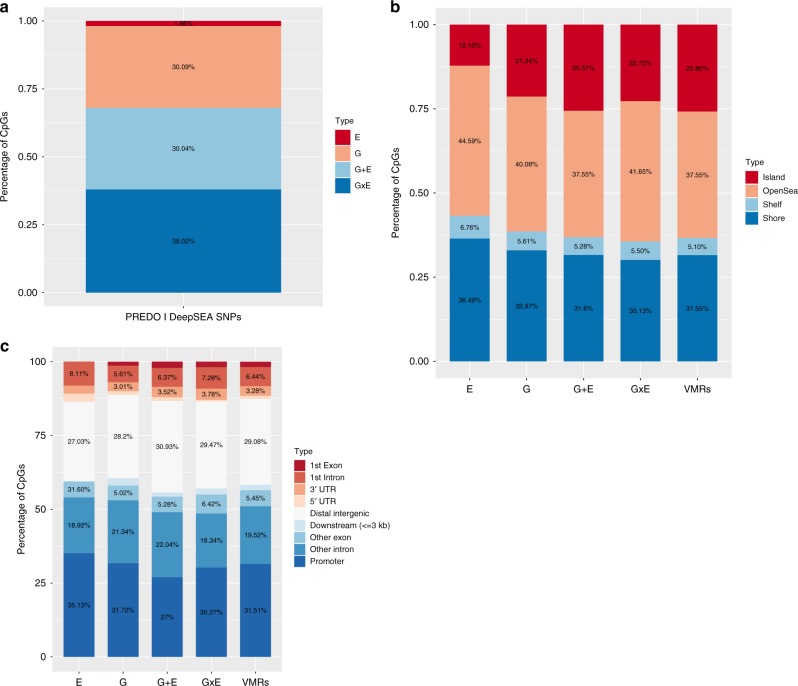
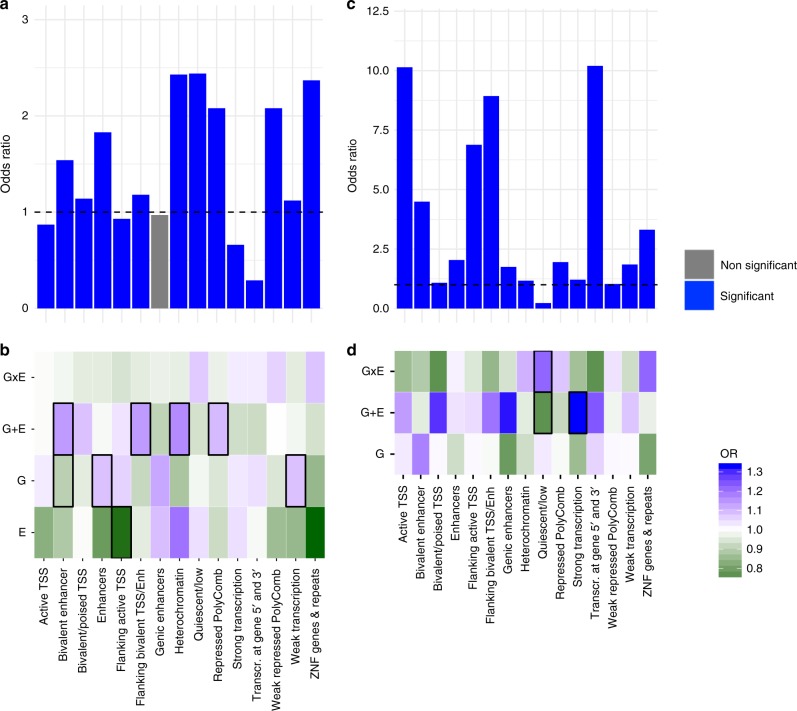
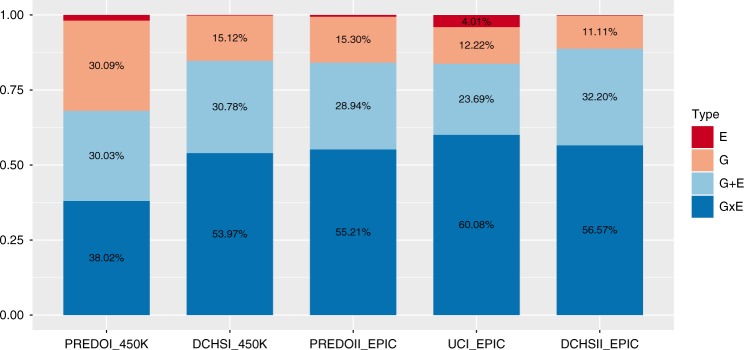
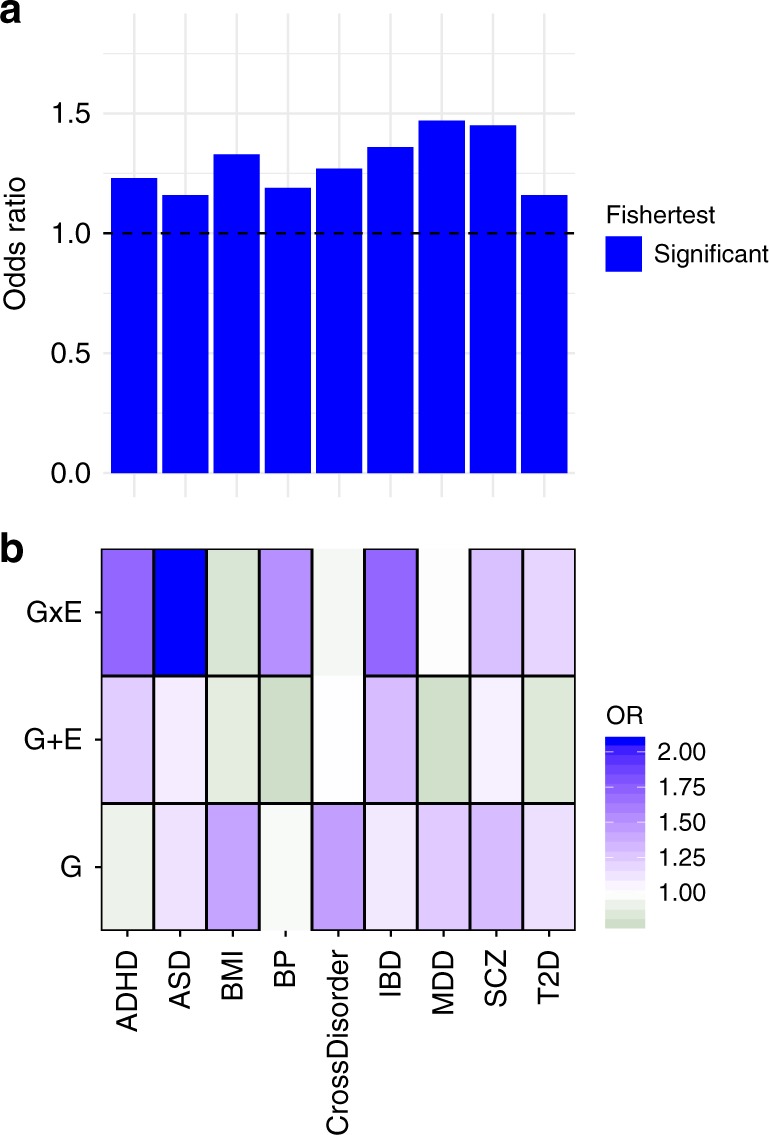
Epigenetic processes, including DNA methylation (DNAm), are among the mechanisms allowing integration of genetic and environmental factors to shape cellular function. While many studies have investigated either environmental or genetic contributions to DNAm, few have assessed their integrated effects. Here we examine the relative contributions of prenatal environmental factors and genotype on DNA methylation in neonatal blood at variably methylated regions (VMRs) in 4 independent cohorts (overall n = 2365). We use Akaike's information criterion to test which factors best explain variability of methylation in the cohort-specific VMRs: several prenatal environmental factors (E), genotypes in cis (G), or their additive (G + E) or interaction (GxE) effects. Genetic and environmental factors in combination best explain DNAm at the majority of VMRs. The CpGs best explained by either G, G + E or GxE are functionally distinct. The enrichment of genetic variants from GxE models in GWAS for complex disorders supports their importance for disease risk.


Conflict of interest statement

E.B.B. is co-inventor on the following patent applications: FKBP5: a novel target for antidepressant therapy. European Patent# EP 1687443 B1; Polymorphisms in ABCB1 associated with a lack of clinical response to medicaments. United States Patent # 8030033; Means and methods for diagnosing predisposition for treatment emergent suicidal ideation (TESI). European application number: 08016477.5 International application number: PCT/EP2009/061575. The remaining authors declare no competing interests.

Figures

Fig. 1
Fig. 1
Flow diagram of VMR analysis
Fig. 2
Fig. 2
VMR analysis in pruned PREDO I dataset. a Percentage of models (G, E, GxE or G + E) with the lowest AIC explaining variable DNA methylation using the PREDO I dataset with pruned SNPs. b Distribution of the different types of prenatal environment included in the E model with the lowest AIC (right), in the combinations yielding the best model GxE (middle), or the best model G + E models (left). To increase readability all counts <3% have been omitted. c DeltaAIC, i.e, the difference in AIC, between best model and next best model, stratified by the best model. Y-axis denotes the delta AIC and the X-axis the different models. The median is depicted by a black line, the rectangle spans the first quartile to the third quartile, whiskers above and below the box show the location of minimum and maximum beta-values. P-values are based on Wilcoxon-tests
Fig. 3
Fig. 3
VMR analysis in DeepSEA annotated SNPs in PREDO I dataset. a Percentage of models (G, E, GxE or G + E) with the lowest AIC explaining variable DNA methylation using the PREDO I dataset with DeepSEA annotated SNPs. b Distribution of the locations of all VMRs and tagVMRs with best model E, G, G + E and GxE on the 450k array using only DeepSEA variants in relationship to CpG-Islands based on the Illumina 450 K annotation. c Distribution of gene-centric locations of all VMRs and tagVMRs with best model E, G, G + E and GxE on the 450k array using only DeepSEA variants
Fig. 4
Fig. 4
Functional annotation of VMR-mapping in DeepSEA annotated SNPs in PREDO I dataset. a Histone mark enrichment for all VMRs. The Y-axis denotes the fold enrichment/depletion as compared to no-VMRs. Blue bars indicate significant enrichment/depletion, grey bars non-significant differences based on Fisher-tests. b Histone mark enrichment for tagVMRs with best model E, G, G + E and GxE relative to all VMRs. Green colour indicates depletion, red colour indicates enrichment. Thick black lines around the rectangles indicate significant enrichment/depletion based on Fisher-tests. c Histone mark enrichment for all DeepSEA variants in the dataset. Blue bars indicate significant enrichment/depletion based on Fisher-tests. d Histone mark enrichment for all DeepSEA variants involved in models where either G, G + E or GxE is the best model as compared to all tested DeepSEA variants. Green colour indicates depletion, red colour indicates enrichment. Thick black lines around the rectangles indicate significant enrichment/depletion based on Fisher-tests
Fig. 5
Fig. 5
VMR analysis in PREDO I and replication datasets. Percentage of models (G, E, GxE or G + E) with the lowest AIC explaining variable DNA methylation in PREDO I (450 K), DCHS I (450 K), PREDO II (EPIC), UCI (EPIC) and DCHS II (EPIC)
Fig. 6
Fig. 6
Consistency of best models across cohorts. Percentage of consistent best models in overlapping tag CpGs of PREDO I (450 K), DCHS I (450 K), PREDO II (EPIC), UCI (EPIC) and DCHS II (EPIC). Overlapping VMRs included significantly more CpGs as compared to all VMRs (p < 2.2 × 10−16, Wilcoxon-test, mean = 4.43)
Fig. 7
Fig. 7
Enrichment of DeepSEA variants for GWAS associations. a Enrichment for nominal significant GWAS associations for all tested DeepSEA variants and their LD proxies for GWAS for ADHD (attention-deficit hyperactivity disorder), ASD (autism spectrum disorder), BMI (body mass index), BP (bipolar disorder), CrossDisorder, IBD (inflammatory bowel disease), MDD (major depressive disorder), SCZ (schizophrenia) and T2D (Type 2 diabetes). The Y-axis denotes the fold enrichment with regard to non-DeepSEAvariants. Blue bars indicate significant enrichment/depletion based on Fisher-tests. b Enrichment for nominal significant GWAS hits for DeepSEA variants and their LD proxies involved in best models with G, G + E or GxE as compared to all tested DeepSEA variants. Green colour indicates depletion, red colour indicates enrichment. Thick black lines around the rectangles indicate significant enrichment/depletion based on Fisher-tests

Similar articles

Cited by

References

    1. Roseboom T, de Rooij S, Painter R. The Dutch famine and its long-term consequences for adult health. Early Hum. Dev. 2006;82:485–491. doi: 10.1016/j.earlhumdev.2006.07.001. - DOI - PubMed
    1. Barker DJ, Osmond C, Forsen TJ, Kajantie E, Eriksson JG. Trajectories of growth among children who have coronary events as adults. N. Engl. J. Med. 2005;353:1802–1809. doi: 10.1056/NEJMoa044160. - DOI - PubMed
    1. Hovi P, et al. Glucose regulation in young adults with very low birth weight. N. Engl. J. Med. 2007;356:2053–2063. doi: 10.1056/NEJMoa067187. - DOI - PubMed
    1. Hillier TA, et al. Childhood obesity and metabolic imprinting: the ongoing effects of maternal hyperglycemia. Diabetes Care. 2007;30:2287–2292. doi: 10.2337/dc06-2361. - DOI - PubMed
    1. Dancause KN, et al. Prenatal stress due to a natural disaster predicts adiposity in childhood: the Iowa Flood Study. J. Obes. 2015;2015:570541. doi: 10.1155/2015/570541. - DOI - PMC - PubMed

Publication types