. 2019 Jun 11;9(1):8449.
doi: 10.1038/s41598-019-44777-0.

A Versatile, Portable Intravital Microscopy Platform for Studying Beta-cell Biology In Vivo

Affiliations

A Versatile, Portable Intravital Microscopy Platform for Studying Beta-cell Biology In Vivo

Christopher A Reissaus et al. Sci Rep. .

Abstract

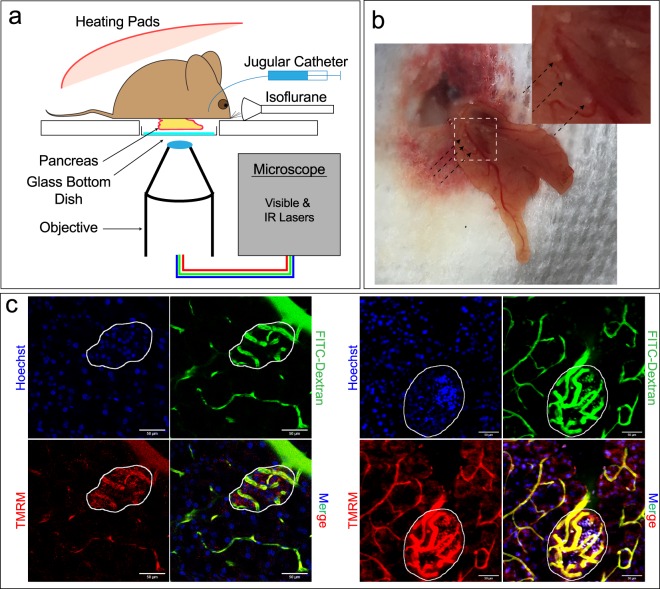
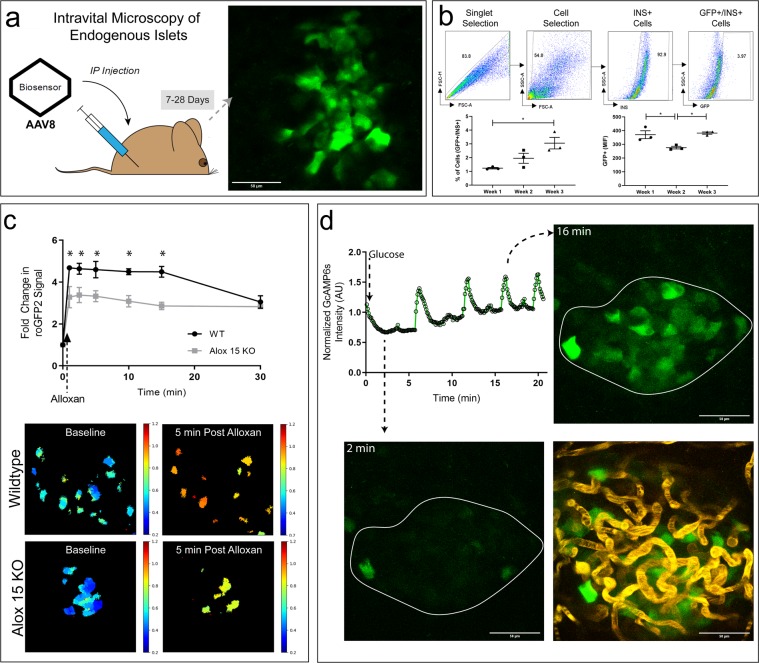
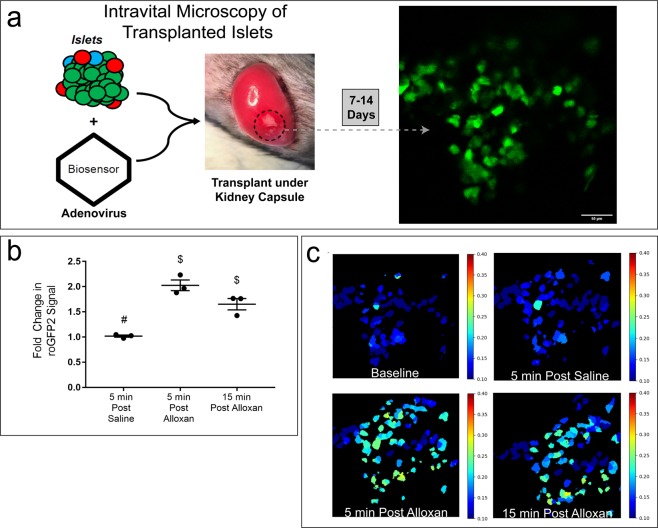
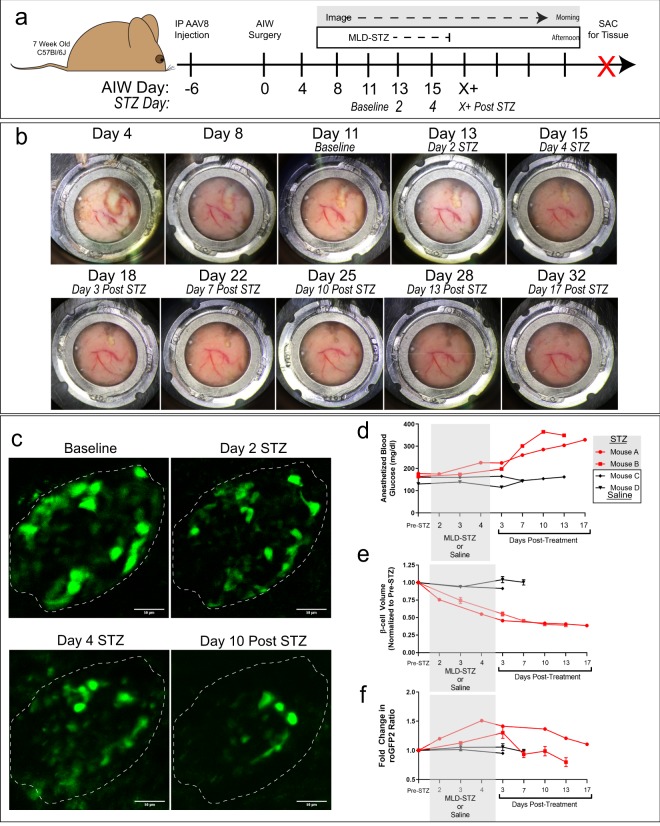
The pancreatic islet is a complex micro-organ containing numerous cell types, including endocrine, immune, and endothelial cells. The communication of these systems is lost upon isolation of the islets, and therefore the pathogenesis of diabetes can only be fully understood by studying this organized, multicellular environment in vivo. We have developed several adaptable tools to create a versatile platform to interrogate β-cell function in vivo. Specifically, we developed β-cell-selective virally-encoded fluorescent protein biosensors that can be rapidly and easily introduced into any mouse. We then coupled the use of these biosensors with intravital microscopy, a powerful tool that can be used to collect cellular and subcellular data from living tissues. Together, these approaches allowed the observation of in vivo β-cell-specific ROS dynamics using the Grx1-roGFP2 biosensor and calcium signaling using the GcAMP6s biosensor. Next, we utilized abdominal imaging windows (AIW) to extend our in vivo observations beyond single-point terminal measurements to collect longitudinal physiological and biosensor data through repeated imaging of the same mice over time. This platform represents a significant advancement in our ability to study β-cell structure and signaling in vivo, and its portability for use in virtually any mouse model will enable meaningful studies of β-cell physiology in the endogenous islet niche.


Conflict of interest statement

The authors declare no competing interests.

Figures

Figure 1
Figure 1
Intravital Microscopy of Endogenous Islets. (a) Schematic depiction of the setup for intravital microscopy of the mouse pancreas. (b) Widefield view of the pancreas, as seen through a coverslip-bottomed dish. The islets within the pancreas are highlighted by black arrows. (c) Mice were injected with Hoechst (blue) to label nuclei, a 150 k Da FITC-conjugated dextran (green) to label vasculature, and TMRM (TMRM) to label mitochondria. Both a single plane image (left) and a projection of a 3D image volume (right) collected from the pancreas shows the increased nuclei count, vascularity, and mitochondrial activity of islets (outlined in white) compared to surrounding exocrine tissue.
Figure 2
Figure 2
AAV8 Expression of Fluorescent Protein Biosensors as a Flexible Tool for Studying β-Cell Biology in the Pancreas in vivo. (a) Schematic depiction of pancreas IVM using AAV8 to label islets in vivo. Virus is injected IP 7–28 days prior to IVM. A representative projected image volume collected from the pancreas of a mouse 3 weeks after IP injection of AAV8-Grx1-roGFP2 is shown. (b) Dispersed cells from islets expressing the Grx1-roGFP2 biosensor were stained with anti-insulin and GFP+ INS+ population was evaluated by flow cytometry. Gating strategy (top) and quantification (bottom) of GFP+ INS+ cells are shown. N = 3. Data presented as mean +/− SEM (*p-value < 0.05). (c) Top: Fold change over baseline in Grx1-roGFP2 ratio from β-cells in vivo in the pancreata of WT (black) and Alox15−/− (grey) mice over 30 minutes post IV injection of alloxan. Bottom: Representative ratiometric images of Grx1-roGPF2 changes in β-cells of WT and Alox15−/− mice within the endogenous pancreas at 5 minutes after IV injection of 85 mg/kg alloxan monohydrate. Data are means ± SEM (N = 3, p < 0.05). (d) Top left: GcAMP6s intensity measures collected in vivo from an entire islet (white outline) over time after a 1 g/kg IP glucose bolus. Representative images of low and high GcAMP6s intensity are shown. Bottom right: A 70 k Da Texas red dextran was administered IV to label the vasculature of the islet.
Figure 3
Figure 3
Adenovirus Expression of Fluorescent Protein Biosensors in Islets Transplanted under the Mouse Kidney Capsule. (a) Top left: Schematic depiction of IVM of biosensor-labelled isolated primary mouse islets transplanted under the mouse kidney capsule after adenoviral transduction in vitro. Right: Representative image of an islet graft under the kidney capsule labeled with Grx1-roGFP2. (b) Fold change over baseline in β-cell-specific Grx1-roGFP2 from 3 mice, 5 minutes after IV saline injection, and 5 and 15 minutes after IV injection of 80 mg/kg alloxan monohydrate. Pairwise t-tests were calculated for each time point between groups. Data are means ± SEM (N = 3, *p < 0.05). (c) Representative 405/488 ratiometric images of Grx1-roGPF2 changes in β-cells within the islet transplant under the kidney capsule at baseline, 5 minutes after IV saline injection, and 5 and 15 minutes after IV injection of 80 mg/kg alloxan monohydrate.
Figure 4
Figure 4
Longitudinal intravital studies of β-cell biology using an abdominal imaging window. (a) Schematic of AAV8-INS-Grx1-roGFP2, abdominal imaging window (AIW), and multi-low-dose streptozotocin (MLD-STZ; 55 mg/kg/day) experiment. Intraperitoneal injection of AAV8-packaged biosensor occurred 6 days prior to AIW surgery (day 0). Baseline images were collected in the morning of day 11 and STZ started in the afternoon of day 11. STZ continued for 5 days while imaging continued until the window integrity was compromised at Day 32. The pancreas was recovered and fixed for endpoint analyses. (b) Representative widefield images of the pancreas as seen through the AIW over time. Above each image are both the number of days post AIW implantation and the time point of the STZ challenge. (c) Representative projected images of the Grx1-roGFP2-labeled β-cell volume at baseline (Day 11), day 2 of STZ, day 4 of STZ, and day 10 post-STZ. The white dotted line indicates the perimeter of the Grx1-roGFP2-labeled islet volume at baseline. (d) Blood glucose readings collected 30 minutes after the start of anesthesia for each imaging session for STZ (red) and saline (black) treated mice. (e) Islet volume calculated for STZ (red) and saline (black) treated mice before, during, and after MLD-STZ challenge. (f) Grx1-roGFP2 ratiometric data collected from labeled β-cells using 800/900 nm 2-photon excitation before, during, and after in STZ (red) and saline (black) treated mice. For e and f, while the single line is representative of a mouse, 1–4 islets were imaged per mouse.

References

    1. Atkinson MA, Herrath M, von, Powers AC, Clare-Salzler M. Current Concepts on the Pathogenesis of Type 1 Diabetes—Considerations for Attempts to Prevent and Reverse the Disease. Diabetes Care. 2015;38:979–988. doi: 10.2337/dc15-0144. - DOI - PMC - PubMed
    1. Skyler JS, et al. Differentiation of Diabetes by Pathophysiology, Natural History, and Prognosis. Diabetes. 2017;66:241–255. doi: 10.2337/db16-0806. - DOI - PMC - PubMed
    1. Coppieters K, Amirian N, von Herrath M. Intravital imaging of CTLs killing islet cells in diabetic mice. J. Clin. Invest. 2012;122:119–131. doi: 10.1172/JCI59285. - DOI - PMC - PubMed
    1. Christoffersson, G. & von Herrath, M. G. A Deeper Look into Type 1 Diabetes – Imaging Immune Responses during Onset of Disease. Front. Immunol. 7 (2016). - PMC - PubMed
    1. Mohan JF, et al. Imaging the emergence and natural progression of spontaneous autoimmune diabetes. Proc. Natl. Acad. Sci. 2017;114:E7776–E7785. doi: 10.1073/pnas.1707381114. - DOI - PMC - PubMed

Publication types

MeSH terms