Coupling epidemiological and tree growth models to control fungal diseases spread in fruit orchards
- PMID: 31186487
- PMCID: PMC6560096
- DOI: 10.1038/s41598-019-44898-6
Coupling epidemiological and tree growth models to control fungal diseases spread in fruit orchards
Abstract
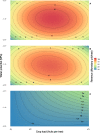
Agronomic practices can alter plant susceptibility to diseases and represent a promising alternative to the use of pesticides. Yet, they also alter crop quality and quantity so that the evaluation of their efficacy is not straightforward. Here we couple a compartmental epidemiological model for brown rot diffusion in fruit orchards with a fruit-tree growth model explicitly considering the role of agronomic practices over fruit quality. The new modelling framework permits us to evaluate, in terms of quantity and quality of the fruit production, management scenarios characterized by different levels of regulated deficit irrigation and crop load. Our results suggest that a moderate water stress in the final weeks of fruit development and a moderate fruit load provide effective control on the brown rot spreading, and eventually guarantee monetary returns similar to those that would be obtained in the absence of the disease.
Conflict of interest statement
The authors declare no competing interests.
Figures


Similar articles
-
A Model for Temporal Dynamics of Brown Rot Spreading in Fruit Orchards.Phytopathology. 2018 May;108(5):595-601. doi: 10.1094/PHYTO-07-17-0250-R. Epub 2018 Mar 19. Phytopathology. 2018. PMID: 29182471
-
Quantitative relationships between different injury factors and development of brown rot caused by Monilinia fructigena in integrated and organic apple orchards.Phytopathology. 2008 Jan;98(1):79-86. doi: 10.1094/PHYTO-98-1-0079. Phytopathology. 2008. PMID: 18943241
-
INCIDENCE AND SEVERITY OF LEAF AND FRUIT DISEASES OF PLUMS IN LATVIA.Commun Agric Appl Biol Sci. 2015;80(3):421-33. Commun Agric Appl Biol Sci. 2015. PMID: 27141740
-
Brown Rot Strikes Prunus Fruit: An Ancient Fight Almost Always Lost.J Agric Food Chem. 2016 May 25;64(20):4029-47. doi: 10.1021/acs.jafc.6b00104. Epub 2016 May 10. J Agric Food Chem. 2016. PMID: 27133976 Review.
-
Fungal and Oomycete Diseases of Tropical Tree Fruit Crops.Annu Rev Phytopathol. 2016 Aug 4;54:373-95. doi: 10.1146/annurev-phyto-080615-095944. Annu Rev Phytopathol. 2016. PMID: 27491435 Review.
References
Publication types
MeSH terms
LinkOut - more resources
Full Text Sources
Medical

