. 2019 Jun 11;9(1):8455.
doi: 10.1038/s41598-019-44905-w.

A special three-layer step-index fiber for building compact STED systems

Affiliations

A special three-layer step-index fiber for building compact STED systems

Hao Luo et al. Sci Rep. .

Erratum in

Abstract

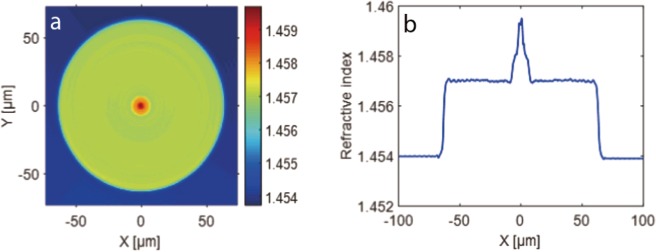
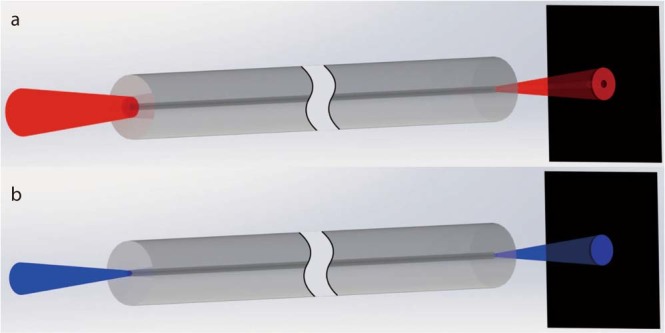
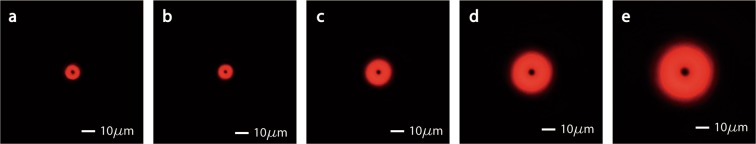
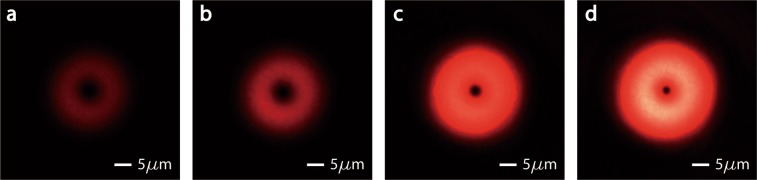
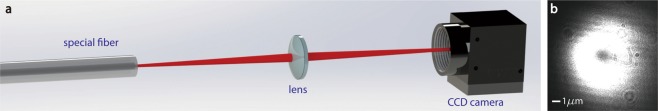
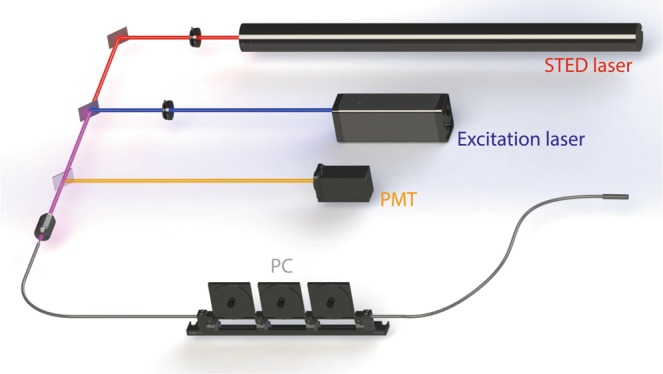
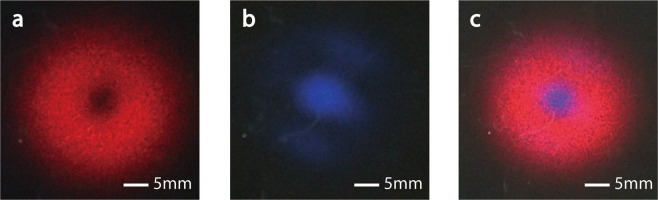
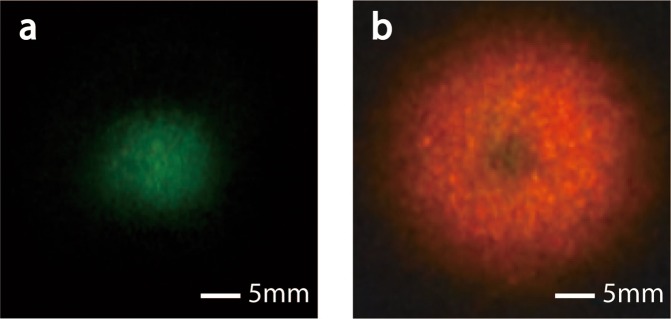
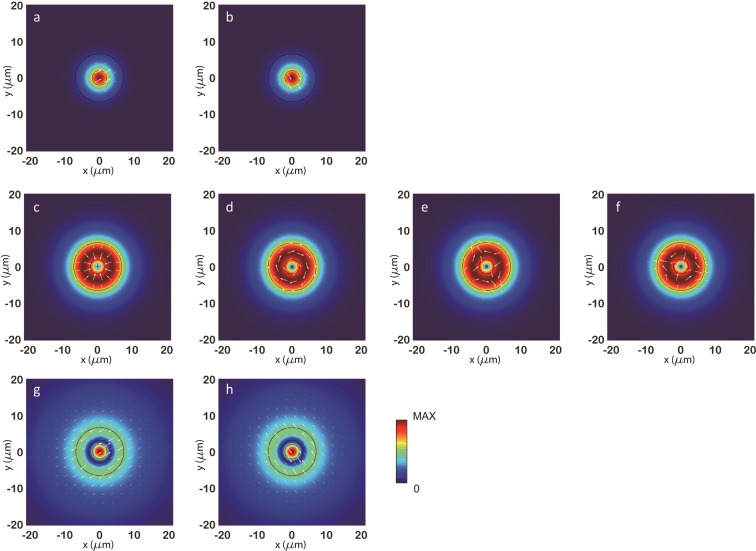
Up to now, most of stimulated-emission-depletion (STED) systems were lens-based bulky systems. Exchanging some spatial light paths with optical fiber components will make the systems more flexible and will benefit various fields. A big problem to achieve this goal is that the STED beam generated by the traditional method of bulky systems cannot be maintained in an optical fiber due to its birefringence. In this article, we will introduce a type of special optical fiber. With the special fiber, a dark hollow beam with doughnut-shaped focal spot and a concentric beam with Gaussian-shaped focal spot can be generated at the same time. Parameters of a sample and a compact STED system based on it are demonstrated.


Conflict of interest statement

The authors declare no competing interests.

Figures

Figure 1
Figure 1
Refractive index of the special fiber. (a) Measured refractive index distribution on the cross-section of fiber. (b) The data along a diameter of (a).
Figure 2
Figure 2
Output characteristic of the special fiber. (a) When a Gaussian-shaped laser beam at the wavelength of 633 nm is input into this fiber, whose focal spot can cover the inner-cladding of fiber, the output is a dark hollow beam. (b) When a laser beam at the wavelength of 475 nm is input into this fiber, whose focal spot can only cover the core of fiber, the output is a Gaussian beam.
Figure 3
Figure 3
Optical power distributions on the cross-section of generated dark hollow beam at different distances from output-end of the special fiber. (a) Is the optical power distribution just at the fiber output-end. From (b) to (e), the distance between fiber output-end and the visual plane increased from 100 μm to 400 μm, with a step of 100 mm.
Figure 4
Figure 4
Optical power distribution on the cross-section varies with incident power. The photos are taken at a plane 260 μm away from the output-end of special fiber. From (a) to (d), we increased the input power gradually. As the power increasing, the ring became brighter and wider, and the dark center became smaller. The size of dark center can be infinitely small theoretically.
Figure 5
Figure 5
Optical power distribution on a cross-section (not focal plane) of the focused beam. (a) Shows a schematic diagram of the setup: the output light beam of special fiber was focused by a lens and then captured by a CCD camera. (b) Is a photo taken by CCD camera. It indicated the output light beam can maintain a decent doughnut-shaped cross-section when focused by lens.
Figure 6
Figure 6
Experimental setup. Excitation laser is a CW laser at the wavelength of 475 nm. STED laser is a CW laser at the wavelength of 633 nm. PMT: Photomultiplier tube. PC: fiber polarization controller. Two diaphragms were used to adjust the size of incident focal spot. A fiber polarization controller was settled in the system to improve the quality of STED focal spot.
Figure 7
Figure 7
The far-field output patterns of the compact STED system. (a) Only 633 nm laser is input. (b) Only 475 nm laser is input. (c) Lasers at the two wavelengths are input together. In the three photos are projections of output light on a far-field screen.
Figure 8
Figure 8
The output pattern of the special fiber projected on a screen: (a) only 532 nm laser is input; (b) lasers at the wavelengths of 532 nm and 633 nm are input together.
Figure 9
Figure 9
Mode system of the special fiber with incident wavelength of 633 nm. These simulation results are based on Finite Element Method. Three classes of guided modes in core and inner-cladding were obtained. The white arrows show the direction of electric field. (a,b) Are two degenerated modes with the effective refractive index of 1.4582. (cf) Are four degenerated modes with the effective refractive index of 1.4574. (g,h) Are two degenerated modes with the effective refractive index of 1.4571.
Figure 10
Figure 10
Simulation result showing the power-coupling phenomenon in the special fiber. The simulation result is based on Beam Propagation Method. Simulation is under such conditions: incident light beam is Gaussian beam at the wavelength of 633 nm; the beam is concentric with and perpendicular to the input-end of fiber; the diameter of the beam is 40 μm.
Figure 11
Figure 11
Variation tendency of optical power distribution on the output-end corresponding to the diameter of incident focal spot on the input-end of fiber: Green curve shows the distance between the center of fiber and the points with half max power (if the power distribution has a doughnut, choose the points on the outer ring). Red curve shows the distance between the center of fiber and the point(s) with max power. If the power distribution is doughnut-shaped, blue curve shows the distance between the center of fiber and the points with half max power on the inner ring. The pictures under the chart are simulated power distributions when diameter of incident focal spot varies from 5 μm to 55 μm, by a step of 5 μm.

Similar articles

References

    1. Hell SW, Wichmann J. Breaking the diffraction resolution limit by stimulated emission: stimulated-emission-depletion fluorescence microscopy. Optics Letters. 1994;19:780–782. doi: 10.1364/OL.19.000780. - DOI - PubMed
    1. Klar TA, Engel E, Hell SW. Breaking Abbe’s diffraction resolution limit in fluorescence microscopy with stimulated emission depletion beams of various shapes. Physical Review E Statistical Nonlinear & Soft Matter Physics. 2001;64:066613. doi: 10.1103/PhysRevE.64.066613. - DOI - PubMed
    1. Kuang C, Zhao W, Wang G. Far-field optical nanoscopy based on continuous wave laser stimulated emission depletion. Rev Sci Instrum. 2010;81:053709. doi: 10.1063/1.3432001. - DOI - PubMed
    1. Farahani, J. N., Schibler, M. J. & Bentolila, L. A. Stimulated Emission Depletion (STED) Microscopy: from Theory to Practice. Microscopy Science (2010).
    1. Nienhaus K, Nienhaus GU. Where Do We Stand with Super-Resolution Optical Microscopy? J Mol Biol. 2016;428:308–322. doi: 10.1016/j.jmb.2015.12.020. - DOI - PubMed