

Analytical Exploration of Potential Pathways by which Diabetes Mellitus Impacts Tuberculosis Epidemiology
- PMID: 31186499
- PMCID: PMC6560095
- DOI: 10.1038/s41598-019-44916-7
Analytical Exploration of Potential Pathways by which Diabetes Mellitus Impacts Tuberculosis Epidemiology
Abstract
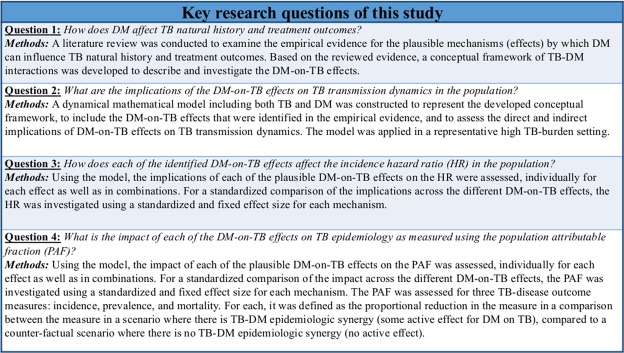
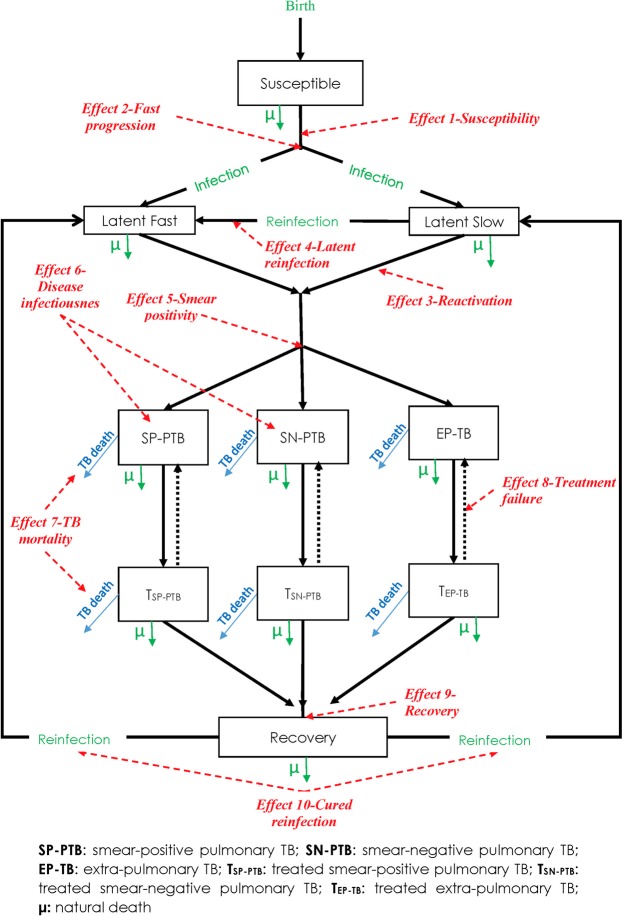
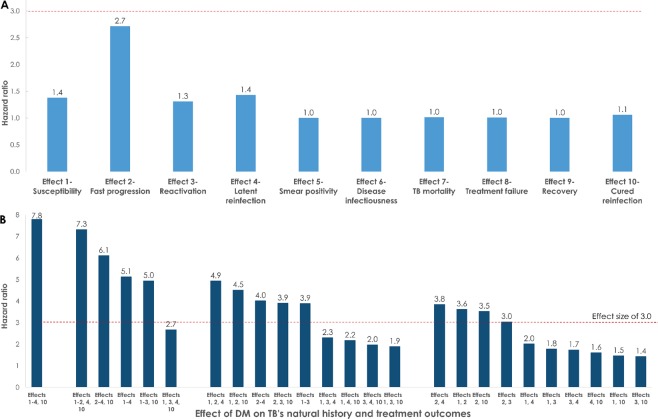
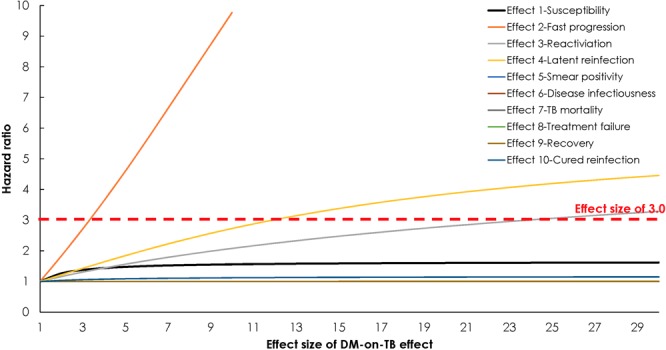
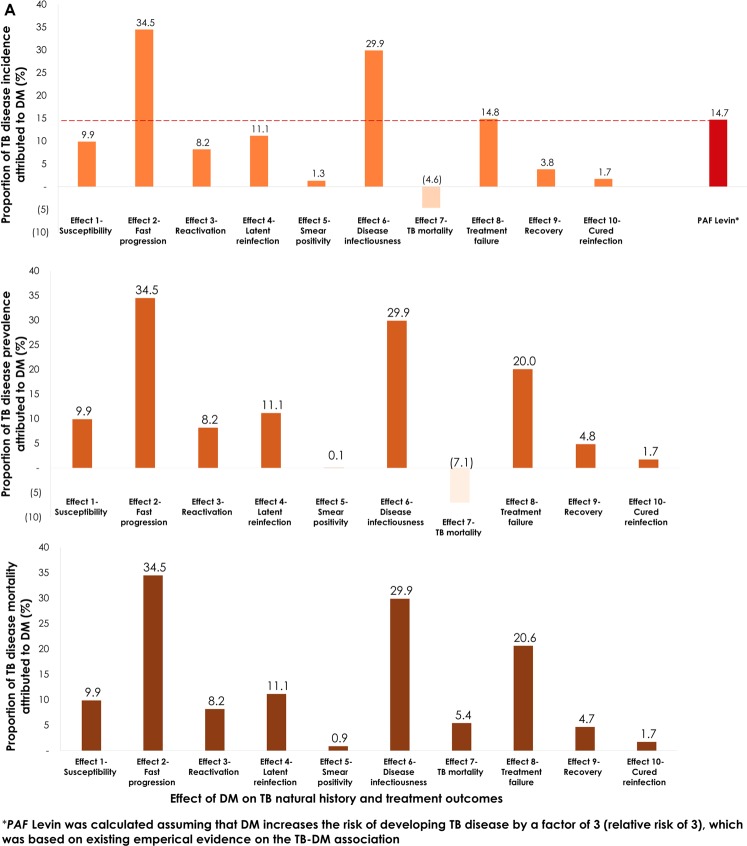
We aimed to develop a conceptual framework of diabetes mellitus (DM) effects on tuberculosis (TB) natural history and treatment outcomes, and to assess the impact of these effects on TB-transmission dynamics. The model was calibrated using TB data for India. A conceptual framework was developed based on a literature review, and then translated into a mathematical model to assess the impact of the DM-on-TB effects. The impact was analyzed using TB-disease incidence hazard ratio (HR) and population attributable fraction (PAF) measures. Evidence was identified for 10 plausible DM-on-TB effects. Assuming a flat change of 300% (meaning an effect size of 3.0) for each DM-on-TB effect, the HR ranged between 1.0 (Effect 9-Recovery) and 2.7 (Effect 2-Fast progression); most effects did not have an impact on the HR. Meanwhile, TB-disease incidence attributed directly and indirectly to each effect ranged between -4.6% (Effect 7-TB mortality) and 34.5% (Effect 2-Fast progression). The second largest impact was for Effect 6-Disease infectiousness at 29.9%. In conclusion, DM can affect TB-transmission dynamics in multiple ways, most of which are poorly characterized and difficult to assess in epidemiologic studies. The indirect (e.g. onward transmission) impacts of some DM-on-TB effects are comparable in scale to the direct impacts. While the impact of several effects on the HR was limited, the impact on the PAF was substantial suggesting that DM could be impacting TB epidemiology to a larger extent than previously thought.
Conflict of interest statement
The authors declare no competing interests.
Figures
References
-
- World Health Organization. Global tuberculosis report 2018 (Available from, http://apps.who.int/iris/bitstream/handle/10665/274453/9789241565646-eng..., accessed Sept. 2018) (2018).
-
- World Health Organization. Global tuberculosis report 2016 (Available from, http://apps.who.int/iris/bitstream/10665/250441/1/9789241565394-eng.pdf?..., accessed on May 2017) (2016).
-
- World Health Organization. Draft global strategy and targets for tuberculosis prevention, care and control after 2015 (Available at, http://apps.who.int/gb/ebwha/pdf_files/WHA67/A67_11-en.pdf?ua=1) (March 2014).
Publication types
MeSH terms
LinkOut - more resources
Full Text Sources
Medical
