. 2019 Jun 11;9(1):8469.
doi: 10.1038/s41598-019-44923-8.

Mass spectra alignment using virtual lock-masses

Affiliations

Mass spectra alignment using virtual lock-masses

Francis Brochu et al. Sci Rep. .

Abstract

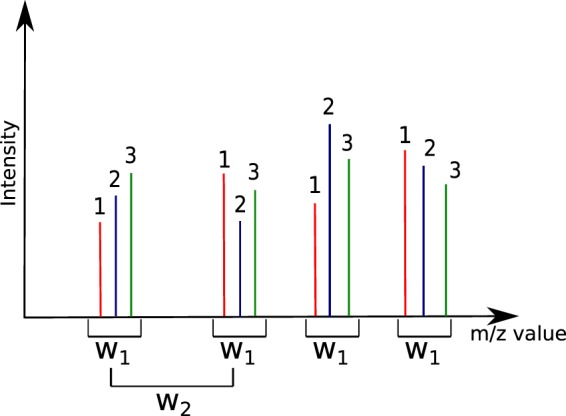
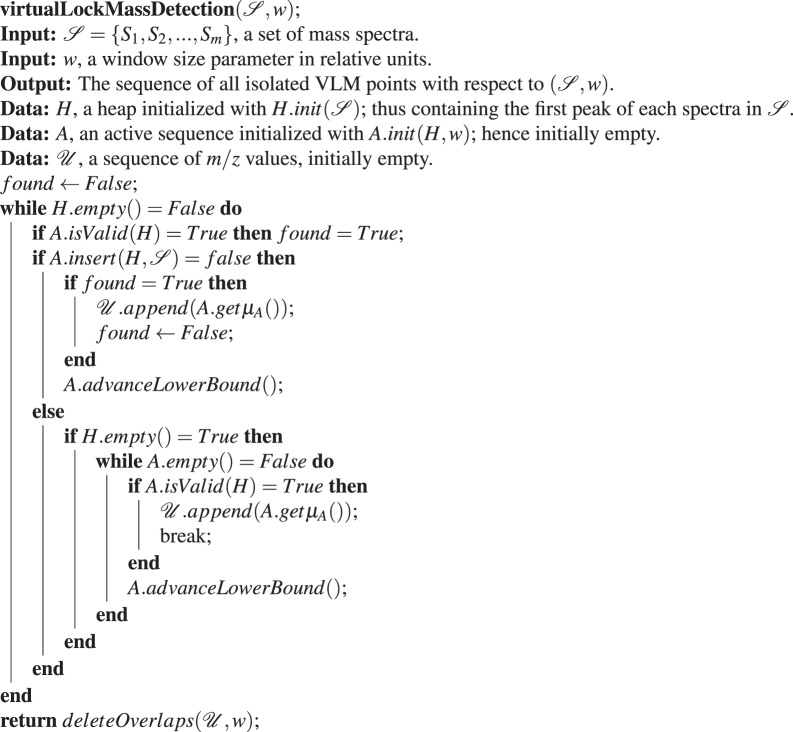
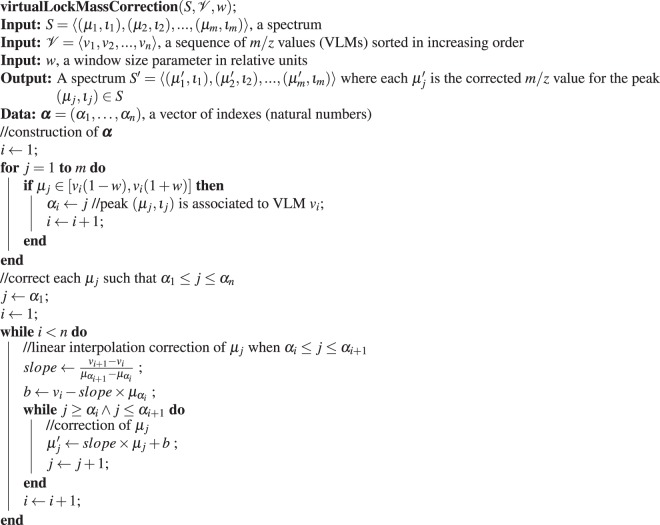
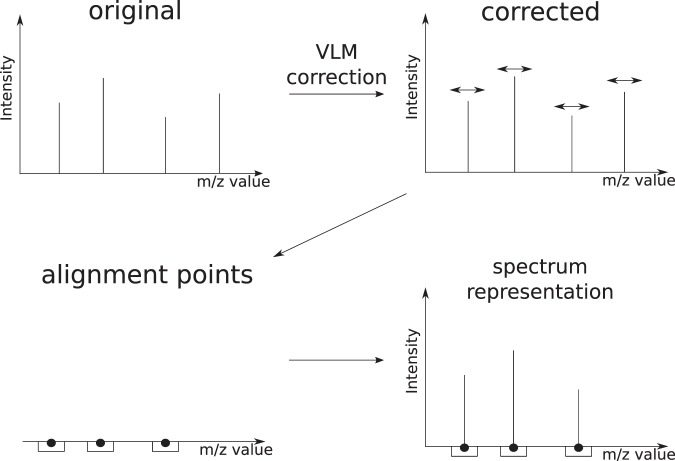
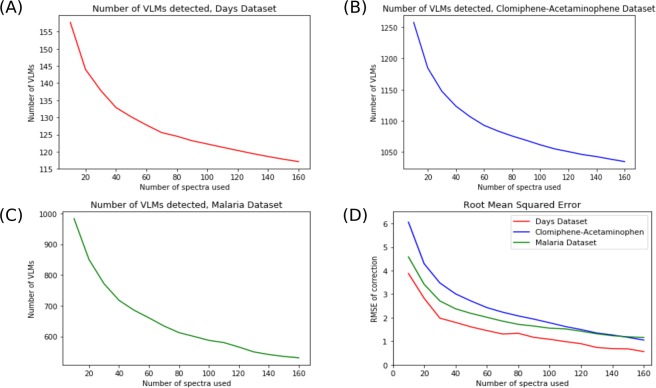
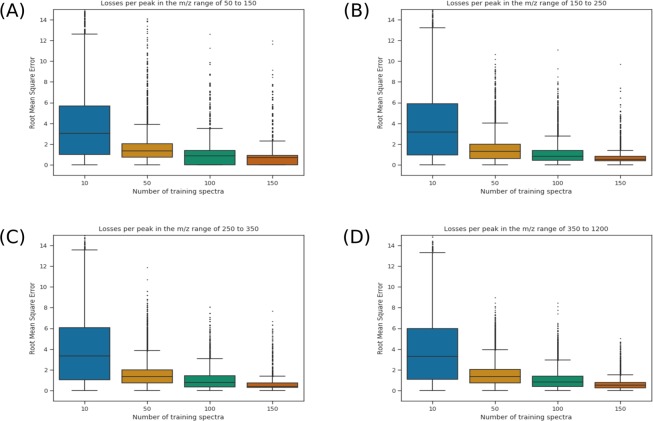
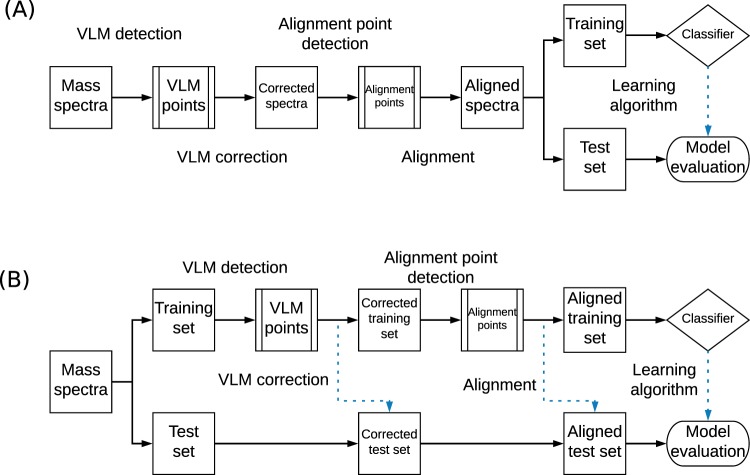
Mass spectrometry is a valued method to evaluate the metabolomics content of a biological sample. The recent advent of rapid ionization technologies such as Laser Diode Thermal Desorption (LDTD) and Direct Analysis in Real Time (DART) has rendered high-throughput mass spectrometry possible. It is used for large-scale comparative analysis of populations of samples. In practice, many factors resulting from the environment, the protocol, and even the instrument itself, can lead to minor discrepancies between spectra, rendering automated comparative analysis difficult. In this work, a sequence/pipeline of algorithms to correct variations between spectra is proposed. The algorithms correct multiple spectra by identifying peaks that are common to all and, from those, computes a spectrum-specific correction. We show that these algorithms increase comparability within large datasets of spectra, facilitating comparative analysis, such as machine learning.


Conflict of interest statement

The authors declare no competing interests.

Figures

Figure 1
Figure 1
Definition of window size for the detection of VLM peaks. The peaks identified as 1, 2, and 3 are presumed to originate from three different spectra. Window size w1 correctly detects four VLM groups. Window size w2 however is too wide and will detect ambiguous and erroneous groups. Moreover, w2 will detect several overlapping VLM groups.
Algorithm 1
Algorithm 1
The Virtual Lock Mass Detection Algorithm.
Algorithm 2
Algorithm 2
Virtual Lock Mass Correction Algorithm.
Figure 2
Figure 2
Error in ppm versus mass units. Subfigure (A) shows the error on left-out VLMs in ppms, while Subfigure (B) shows the error in Daltons. This data was acquired on the Days Dataset.
Figure 3
Figure 3
Workflow of the VLM and alignment algorithms. First, VLM points are detected in the original spectra in the dataset and VLM correction is applied. The alignment algorithm is then applied to the corrected spectra in order to obtain the alignment points. The representation of a given spectrum is the subset of peaks which fall within a mass window of an alignment point, with unmodified intensity.
Figure 4
Figure 4
Learning Curves of Virtual Lock Mass Detection and Correction. Subfigures (AC) show the learning curves for three different datasets ((A) Days, (B) Clomiphene-Acetaminophen and (C) Malaria). Subfigure (D) shows the Root Mean Square Error (RMSE) of VLM Correction for these datasets on an unseen test set. This test set consisted of 25 randomly selected samples from the datasets, which were kept separate. The experiments were replicated 50 times and averaged.
Figure 5
Figure 5
Loss per peak in different m/z ranges of the spectra. Each boxplot represents the RMSE of the peaks in a given region (50–150 in (A), 150–250 in (B), 250–350 in (C) and greater than 350 in (D)). Shown here are the results for the Days Dataset, in increasing order to training spectra, from 10 to 150. The outliers are shown as ticks over each box.
Figure 6
Figure 6
Transductive and inductive workflows. (A) The transductive workflow, in which all spectra are corrected at once, prior to partitioning the data into a training and testing set. (B) The inductive workflow, where the data are first partitioned and only the spectra in the training set are used to learn a transformation that is applied to all spectra. The dotted blue arrows show where the algorithms were applied on unseen data, while the whole black arrows show the workflow of the training data. Thus, in the inductive workflow, the test set is formed of unseen data that is only used for the final evaluation of the model. In the transductive case, some information is taken from all samples, while only the learning part of the workflow separating a test set on which the algorithm does not learn.

References

    1. Dettmer K, Aronov PA, Hammock BD. Mass spectrometry-based metabolomics. Mass spectrometry reviews. 2007;26:51–78. doi: 10.1002/mas.20108. - DOI - PMC - PubMed
    1. Han X, Aslanian A, Yates JR., III Mass spectrometry for proteomics. Curr. opinion chemical biology. 2008;12:483–490. doi: 10.1016/j.cbpa.2008.07.024. - DOI - PMC - PubMed
    1. Fenselau C, Demirev PA. Characterization of intact microorganisms by maldi mass spectrometry. Mass spectrometry reviews. 2001;20:157–171. doi: 10.1002/mas.10004. - DOI - PubMed
    1. Caprioli RM, Farmer TB, Gile J. Molecular imaging of biological samples: localization of peptides and proteins using maldi-tof ms. Anal. chemistry. 1997;69:4751–4760. doi: 10.1021/ac970888i. - DOI - PubMed
    1. Cox J, Mann M. Quantitative, high-resolution proteomics for data-driven systems biology. Annu. review biochemistry. 2011;80:273–299. doi: 10.1146/annurev-biochem-061308-093216. - DOI - PubMed

Publication types

Grants and funding