. 2019 Jun 12:8:e47613.
doi: 10.7554/eLife.47613.

A counter gradient of Activin A and follistatin instructs the timing of hair cell differentiation in the murine cochlea

Affiliations

A counter gradient of Activin A and follistatin instructs the timing of hair cell differentiation in the murine cochlea

Meenakshi Prajapati-DiNubila et al. Elife. .

Abstract

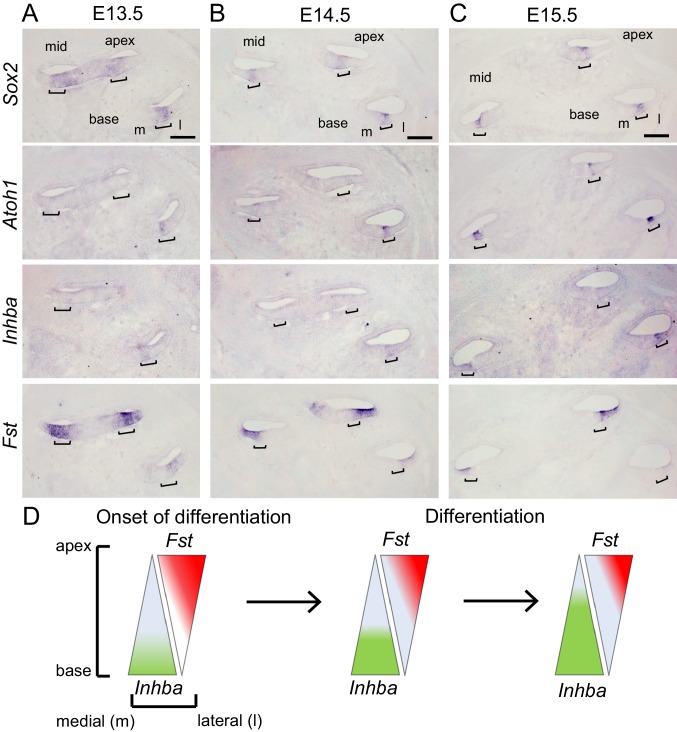
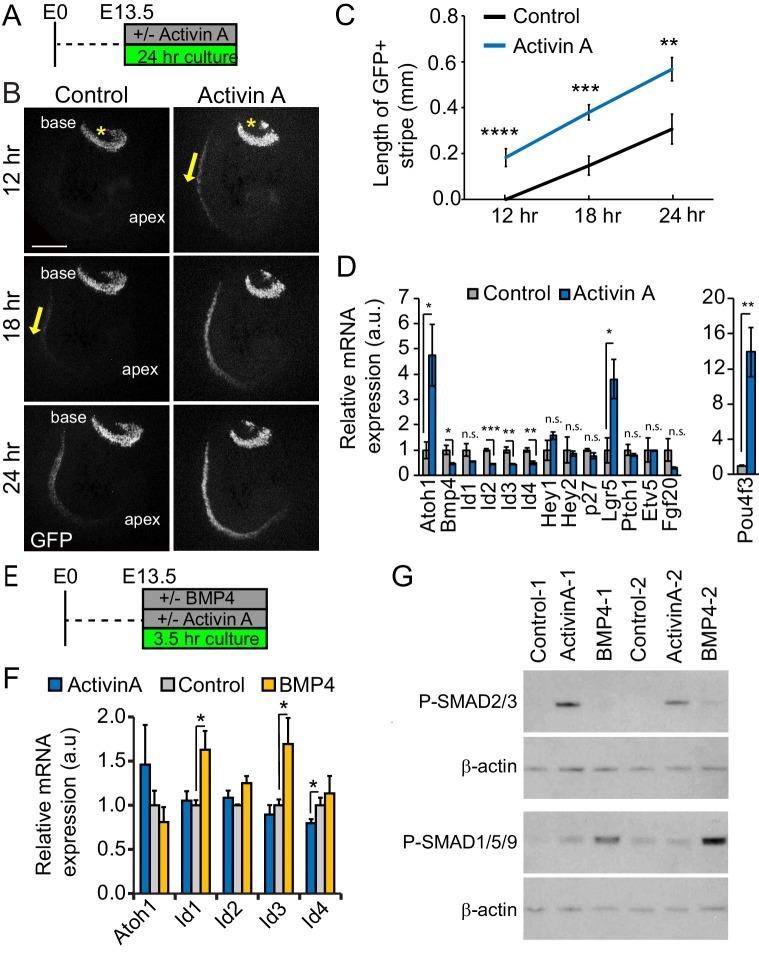
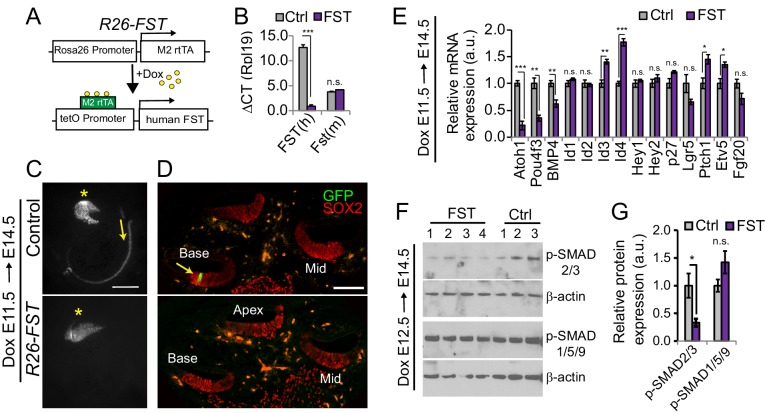
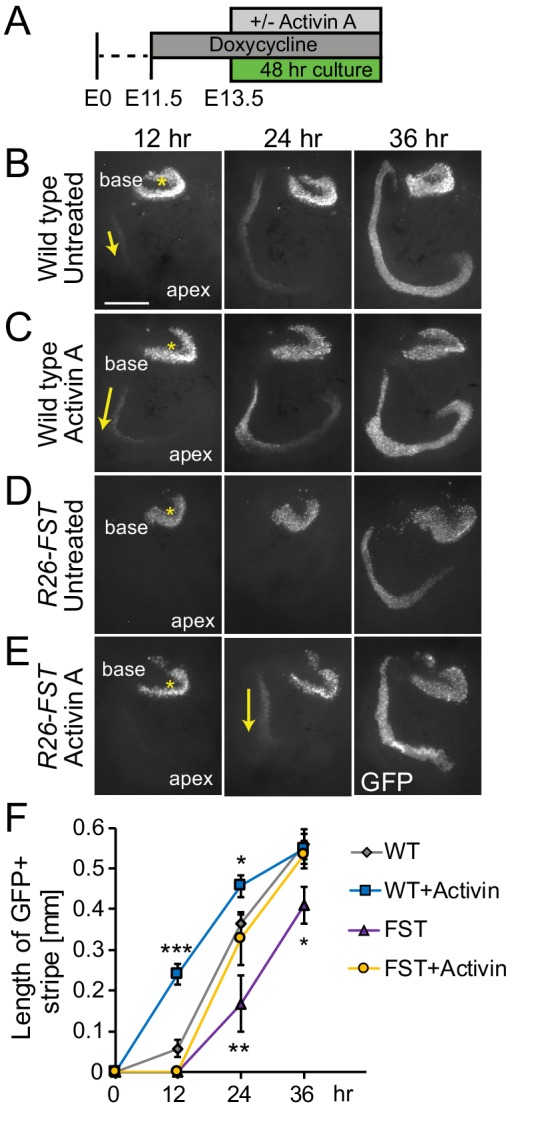
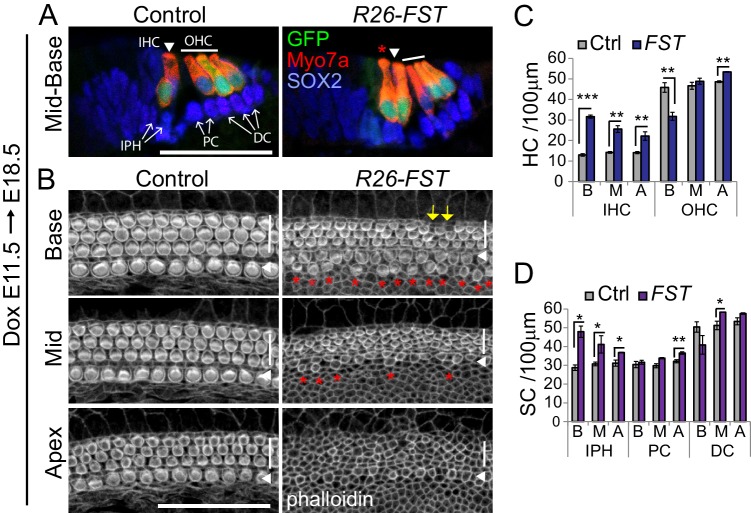
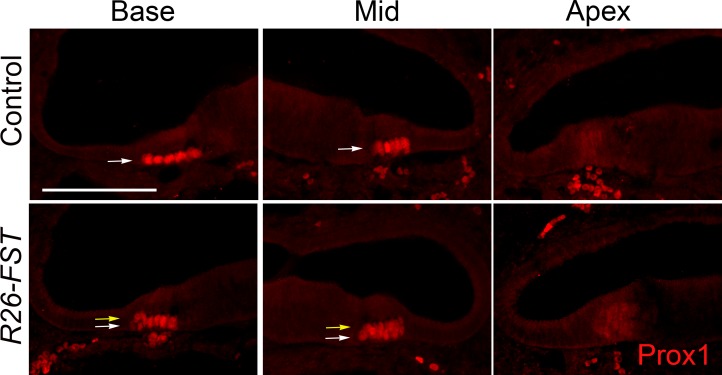
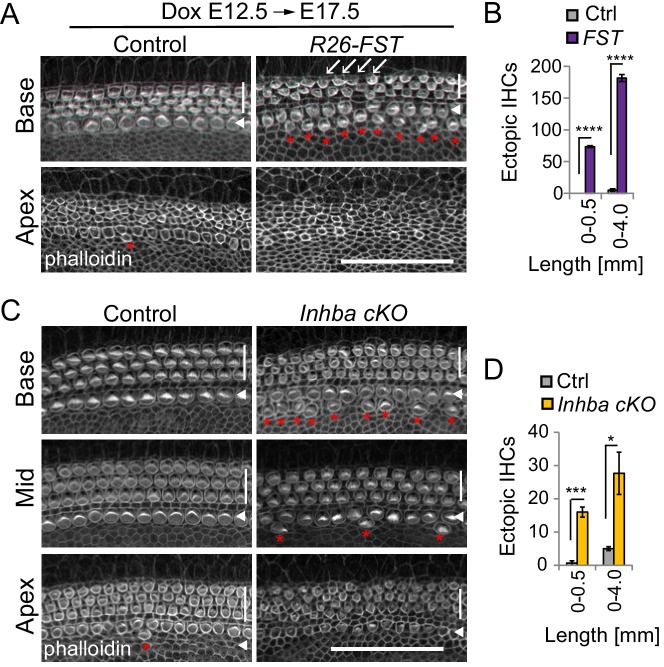
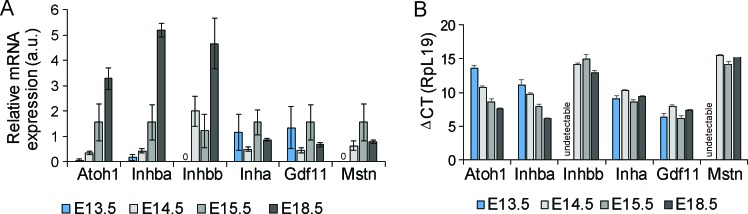
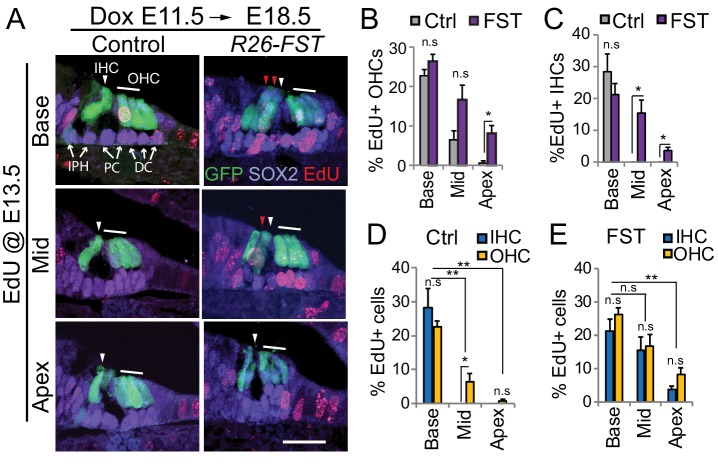
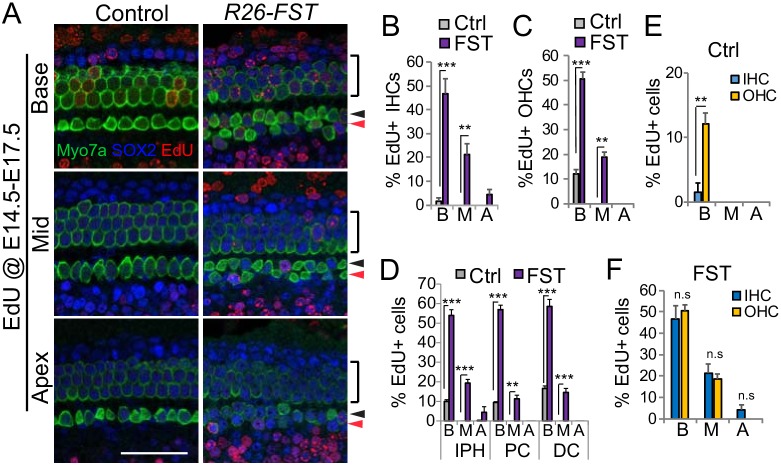
The mammalian auditory sensory epithelium has one of the most stereotyped cellular patterns known in vertebrates. Mechano-sensory hair cells are arranged in precise rows, with one row of inner and three rows of outer hair cells spanning the length of the spiral-shaped sensory epithelium. Aiding such precise cellular patterning, differentiation of the auditory sensory epithelium is precisely timed and follows a steep longitudinal gradient. The molecular signals that promote auditory sensory differentiation and instruct its graded pattern are largely unknown. Here, we identify Activin A and its antagonist follistatin as key regulators of hair cell differentiation and show, using mouse genetic approaches, that a local gradient of Activin A signaling within the auditory sensory epithelium times the longitudinal gradient of hair cell differentiation. Furthermore, we provide evidence that Activin-type signaling regulates a radial gradient of terminal mitosis within the auditory sensory epithelium, which constitutes a novel mechanism for limiting the number of inner hair cells being produced.

Keywords: activin signaling; auditory cell differentiation; cochlea; developmental biology; follistatin; hair cell; inner ear; mouse; neuroscience.


Conflict of interest statement

MP, AB, EG, SZ, AD No competing interests declared

Figures

Figure 1.
Figure 1.. Activin A expression parallels auditory hair cell differentiation.
(A-C) In situ hybridization (ISH) was used to analyze the cochlear expression pattern of Inhba and Fst at the onset of (A, E13.5) and during hair cell differentiation (B, E14.5 and C, E15.5) in adjacent serial cochlear sections. Sox2 transcript marks the pro-sensory/sensory domains, Atoh1 transcript marks nascent hair cells. Brackets mark the pro-sensory/sensory domains with the cochlear duct. Abbreviations: m, medial; l, lateral. Scale bar, 100 µm. (D) Schematics of longitudinal (apical–basal) and radial (medial-lateral) expression gradients of Inhba (green) and Fst (red) within the auditory sensory epithelium.
Figure 2.
Figure 2.. Activin A promotes auditory hair cell differentiation.
(A) Experimental design for B-D. Stage E13.5 wild type cochlear explants were cultured with or without Activin A (final conc. 500 ng/ml) for 24 hr. (B) Atoh1-GFP reporter expression (GFP, gray) was used to monitor and analyze hair cell differentiation in Activin A-treated and control cochlear explants. Asterisks mark the vestibular saccule that contain GFP positive hair cells. Yellow arrows mark the onset of hair cell differentiation within the cochlea. Scale bar, 100 µm. (C) Quantification of basal-to-apical extent of hair cell differentiation in control versus Activin A-treated cochlear cultures (B). Data expressed as mean ± SEM (n = 5–8 cochlear explants per group, **p<0.01, ***p<0.001, ****p<0.0001, student’s t-test). (D) Transcript levels of pro-sensory genes (Id1-4, Hey1, Hey2, p27, Etv5, Fgf20, Ptch1) and hair cell-specific genes (Atoh1, Pou4f3) were analyzed in enzymatically purified cochlear epithelia. Data are mean ± SEM (n = 3 biological replicates, *p<0.05, **p<0.01, ***p<0.001, student’s t-test). (E) Experimental design for F, G. Stage E13.5 wild type cochlear epithelia were cultured with or without Activin A (final conc. 200 ng/ml) or BMP4 (final conc. 100 ng/ml) for 3.5 hr. (F) RT-qPCR analysis reveals differential response to Activin A and BMP4 treatment. Individual cochlear epithelia were analyzed. Data are mean ± SEM, n = 4 biological replicates, *p<0.05. (G) Activin A induces SMAD2/3 phosphorylation in cochlear epithelial cells. Western blot analysis was used to detect phosphorylated (p) SMAD2/3 and p-SMAD1/5/9 proteins in individual cochlear epithelia after 3.5 hr culture with or without Activin A or BMP4. Beta-actin was used as loading control.
Figure 3.
Figure 3.. FST overexpression interferes with auditory hair cell differentiation.
(A) Inducible FST transgenic mouse model. In the presence of doxycycline (dox) double transgenic animals (R26-M2rtTA and tetO-human FST) express human FST under the control of the R26 promoter (R26-FST). Non-transgenic littermates and littermates that carry only one of the transgenes were used as experimental controls (Ctrl). (B) Human (h) FST transgene expression in control (Ctrl) and R26-FST transgenic (FST) cochlear epithelia after 48 hr of dox administration. Plotted is the difference in cycle threshold (ΔCT) compared to the reference gene Rpl19. Data expressed as mean ± SEM (n = 4 animals per group, ***p≤0.001, student’s t-test). (C) Low power fluorescent images showing native Atoh1-GFP reporter expression (GFP, gray) in wild type (control) and FST overexpressing (R26-FST) cochleae stage E14.5. Asterisks mark the vestibular saccule that contain GFP positive hair cells. Yellow arrows mark the onset of hair cell differentiation within the cochlea. Scale bar 100 µm. (D) Confocal images of wild type (control) and FST overexpressing (R26-FST) cochlear cross sections, stage E14.5. GFP expression (GFP, green) marks hair cells (yellow arrow), SOX2 staining (red) marks the sensory domain. Scale bar 100 µm. (E) RT-qPCR-based analysis of gene expression in FST overexpressing (FST) and control cochlear epithelia (Ctrl). Data are mean ± SEM (n = 4–5 animals per group, *p<0.05, **p<0.01, ***p<0.001, student’s t-test). (F) Western blot-based analysis of p-SMAD2/3 and p-SMAD1/5/9 protein expression in stage E14.5 FST transgenic (FST: 1–4) and control (Ctrl: 1–3) cochlear epithelia. Beta-actin was used as loading control. (G) Quantification of p-SMAD2/3 and p-SMAD1/5/9 protein levels in F.
Figure 4.
Figure 4.. Exogenous Activin A rescues the FST induced delay in auditory hair cell differentiation.
(A) Experimental design for B-E. Dox was administered to timed pregnant dams starting at E11.5. At E13.5, cochlear tissue from FST overexpressing embryos (R26-FST) and wild type littermates were cultured for 48 hr with or without Activin A (500 ng/ml). (B–E) Atoh1-GFP reporter expression (GFP, gray) marks nascent hair cells. Asterisks indicate hair cells within vestibular sacculus. Yellow arrows mark nascent cochlear hair cells. Scale bar, 100 μm. (F) The length of the GFP positive sensory epithelium was used to quantify the extent of hair cell differentiation in wild type (WT) and FST overexpressing (FST) cochlear explants cultured with and without Activin A. Data expressed as mean ± SEM (n = 5–8 cochlear explants per group, *p≤0.05, **p<0.01, ***p<0.001, student’s t-test). Two independent experiments were conducted and data compiled.
Figure 5.
Figure 5.. FST overexpression in the developing cochlea disrupts inner hair cell patterning and delays hair cell maturation.
FST transgenic (R26-FST) embryos and their control (wild type or single transgenic) littermates were exposed to dox starting at E11.5 until tissue harvest at E18.5. (A) FST overexpression results in ectopic inner hair cells. Shown are cross-sections through the cochlear mid-base of control and R26-FST transgenic embryos. GFP (green) and Myo7a (red) label inner hair cells (IHC, white arrowhead) and outer hair cells (OHC, white bar). Red asterisks mark ectopic inner hair cells. SOX2 (blue) labels supporting cells including inner phalangeal cells (IPH), pillar cells (PC) and Deiters’ cells (DC) indicated by white arrows. Scale bar 50 µm. (B) FST overexpression delays stereocilia formation. Shown are z-stack projections of the luminal surface of control and R26-FST transgenic cochlear sensory epithelia. Phalloidin labels actin-rich stereocilia of inner (white arrowhead) and outer hair cells (white bar). Red asterisks mark ectopic inner hair cells. Yellow arrows mark the location of missing outer hair cells. Scale bar 50 µm. (C–D) Quantification of hair cell (C) and supporting cell (D) density in the base, mid and apex of control (Ctrl, gray bars) and FST overexpressing (FST, purple bars) cochleae. Abbreviations: IHC, inner hair cells; OHC, outer hair cells; IPH, inner phalangeal cells; PC, pillar cells; DC, Deiters’ cells; B, base; M, mid; A, apex. Data expressed as mean ± SEM (n = 3 animals per group, *p≤0.05, **p<0.01, student’s t-test).
Figure 5—figure supplement 1.
Figure 5—figure supplement 1.. FST overexpression delays the thinning of the auditory sensory epithelium.
FST transgenic (R26-FST) embryos and their control (wild type or single transgenic) littermates were exposed to dox starting at E11.5 until tissue harvest at E18.5. PROX1 immuno-staining (red) marks pillar cell and Deiters cell nuclei. Note in FST overexpressing cochleae PROX1 positive supporting cells (yellow and white arrow) are not yet confined to a single layer, unlike control cochleae. Scale bar 100 µm.
Figure 6.
Figure 6.. Activin signaling is required for patterning and maturation of hair cells.
(A–B) FST overexpression at E12.5 delays hair cell maturation and causes a mild overproduction of inner hair cells. FST transgenic (R26-FST) embryos and their control (single transgenic) littermates were exposed to dox starting at E12.5 until tissue harvest at E17.5. (A) Shown are the apical surfaces of hair cells located in the base, mid and apex of control and R26-FST transgenic cochlear sensory epithelia. Phalloidin labels actin-rich stereocilia of inner (white arrowhead) and outer hair cells (white bar). Red asterisks mark ectopic inner hair cells. White arrows mark location of missing outer hair cells. Scale bar 50 µm. (B) Graphed are the number of ectopic inner hair cells (IHC) within the most basal segment (0–0.5 mm) and within the entire length (0–4 mm) of control (Ctrl, gray) and FST overexpressing (FST, purple) cochleae. Data expressed as mean ± SEM (n = 3 animals per group, ****p<0.0001, student’s t-test). (C-D) Conditional ablation of the Inhba gene delays hair cell maturation and causes a mild overproduction of inner hair cells. (C) Shown are the apical surfaces of hair cells located in the base, mid and apex of stage P0 Inhba fl/fl (control) and Pax2-Cre Inhba fl/fl (Inhba cKO) cochlear sensory epithelia. Phalloidin labels actin-rich stereocilia of inner (white arrowhead) and outer hair cells (white bar). Red asterisks mark ectopic inner hair cells. Scale bar 50 µm. (D) Graphed are the number of ectopic inner hair cells (IHC) within the most basal segment (0–0.5 mm) and within the entire length (0–4 mm) of control (Ctrl, gray) and Inhba mutant (Inhba cKO, orange) cochleae. Data expressed as mean ± SEM (n = 3 animals per group, *p≤0.05, ***p<0.001).
Figure 6—figure supplement 1.
Figure 6—figure supplement 1.. Characterization of Activin-type ligand expression in cochlear epithelial cells.
(A) Relative mRNA expression levels of Activin–type ligands (Inhba, Inhbb, Gdf11, Mstn) and Activin antagonist Inhibin A (Inha) in cochlear epithelia cells at the onset of (E13.5), during (E14.5, E15.5), and after cochlear differentiation (E18.5). Atoh1 mRNA expression is a marker of nascent hair cells. Data are mean ± SEM (n = 3 technical replicates). B: Plotted is the difference in cycle threshold (ΔCT) between target genes and the reference gene Rpl19 in the analysis shown in A. Note that a ΔCT level of 14 or higher indicates that a gene is expressed at a very low level close to the limit of detection. Data are mean ± SEM (n = 3 technical replicates).
Figure 7.
Figure 7.. FST overexpression delays pro-sensory cell cycle exit.
Timed mated pregnant dames received dox beginning at E11.5, followed by a single injection of EdU at E13.5. At E18.5, FST transgenic (R26-FST) embryos and their control (wild type or single transgenic) littermates were harvested and analyzed for EdU incorporation (red). (A) Shown are cross-sections through the base, mid and apical turn of control and FST overexpressing cochlear tissue. Atoh1-GFP transgene expression (GFP, green) marks inner hair cells (IHC, white arrowhead) and outer hair cells (OHC, white bar). SOX2 immunostaining (magenta) marks supporting cells including inner phalangeal cells (IPH), pillar cells (PC) and Deiters’ cells (DC) marked by white arrows. Ectopic inner hair cells are marked by red arrowheads. Scale bar, 50 µm. (B–E) Graphed are the percentage of EdU positive outer hair cells (OHC) and inner hair cells (IHC) that were observed within the base, mid and apex of control (Ctrl) and FST overexpressing (FST) cochlear whole mounts. Data expressed as mean ± SEM (n = 4 animals per group, *p≤0.05, **p<0.01, student’s t-test).
Figure 8.
Figure 8.. Overexpression of FST disrupts a medial-lateral gradient of pro-sensory cell cycle exit.
Timed mated pregnant dam received dox beginning at E11.5, followed by two daily injections of EdU starting at E14.5 until E17.5. At E18.5, FST transgenic (R26-FST) embryos and their control (single transgenic) littermates were harvested and analyzed for EdU incorporation (red). (A) Shown are basal, mid and apical segments of control and FST overexpressing auditory sensory epithelia. Myo7a immuno-staining (green) marks inner (black arrowhead), outer (black bar) and ectopic inner hair cells (red arrow head). SOX2 immuno-staining (blue) marks surrounding supporting cells and less mature hair cells. Scale bar, 50 µm. (B–C) FST overexpression (FST, purple bars) significantly increases the percentage of EdU positive inner (IHC) (B) and outer hair cells (OHC) (C) compared to control (Ctrl, gray bars). (D) FST overexpression (FST, purple bars) significantly increases the percentage of EdU positive inner phalangeal cells (IPH), pillar cells (PC) and Deiters cells compared to control (Ctrl, gray bars). (E) In control cochlear tissue IHCs (blue) incorporate EdU at a significantly lower rate than OHCs (yellow). (F) In FST overexpressing cochlear tissue IHCs (blue) and OHCs (yellow) incorporate EdU at a similar rate. Abbreviations: B, base; M, mid; A, apex. Data expressed as mean ± SEM (n = 3 animals per group **p<0.01, ***p<0.001, student’s t-test).

Similar articles

Cited by

References

    1. Barton DE, Yang-Feng TL, Mason AJ, Seeburg PH, Francke U. Mapping of genes for inhibin subunits Alpha, beta A, and beta B on human and mouse chromosomes and studies of jsd mice. Genomics. 1989;5:91–99. doi: 10.1016/0888-7543(89)90091-8. - DOI - PubMed
    1. Basch ML, Brown RM, Jen HI, Semerci F, Depreux F, Edlund RK, Zhang H, Norton CR, Gridley T, Cole SE, Doetzlhofer A, Maletic-Savatic M, Segil N, Groves AK. Fine-tuning of notch signaling sets the boundary of the organ of Corti and establishes sensory cell fates. eLife. 2016;5:e19921. doi: 10.7554/eLife.19921. - DOI - PMC - PubMed
    1. Beites CL, Hollenbeck PL, Kim J, Lovell-Badge R, Lander AD, Calof AL. Follistatin modulates a BMP autoregulatory loop to control the size and patterning of sensory domains in the developing tongue. Development. 2009;136:2187–2197. doi: 10.1242/dev.030544. - DOI - PMC - PubMed
    1. Benezra R, Davis RL, Lockshon D, Turner DL, Weintraub H. The protein Id: a negative regulator of helix-loop-helix DNA binding proteins. Cell. 1990;61:49–59. doi: 10.1016/0092-8674(90)90214-Y. - DOI - PubMed
    1. Benito-Gonzalez A, Doetzlhofer A. Hey1 and Hey2 control the spatial and temporal pattern of mammalian auditory hair cell differentiation downstream of hedgehog signaling. Journal of Neuroscience. 2014;34:12865–12876. doi: 10.1523/JNEUROSCI.1494-14.2014. - DOI - PMC - PubMed

Publication types