. 2019 Oct 1;40(14):4005-4025.
doi: 10.1002/hbm.24692. Epub 2019 Jun 12.

Omission of temporal nuisance regressors from dual regression can improve accuracy of fMRI functional connectivity maps

Affiliations

Omission of temporal nuisance regressors from dual regression can improve accuracy of fMRI functional connectivity maps

Robert E Kelly Jr et al. Hum Brain Mapp. .

Abstract

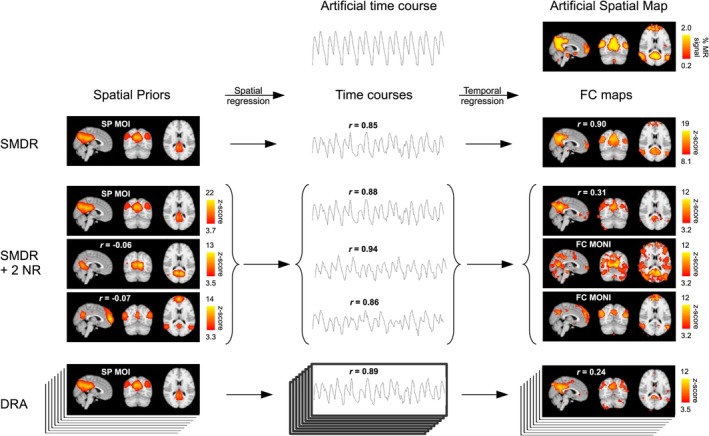
Functional connectivity (FC) maps from brain fMRI data can be derived with dual regression, a proposed alternative to traditional seed-based FC (SFC) methods that detect temporal correlation between a predefined region (seed) and other regions in the brain. As with SFC, incorporating nuisance regressors (NR) into the dual regression must be done carefully, to prevent potential bias and insensitivity of FC estimates. Here, we explore the potentially untoward effects on dual regression that may occur when NR correlate highly with the signal of interest, using both synthetic and real fMRI data to elucidate mechanisms responsible for loss of accuracy in FC maps. Our tests suggest significantly improved accuracy in FC maps derived with dual regression when highly correlated temporal NR were omitted. Single-map dual regression, a simplified form of dual regression that uses neither spatial nor temporal NR, offers a viable alternative whose FC maps may be more easily interpreted, and in some cases be more accurate than those derived with standard dual regression.

Keywords: brain mapping; functional neuroimaging; image enhancement; investigative techniques; magnetic resonance imaging.


Conflict of interest statement

The authors declare no competing conflict of interest.

Figures

Figure 1
Figure 1
Illustration of dual regression, mapping visual cortex FC for a selected subject. The full set of spatial priors (in this example, N spatial maps from group ICA of all subjects' conventionally preprocessed, temporally concatenated fMRI data) is regressed onto the fMRI data for subject i, yielding time courses that are in turn regressed onto subject i's fMRI data to yield a set of FC maps. One of the group‐derived spatial priors is identified as representing the network of interest (visual cortex), and its corresponding FC map represents FC for subject i's visual cortex. In standard dual regression (DRA, dual regression with all regressors), if we are only interested in the visual cortex component, then the remaining FC maps are ignored, as maps of no interest. In our study, we consider SMDR, a variant of dual regression where nuisance regressors are completely omitted from both regressions. FC, functional connectivity; ICA, independent component analysis; SMDR, single‐map dual regression [Color figure can be viewed at http://wileyonlinelibrary.com]
Figure 2
Figure 2
Vector‐space illustration of spurious correlations that arise during spatial regression, between temporal nuisance regressors and signal of interest, as a consequence of “misalignments” between nuisance spatial priors and the spatial distribution of signal of interest (see text for details). Consider three mutually uncorrelated spatial distributions (+1 or −1 in areas A1, A2, and A3) for mutually uncorrelated signals S 1, S 2, and S 3, respectively. When spatial priors P 1, P 2, and P 3 correlate perfectly with spatial distributions of their corresponding signals in fMRI data (Case A), then each time course derived from spatial regression (T a1, T a2, and T a3) approximates its corresponding signal in the fMRI data (S 1, S 2, and S 3). However, when “overlap” (spatial correlation) exists between a nuisance spatial prior and the distribution of signal of interest (Case B), then the time course derived from the nuisance spatial prior (T b2) will tend to correlate with the signal of interest (S 1). This spurious correlation with the signal of interest can increase dramatically when the nuisance spatial prior has no corresponding signal from structured noise or neural signal of no interest in the fMRI data (Case C): In the absence of the nuisance signal (S 2), the signal of interest can become the largest component of the derived nuisance time‐course vector (T c2)
Figure 3
Figure 3
Addition of relatively small amounts of signal of interest to temporal NR in dual regression can filter out the signal of interest, causing dramatic reductions in derived FC. Shown in the figure are results of temporal regression using variables S i (signal of interest), S n1 (noise source), S n2 (noise source), S v (voxel's time course, with 15% of variance from S i, 60% from S n1, and 25% from S n2), and S d (time course representing the signal of interest, as derived from spatial regression, with 95% of variance from S i and 5% from S n1). When NR are omitted from the temporal regression (Equation 1, where c is a constant and ε represents residuals, whose sum of squares is minimized to derive the regression coefficient, bd), regressing the derived signal of interest (S d) onto the fMRI data (S v) yields an FC z‐score of 7.54, corresponding to one‐tailed probability 2.27 × 10−14, derived from the t‐score of bd/(SE of bd) = 8.29, with df = 158. This z‐score is increased to 8.58 (corresponding to t‐score of 9.71, with df = 157) when nuisance regressor S r is incorporated into the regression (Equation 2), if S r's proportion (P) of variance contributed by S i is zero. However, small amounts of added signal of interest (S i) to S r cause a dramatic drop in the FC z‐score (figure, bottom). When S i constitutes 20% of S r's variance, the z‐score is reduced to zero; and higher percentages cause the z‐score to become negative. S i, S n1, and S n2 here are mean centered, mutually orthogonal, and of unit variance. All waveforms are drawn to scale, simulating time courses for 160 volumes of fMRI data. FC, functional connectivity; NR, nuisance regressors
Figure 4
Figure 4
Overview of method comparison [Color figure can be viewed at http://wileyonlinelibrary.com]
Figure 5
Figure 5
Experiment 3: Method comparison process [Color figure can be viewed at http://wileyonlinelibrary.com]
Figure 6
Figure 6
Experiment 1: Example of decreased FC map quality after including two (SMDR + 2 NR) or all (DRA) NR in dual regression. The time courses for two NR used in DRA for a subject correlated highly with the artificial time course; and the addition of the corresponding spatial prior regressors to SMDR reduced the CC quality score from 0.90 to 0.31. Portions of the artificial spatial map (showing where artificial signal was added) appeared to be contained within the FC MONI. Inclusion of all NR further reduced CC (0.24). Arrows represent regression, spatial or temporal, onto the session's fMRI data. Pearson correlation coefficients (r) show correlations with the top spatial map or time course in each column: SP MOI, artificial time course, or the artificial spatial map. Spatial maps were visualized with lower thresholds set (a) for spatial priors, with group ICA (FSL MELODIC) alternative hypothesis test at p > .95; (b) for the artificial spatial map, at 1/10 of maximum artificial signal amplitude; and (c) for the FC maps, at a z‐score where # false positive = # false negative voxels, defining true “activation” with the binary map that had been spatially blurred to create the artificial spatial map. All shown sagittal, coronal, and axial brain slices intersect at MNI coordinates [3, −63, 15]. FC, functional connectivity; FC MONI, FC maps of no interest; ICA, independent component analysis; MELODIC, Multivariate Exploratory Linear Decomposition into Independent Components; MNI, Montreal Neurological Institute; NR, nuisance regressors; SMDR, single‐map dual regression; SP MOI, spatial prior map of interest [Color figure can be viewed at http://wileyonlinelibrary.com]
Figure 7
Figure 7
Experiment 3: Example of decreased FC map quality scores after including one (SMDR + 1 NR) or all (DRA) NR in dual regression. The time course for a nuisance regressor used in DRA, presumed to model structured noise (prominent activation in the sagittal sinus), correlated highly with the a priori time course; and the addition of the corresponding spatial prior regressor to SMDR reduced the CC quality score from 0.91 to 0.70. Portions of the thresholded SOC map appeared to be contained within the FC MONI. Inclusion of all NR further reduced CC (0.61). Arrows represent regression, spatial or temporal, onto the session's fMRI data. Pearson correlation coefficients (r) show correlations with the top spatial map or time course in each column: SP MOI, a priori time course, or SOC map. Spatial maps were visualized with lower thresholds set 1) for spatial priors, at a conventional threshold (z = 3.1); 2) for the SOC map, using FDR (false discovery rate); and 3) for the FC maps, at a z‐score where # false positive = # false negative voxels, using the thresholded SOC map to define true “activation.” All shown sagittal, coronal, and axial brain slices intersect at MNI coordinates [2, −26, −20]. FC, functional connectivity; FC MONI, FC maps of no interest; MNI, Montreal Neurological Institute; NR, nuisance regressors; SMDR, single‐map dual regression; SP MOI, spatial prior map of interest; SOC, standard‐of‐comparison [Color figure can be viewed at http://wileyonlinelibrary.com]
Figure 8
Figure 8
Mean functional connectivity (FC) map quality scores, z(CC), where CC is the correlation between FC maps and SOC maps, for standard dual regression (DRA), and SMDR, for Experiments 1 and 2 and the four runs from Experiment 3. Key: *p < .05. **p < .01, ***p < .001; two‐tailed paired t tests, not corrected for multiple comparisons. FC, functional connectivity; SMDR, single‐map dual regression; SOC, standard‐of‐comparison
Figure 9
Figure 9
Relationships between Fisher r‐to‐z transformed FC map quality scores, z(CC), and coefficients of multiple correlation with NR for artificial signal time course in Experiments 1 and 2, z(R[T ai,T n]), or a priori time course in Experiment 3, z(R[T ap,T n]). Higher z(R[T ai,T n]) and z(R[T ap,T n]) were significantly associated with lower z(CC) scores for standard dual regression with all spatial priors (DRA, second row), but not for SMDR (top row), resulting in significantly larger differences in quality scores (bottom row), z(CCSMDR)–z(CCDRA), with increasing collinearity between signal of interest (artificial or a priori time course) and NR. Upper left corners of scatter plots show correlations between z(CC) and z(R[T ai,T n]) or z(R[T ap,T n]), tested for statistical significance (uncorrected for multiple comparisons) with two‐tailed t tests against the null hypothesis of r = 0. FC, functional connectivity; NR, nuisance regressors; SMDR, single‐map dual regression
Figure 10
Figure 10
Mean FC map quality scores (z[CC] top two rows; PD bottom two rows), for Experiment 1 (Rows 1 and 3) and Experiment 2 (Rows 2 and 4), before and after denoising by regressing out temporal regressors derived from ICA, selected with visual inspection (VIID) or selected from the complete set of single‐subject ICs except for the default mode IC (non‐DM). Quality scores decreased with denoising for DRA (left column), but increased for SMDR (right column). The choice of full regression (in preprocessing) versus partial regression (in the temporal regression step of dual regression) had little effect on quality scores, even in comparing DRA with DRA variants where DRA's temporal NR were fully or partially regressed out in preprocessing (pre‐DRA, left column, rightmost pair of bars). Differences shown between results from full regression (black bars) and partial regression (adjacent gray bars) as well as between full regression and index comparator (left‐most gray bar in each bar chart) were statistically significant with p < .001 (uncorrected for multiple comparisons) in two‐tailed paired t tests (top two rows) or two‐tailed Wilcoxon's signed‐rank tests (bottom two rows). FC, functional connectivity; ICA, independent component analysis
Figure 11
Figure 11
Artificial signal‐strength statistics, averaged over subjects in Experiment 1 (left column) and Experiment 2 (right column), in regions where artificial signal was added to synthetic fMRI data. Our measure of signal strength for the time course of a given voxel is t SNR = r*sqrt(df/[1‐r 2]), where df is degrees of freedom for t‐score (=n−2, where n is the number of time points) and r is Pearson's correlation coefficient between the artificial signal and the voxel's time course. t SNR is related to the signal‐to‐noise ratio, SNR = (signal variance)/(noise variance) = t SNR 2/df. Shown for t SNR are mean (mean[t SNR], top row), coefficient of variation (CV[t SNR], middle row), and percentage of negative voxels (Pneg[t SNR], bottom row), before (none, left‐most bar in each chart) and after denoising by fully regressing out temporal regressors from components derived with ICA (fICA, middle bars) or by partially regressing out DRA's temporal nuisance regressors (pDRA, right‐most bars). fICA lowered voxels' mean artificial signal strength, mean(t SNR), but could nonetheless improve detection of FC by reducing dispersion of voxel signal strength (CV[t SNR]) around its mean, thereby improving detection for voxels whose signal strength would otherwise fall below thresholds for detection. In contrast, pDRA increased CV(t SNR), thereby lowering signal strength for some voxels below thresholds for detection of FC, even to the point where voxel time courses became anticorrelated with the artificial signal of interest, as reflected in Pneg(t SNR). Results after denoising within each bar graph differed significantly (p < .001) from those before denoising in two‐tailed Wilcoxon's signed‐rank tests. ICA, independent component analysis

Similar articles

Cited by

References

    1. Abbott, C. , Il, K. D. , Bustillo, J. , & Calhoun, V. (2010). Decreased modulation of the anterior default mode network during novelty detection in older patients with schizophrenia. The American Journal of Geriatric Psychiatry, 18, S93–S94. - PMC - PubMed
    1. Abram, S. V. , Wisner, K. M. , Fox, J. M. , Barch, D. M. , Wang, L. , Csernansky, J. G. , … Smith, M. J. (2017). Fronto‐temporal connectivity predicts cognitive empathy deficits and experiential negative symptoms in schizophrenia. Human Brain Mapping, 38, 1111–1124. - PMC - PubMed
    1. Aguirre, G. K. , Zarahn, E. , & D'Esposito, M. (1998). The inferential impact of global signal covariates in functional neuroimaging analyses. NeuroImage, 8, 302–306. - PubMed
    1. Ardekani, B. A. , Guckemus, S. , Bachman, A. , Hoptman, M. J. , Wojtaszek, M. , & Nierenberg, J. (2005). Quantitative comparison of algorithms for inter‐subject registration of 3D volumetric brain MRI scans. Journal of Neuroscience Methods, 142, 67–76. - PubMed
    1. Baggio, H. C. , Segura, B. , Sala‐Llonch, R. , Marti, M. J. , Valldeoriola, F. , Compta, Y. , … Junqué, C. (2015). Cognitive impairment and resting‐state network connectivity in Parkinson's disease. Human Brain Mapping, 36, 199–212. - PMC - PubMed

Publication types