. 2019 Sep 23;58(39):13700-13705.
doi: 10.1002/anie.201903694. Epub 2019 Jul 1.

High-Throughput Isolation of Cell Protrusions with Single-Cell Precision for Profiling Subcellular Gene Expression

Affiliations

High-Throughput Isolation of Cell Protrusions with Single-Cell Precision for Profiling Subcellular Gene Expression

Pengchao Zhang et al. Angew Chem Int Ed Engl. .

Abstract

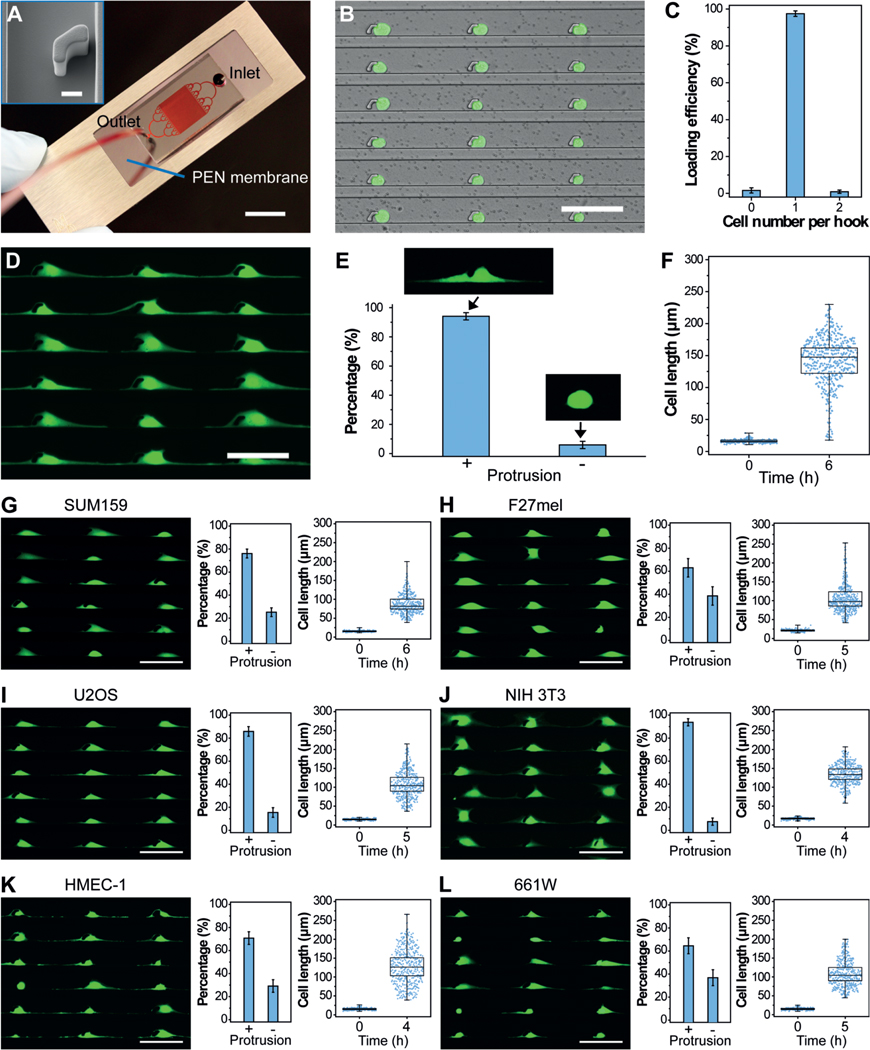
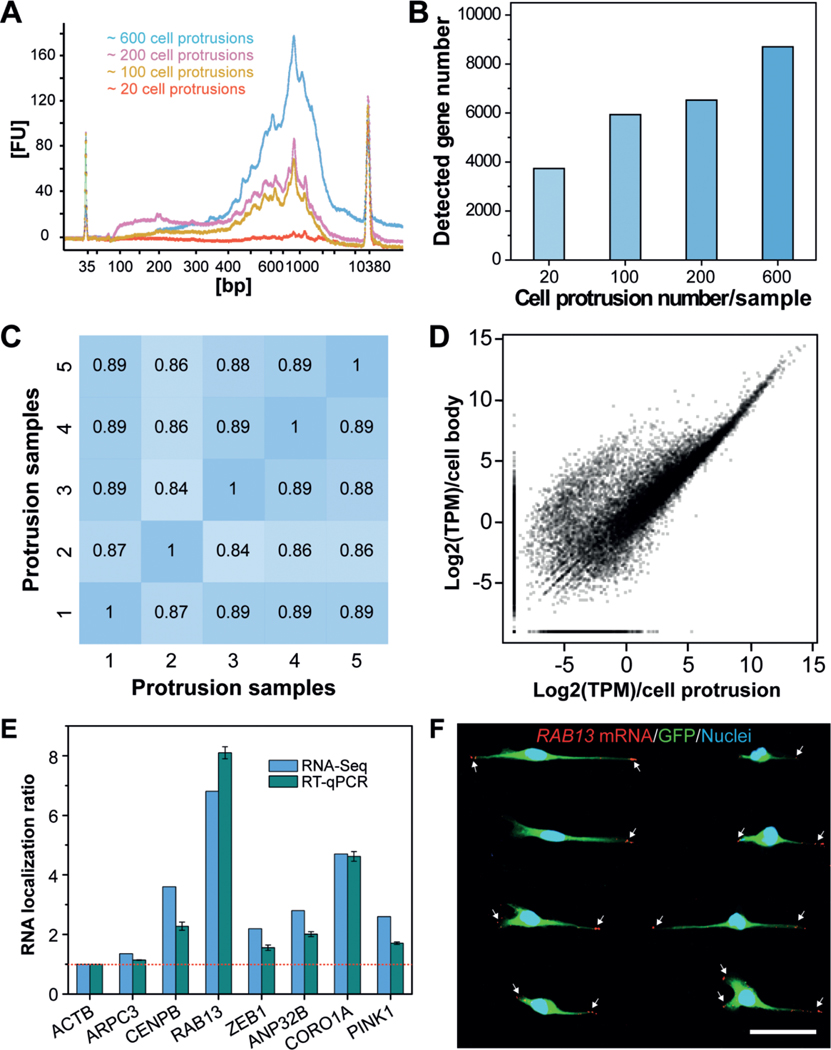
Invading cancer cells extend cell protrusions, which guide cancer-cell migration and invasion, eventually leading to metastasis. The formation and activity of cell protrusions involve the localization of molecules and organelles at the cell front; however, it is challenging to precisely isolate these subcellular structures at the single-cell level for molecular analysis. Here, we describe a newly developed microfluidic platform capable of high-throughput isolation of cell protrusions at single-cell precision for profiling subcellular gene expression. Using this microfluidic platform, we demonstrate the efficient generation of uniform cell-protrusion arrays (more than 5000 cells with protrusions) for a series of cell types. We show precise isolation of cell protrusions with high purity at single-cell precision for subsequent RNA-Seq analysis, which was further validated by RT-qPCR and RNA FISH. Our highly controlled protrusion isolation method opens a new avenue for the study of subcellular functional mechanisms and signaling pathways in metastasis.

Keywords: RNA sequencing; analytical methods; cell protrusion; gene expression; microfluidics.


Conflict of interest statement

Conflict of interest

The authors declare no conflict of interest.

Figures

Figure 1.
Figure 1.
Overview of the microfluidic platform for molecular analysis of cell protrusions. A) Schematic illustration of invasive cells in a migrating tumor front. B) The generation of uniform cell-protrusion arrays in microfluidic chips, which provide an in vitro model for cancer cell migration. C,D) After removing the microfluidic mold and fixing, selected cell protrusions are cut using LCM at single-cell precision, collected on the surface of LCM caps, and lysed for biomolecular analysis.
Figure 2.
Figure 2.
PG-Chip for the generation of uniform cell-protrusion arrays. A) A typical PG-Chip consisted of a PDMS microfluidic mold and a PEN membrane slide. Scale bar, 1 cm. Red dye was injected to visualize the channel networks. Insert image shows the morphology of the micro-hook (Scale bar, 10 mm). B) A representative image and C) loading efficiency of the generated array of single MDA-MB-231/GFP cells using the PG-Chip. Scale bar, 100 μm. D) Uniform cell-protrusion arrays after incubation of the single-cell arrays within the PG-Chip for 6 h. Scale bar, 100 μm. E) Bar graph illustrating the percentage of cells with and without protrusions. Data are expressed as mean standard deviation (SD) F) Analysis of the cell lengths before and after incubation. Whiskers illustrate the range. G–L) Images of uniform cell-protrusion arrays, quantification of the percentage of cells with and without protrusions, and lengths of G) SUM159 breast cancer cells, H) F27 melanoma cells, I) U2OS osteosarcoma cells, J) NIH 3T3 fibroblast cells, K) HEMC-1 endothelial cells, and L) 661W photoreceptor cells after incubation. Data is expressed as mean SD. Whiskers indicate the range. Scale bars, 100 μm.
Figure 3.
Figure 3.
Precise isolation of cell protrusions at single-cell precision using LCM. A) Representative images of isolated cell protrusions (upper panel) and corresponding cell bodies remaining on the PEN membranes (lower panel), indicating the high purity of the collected cell protrusions. Actin was stained with Alexa Fluor 488-Phalloidin, and nuclei were stained with Hoechst. B) High-throughput isolation of cell protrusions, ranging from a single protrusion to hundreds, in one run. Scale bars, 100 μm.
Figure 4.
Figure 4.
Profiling gene-expression patterns in cell protrusions by RNA-Seq. A) Bioanalyzer traces of amplified cDNA from mRNAs that are enriched in cell protrusions. Samples with various numbers of cell protrusions were analyzed. B) Quantification of the number of genes detected in various cell-protrusion samples. C,D) Gene-expression correlation C) between cell-protrusion samples and D) between protrusion samples and cell-body samples with Pearson correlation coefficients (r). E) Validation of protrusion-localized genes by RT-qPCR analyses. The RNA localization ratios were calculated as the relative expression level in the protrusions fraction compared with the cell-body fraction and were normalized to ACTB. Data are expressed as mean SD. F) Validation of protrusion-localized genes by FISH. White arrows indicate the RAB13 mRNAs in cell protrusions. Scale bar, 50 μm.

References

    1. Holt CE, Bullock SL, Science 2009, 326, 1212–1216. - PMC - PubMed
    1. Martin KC, Ephrussi A, Cell 2009, 136, 719–730. - PMC - PubMed
    1. Lundberg E, Borner GHH, Nat. Rev. Mol. Cell Biol 2019, 20, 285–302. - PubMed
    1. Ridley AJ, Cell 2011, 145, 1012–1022. - PubMed
    1. Friedl P, Wolf K, Nat. Rev. Cancer 2003, 3, 362–374. - PubMed

Publication types

MeSH terms