. 2019 Aug 1;30(17):2283-2295.
doi: 10.1091/mbc.E18-08-0482. Epub 2019 Jun 12.

A reversible autophagy inhibitor blocks autophagosome-lysosome fusion by preventing Stx17 loading onto autophagosomes

Affiliations

A reversible autophagy inhibitor blocks autophagosome-lysosome fusion by preventing Stx17 loading onto autophagosomes

Somya Vats et al. Mol Biol Cell. .

Abstract

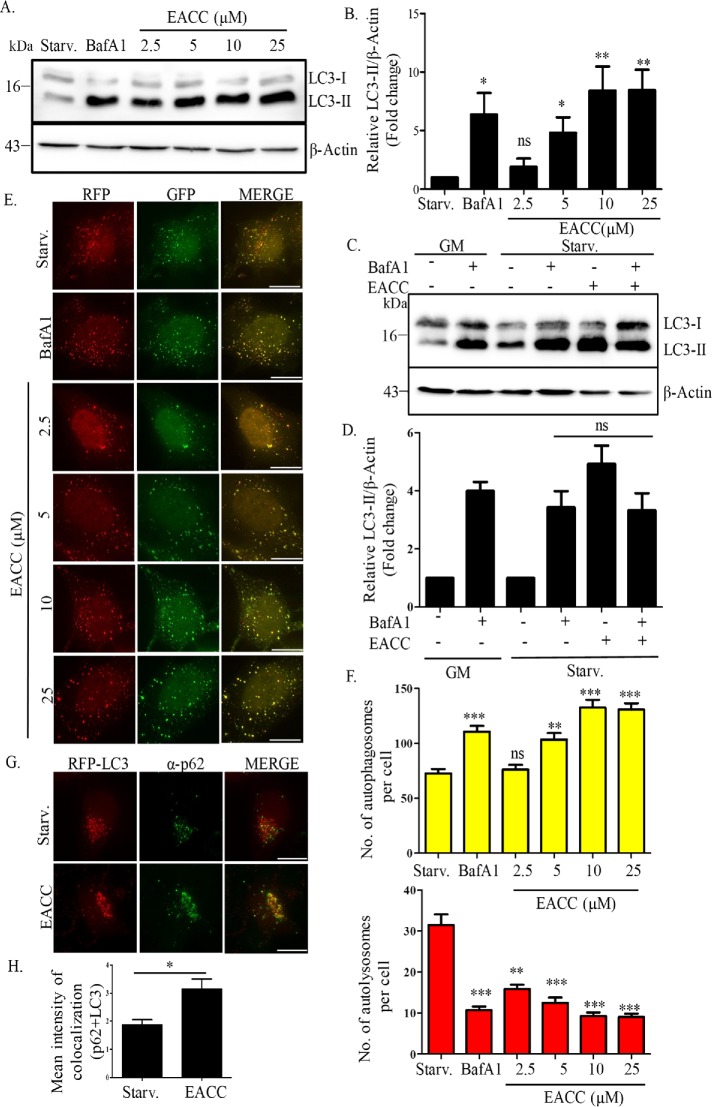
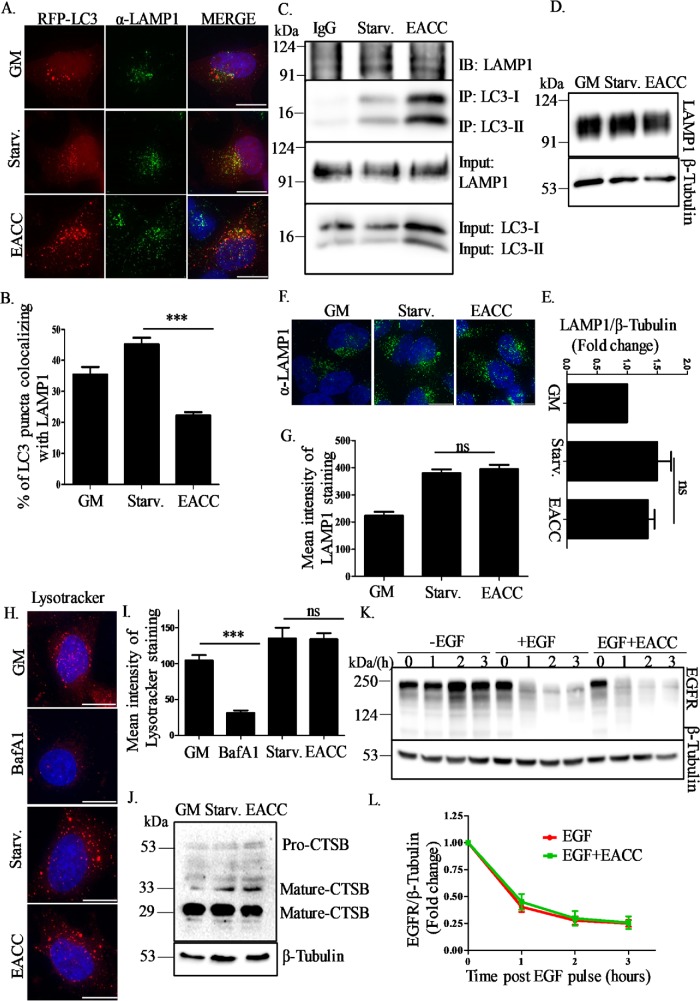
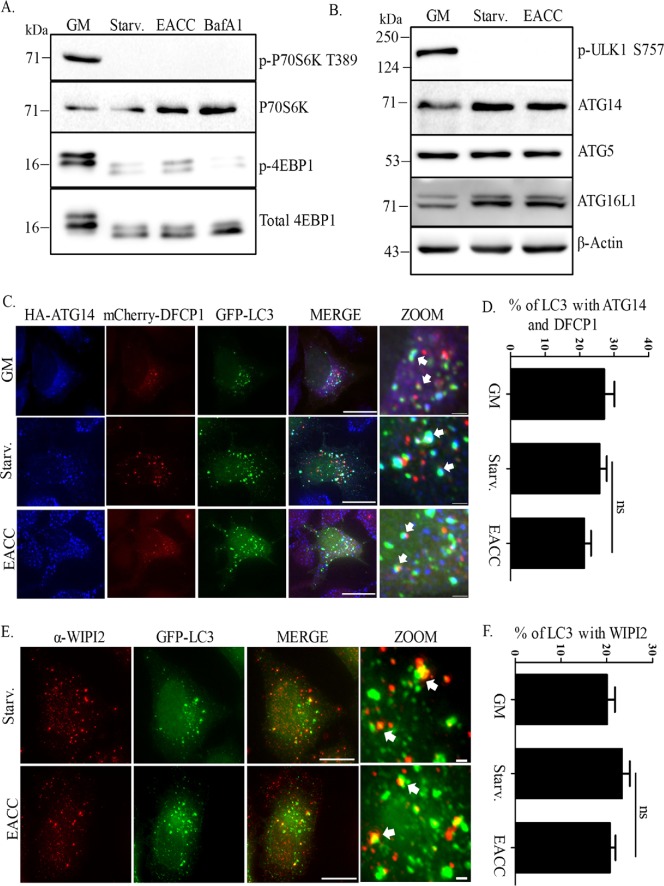
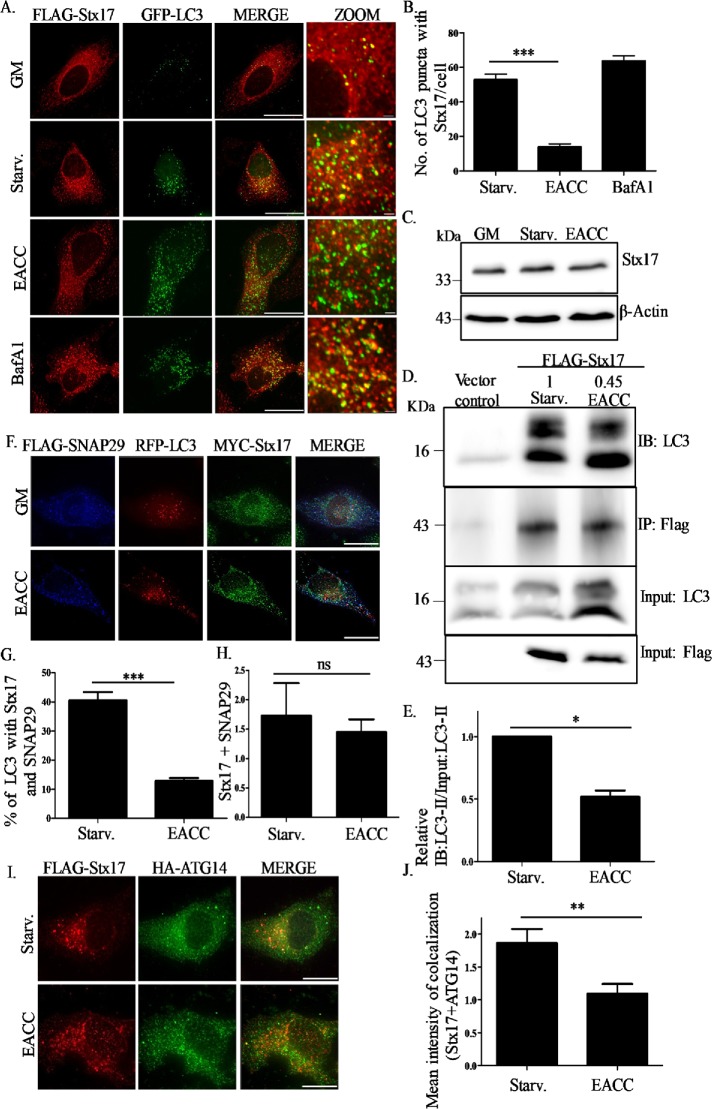
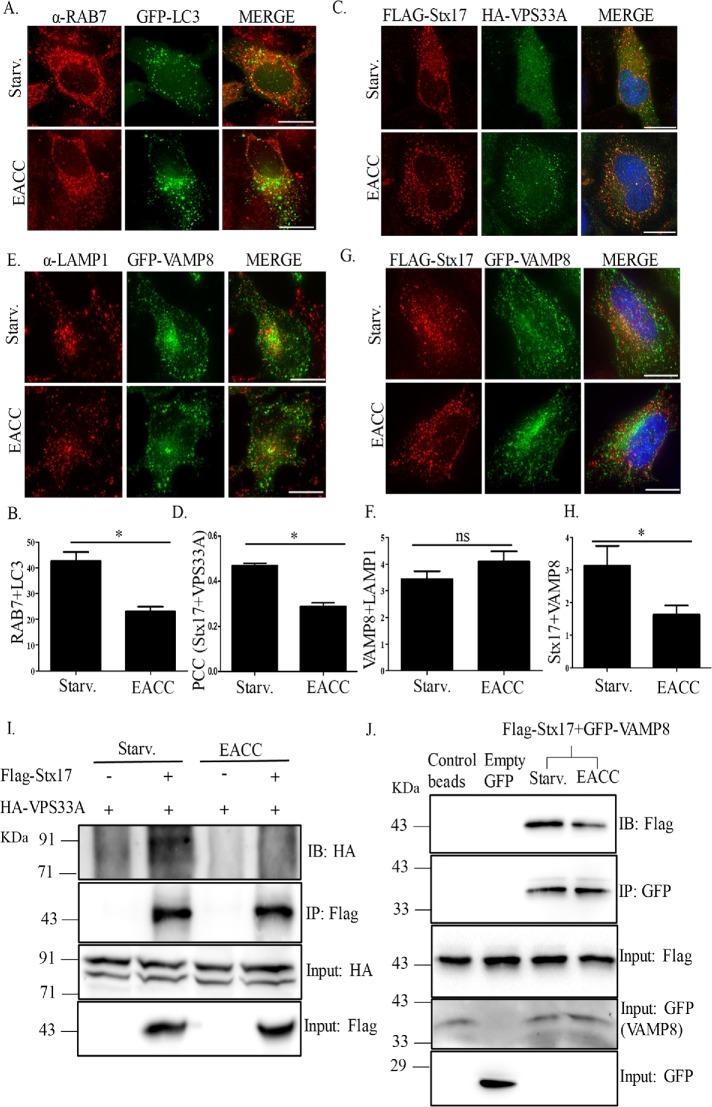
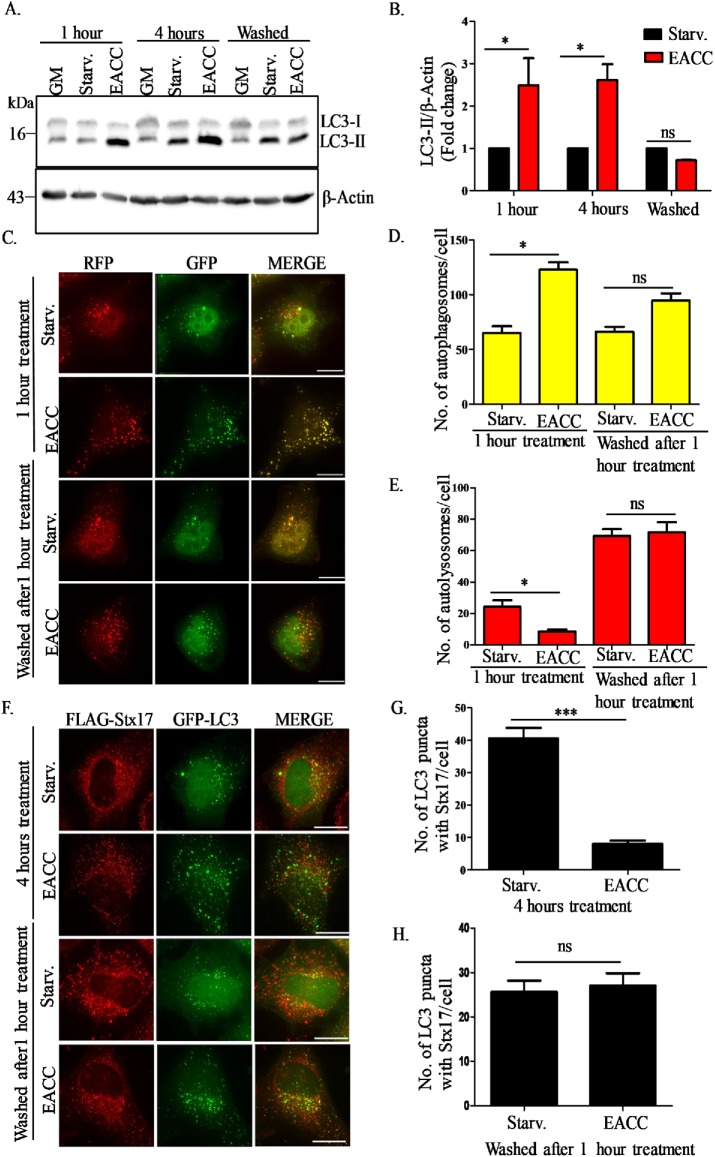
Autophagy is an evolutionarily conserved intracellular lysosomal degradation pathway. It is a multistep process involving de novo formation of double membrane autophagosomes that capture cytosolic constituents (cargo) and eventually fuse with lysosomes wherein the cargo gets degraded and resulting simpler biomolecules get recycled. In addition to their autophagy function, several of the autophagy-related proteins work at the interface of other vesicular trafficking pathways. Hence, development of specific autophagy modulators that do not perturb general endo-lysosomal traffic possesses unique challenges. In this article, we report a novel small molecule EACC that inhibits autophagic flux by blocking autophagosome-lysosome fusion. Strikingly, unlike other late stage inhibitors, EACC does not have any effect on lysosomal properties or on endocytosis-mediated degradation of EGF receptor. EACC affects the translocation of SNAREs Stx17 and SNAP29 on autophagosomes without impeding the completion of autophagosomes. EACC treatment also reduces the interaction of Stx17 with the HOPS subunit VPS33A and the cognate lysosomal R-SNARE VAMP8. Interestingly, this effect of EACC although quite robust is reversible and hence EACC can be used as a tool to study autophagosomal SNARE trafficking. Our results put forward a novel method to block autophagic flux by impeding the action of the autophagosomal SNAREs.


Figures

FIGURE 1:
FIGURE 1:
EACC inhibits autophagic flux. (A) HeLa cells were either left untreated or treated with BafA1 (100 nM) or EACC (2.5–25 µM) for 2 h in starvation conditions. Samples were collected and immunoblotted for anti-LC3 and anti–β-actin antibodies. (B) Relative levels of LC3-II:β-actin in untreated vs. treated samples were quantitated for three independent experiments. **, P < 0.01; *, P < 0.05; ns = nonsignificant (two-way ANOVA, replicate means compared with Bonferroni posttest). (C) HeLa cells were either left untreated or pretreated with BafA1 (100 nM) in basal or starvation conditions for 1 h in order to block the autophagic flux. This was followed by treatment with EACC (10 µM) for 2 h. Samples were collected and immunoblotted for anti-LC3 and anti–β-actin antibodies. (D) Relative levels of LC3-II:β-actin in untreated vs. treated samples were quantitated for three independent experiments. ns = nonsignificant. Statistical significance was analyzed by Student’s unpaired t test. (E) HeLa cells transfected with tandem-tagged ptfLC3 (mRFP-GFP-LC3) construct were either left untreated or treated with BafA1 (100 nM) or EACC (2.5–25 µM) for 2 h in starvation conditions. Scale = 10 µm. (F) The autophagosomes (RFP+/GFP+ structures) and autolysosomes (RFP+/GFP structures) per cell were counted using the cell counter plug-in of ImageJ software. Data shown represent the number of autophagosomes (RFP+/GFP+) and autolysosomes (RFP+/GFP) as compared with control of a minimum of 45 cells from three independent experiments plotted as mean ± SEM. Statistical significance was analyzed by Student’s unpaired t test. ***, P < 0.001; **, P < 0.01; *, P < 0.05; ns = nonsignificant. (G) Immunostaining with anti-SQSTM1/p62 antibody in RFP-LC3 transfected HeLa cells treated with EACC (10 µM) for 2 h in starvation conditions. Scale = 15 µm. (H) Graph showing the mean intensity of colocalization between p62 and RFP-LC3 in control vs. EACC-treated group. Mean intensity of colocalization was measured using colocalization and analyze plug-ins of ImageJ software. Data shown here represents a minimum of 60 cells from three independent experiments plotted as mean ± SEM. Statistical significance was analyzed by Student’s unpaired t test. *, P < 0.05.
FIGURE 2:
FIGURE 2:
EACC blocks autophagosome–lysosome fusion but does not affect endo-lysosomal function. (A) RFP-LC3 transfected HeLa cells were immunostained with anti-LAMP1 antibody and treated with EACC (10 µM) for 2 h in starvation conditions. Scale = 10 µm. (B) Graph showing percent colocalization between LAMP1 and RFP-LC3 (autolysosomes) in starvation conditions and EACC treatment. The colocalized dots were counted using colocalization and cell counter plug-ins of ImageJ software and plotted with respect to the total number of LC3 puncta. Data shown here represent a minimum of 45 cells from three independent experiments plotted as mean ± SEM. Statistical significance was analyzed by Student’s unpaired t test. ***, P < 0.001. (C) HeLa cells were treated with EACC (10 µM) for 2 h in starvation conditions and immunoprecipitated with anti-LC3 antibody. Anti-mouse IgG was used as an isotype control. The immunoprecipitates were immunoblotted with anti-LAMP1 and anti-LC3 antibodies. (D) HeLa cells were treated with EACC (10 µM) for 2 h in starvation conditions and immunoblotted with anti-LAMP1 and anti–β-tubulin antibodies. (E) Relative levels of LAMP1:β-tubulin in untreated vs. treated samples were quantitated for three independent experiments. Statistical significance was analyzed by Student’s unpaired t test. ns = nonsignificant. (F) HeLa cells were treated with EACC (10 µM) for 2 h in starvation conditions and immunostained with anti-LAMP1 antibody. Scale = 10 µm. (G) Graph represents the mean intensity of LAMP1 staining that was measured using the analyze plug-in in ImageJ. Data shown here represent a minimum of 60 cells from three independent experiments plotted as mean ± SEM. Statistical significance was analyzed by Student’s unpaired t test. ns = nonsignificant. (H) HeLa cells were either treated with BafA1 (100 nM) in basal conditions or EACC (10 µM) in starvation conditions for 2 h. LysoTracker Deep Red (100 nM) was added in the media in the last 15 min of treatment. Cells were fixed and imaged. Scale = 15 µm. (I) Graph showing the mean intensity of LysoTracker staining measured as in D. Data shown here represent a minimum of 45 cells from three independent experiments plotted as mean ± SEM. Statistical significance was analyzed by Student’s unpaired t test. ***, P < 0.001; ns = nonsignificant. (J) Samples collected after EACC treatment were immunoblotted with anti–cathepsin B and anti–β-tubulin antibodies. (K) HeLa cells were serum starved for 3 h and either left untreated or pretreated with EACC before addition of EGF (100 ng/ml) for the indicated time periods. Samples were collected and immunoblotted for anti-EGFR and anti–β-tubulin antibodies. (L) Relative levels of EGFR:β-tubulin in untreated vs. treated samples were quantitated for three independent experiments.
FIGURE 3:
FIGURE 3:
EACC does not affect early autophagic events. (A) HeLa cells were either left untreated or treated with BafA1 (100 nM) or EACC (10 µM) for 2 h in starvation conditions. Samples were collected and immunoblotted with anti–phospho-P70S6K (T389), anti-P70S6K, anti–phospho-4EBP1, and anti-4EBP1 antibodies. (B) Samples collected after EACC treatment were immunoblotted with anti–phospho-ULK1 (S757), anti-ATG14, anti-ATG5, anti-ATG16L1, and anti–β-actin antibodies. (C) HeLa cells cotransfected with mCherry-DFCP1, GFP-LC3, and HA-ATG14 were either left untreated or treated with EACC and immunostained with anti-HA antibody. Scale = 15 µm, 1 µm. (D) Graph showing the percent of LC3 puncta colocalizing with DFCP1 and ATG14. This population represents immature autophagosomes. The colocalized dots were counted and plotted as in Figure 2B. Data shown here represent a minimum of 50 cells from three independent experiments plotted as mean ± SEM. Statistical significance was analyzed by Student’s unpaired t test. ns = nonsignificant. (E) GFP-LC3 transfected HeLa cells were treated with EACC (10 µM) for 2 h in starvation conditions and immunostained with anti-WIPI2 antibody. Scale = 15 µm. (F) Graph showing the percent of LC3 puncta colocalizing with WIPI2. This population represents omegasomes. The analysis was done similarly as in D. Data shown here represent a minimum of 45 cells from three independent experiments plotted as mean ± SEM. Statistical significance was analyzed by Student’s unpaired t test. ns = nonsignificant.
FIGURE 4:
FIGURE 4:
EACC inhibits autophagy by preventing SNARE Stx17 loading on autophagosomes. (A) HeLa cells cotransfected with FLAG-Stx17 and GFP-LC3 were treated with BafA1 (100 nM) or EACC (10 µM) for 2 h in starvation conditions and immunostained with anti-FLAG antibody. Scale = 15 µm, 1 µm. (B) Graph represents the number of colocalized dots of FLAG-Stx17 and GFP-LC3. The colocalized dots were counted as mentioned in Figure 2B. Data shown here represent a minimum of 45 cells from three independent experiments plotted as mean ± SEM. Statistical significance was analyzed by Student’s unpaired t test. ***, P < 0.001. (C) Samples from EACC- or BafA1-treated HeLa cells were immunoblotted with anti-Stx17 and anti–β-actin antibodies. (D) Co-IP analysis of interaction between FLAG-Stx17 and endogenous LC3B in HeLa cells either left untreated or treated with EACC. Relative levels of LC3B-II in untreated and EACC-treated cells are mentioned. (E) Data indicate mean ± SEM of relative levels of LC3B-II in FLAG-Stx17 IP normalized to input LC3B-II from three independent experiments. Statistical significance was analyzed by Student’s paired t test. *, P < 0.05. (F) HeLa cells cotransfected with MYC-Stx17, RFP-LC3, and FLAG-SNAP29 were either left untreated or treated with EACC and immunostained with anti-FLAG and anti-MYC antibodies. Scale = 15 µm. (G) Graph represents the percentage of LC3 puncta colocalizing with Stx17 and SNAP-29. The colocalized dots were counted as mentioned in Figure 2B. Data shown here represent a minimum of 45 cells from three independent experiments plotted as mean ± SEM. Statistical significance was analyzed by Student’s unpaired t test. ***, P < 0.001. (H) Graph showing the mean intensity of colocalization between FLAG-SNAP29 and MYC-Stx17 measured as explained in Figure 1H. Data shown here represent a minimum of 45 cells from three independent experiments plotted as mean ± SEM. Statistical significance was analyzed by Student’s unpaired t test. ns = nonsignificant. (I) HeLa cells cotransfected with FLAG-Stx17 and HA-ATG14 were treated with EACC and immunostained with anti-FLAG and anti-HA antibodies. Scale = 15 µm. (J) Graph showing the mean intensity of colocalization between FLAG-Stx17 and HA-ATG14 measured as explained in Figure 1H. Data shown here represent a minimum of 30 cells from three independent experiments plotted as mean ± SEM. Statistical significance was analyzed by Student’s unpaired t test. **, P < 0.01.
FIGURE 5:
FIGURE 5:
EACC does not affect RABs, tethers, and lysosomal SNARE but prevents their interaction with LC3 and Stx17. (A) GFP-LC3 transfected HeLa cells were treated with EACC and immunostained with anti-RAB7 antibody. Scale = 10 µm. (B) Graph represents the number of LC3 puncta colocalizing with RAB7. The colocalized dots were counted as in Figure 2B. Data shown here represent a minimum of 45 cells from three independent experiments plotted as mean ± SEM. Statistical significance was analyzed by Student’s unpaired t test. *, P < 0.05. (C) HeLa cells cotransfected with FLAG-Stx17 and HA-VPS33A were either left untreated or treated with EACC (10 µM) for 2 h. Scale = 10 µm. (D) Graph showing Pearson’s correlation coefficient (PCC) between Stx17 and VPS33A. PCC was measured using SoftWoRx software from DeltaVision. Data shown here represent a minimum of 45 cells from three independent experiments plotted as mean ± SEM. Statistical significance was analyzed by Student’s unpaired t test. *, P < 0.05. (E) GFP-VAMP8 transfected HeLa cells were immunostained with anti-LAMP1 antibody. Scale = 10 µm. (F) Graph representing the mean intensity of colocalization between LAMP1 and VAMP8. The mean intensity of colocalized dots was measured as in Figure 1H. Data shown here represent a minimum of 45 cells from three independent experiments plotted as mean ± SEM. Statistical significance was analyzed by Student’s unpaired t test. ns = nonsignificant. (G) HeLa cells cotransfected with FLAG-Stx17 and GFP-VAMP8 were either left untreated or treated with EACC. Scale = 10 µm. (H) Graph representing the mean intensity of colocalization between Stx17 and VAMP8. The mean intensity of colocalization was measured as in Figure 1H. Data shown here represent a minimum of 45 cells from three independent experiments plotted as mean ± SEM. Statistical significance was analyzed by Student’s unpaired t test. *, P < 0.05. (I) HeLa cells transfected with FLAG-Stx17 and HA-VPS33A or only HA-VPS33A were either left untreated or treated with EACC. IP was performed using FLAG-tagged magnetic beads and the levels of HA-VPS33A and FLAG-Stx17 were checked by immunoblotting. (J) HeLa cells transfected with FLAG-Stx17 and GFP-VAMP8 or FLAG-Stx17 and empty GFP vector were either left untreated or treated with EACC. IP was performed using control agarose beads or GFP-Trap beads and the levels of GFP-VAMP8 and FLAG-Stx17 were checked by immunoblotting.
FIGURE 6:
FIGURE 6:
The action of EACC is reversible. (A) We divided EACC-treated cells into three subgroups. In the first group, cells in starvation media were treated with EACC for 1 h and lysates were collected. In the second group, after a similar treatment with EACC for 1 h, cells were washed with DPBS and kept in starvation medium without EACC for 3 h and lysates were collected. In the third group, the treatment with EACC was allowed to go on for 4 h and lysates were collected after that. All the lysates were probed for LC3B-II expression. (B) Relative levels of LC3-II:β-actin in untreated vs. treated samples were quantitated for three independent experiments. *, P < 0.05; ns = nonsignificant (two-way ANOVA, replicate means compared with Bonferroni posttest). (C) HeLa cells were transfected with tandem-tagged mRFP-GFP-LC3 construct for 48 h and treatment was carried out as explained above in A. Scale: 15 µm. (D, E) The autophagosomes (RFP+/GFP+ structures) and autolysosomes (RFP+/GFP structures) per cell in various treatment conditions were counted as mentioned in Figure 1F. Data shown represent the number of autophagosomes (RFP+/GFP+) and autolysosomes (RFP+/GFP) for a minimum of 45 cells from three independent experiments plotted as mean ± SEM. Statistical significance was analyzed by Student’s unpaired t test. *, P < 0.05; ns = nonsignificant. (F) HeLa cells transfected with FLAG-Stx17 and GFP-LC3 were treated with EACC (10 µM) as explained above and immunostained with anti-FLAG antibody. Scale: 10 µm. (G, H) Graph represents the number of LC3 puncta colocalizing with Stx17. The colocalized dots were counted as mentioned in Figure 2B. Data shown here represent a minimum of 45 cells from three independent experiments plotted as mean ± SEM. Statistical significance was analyzed by Student’s unpaired t test. ***, P < 0.001; ns = nonsignificant.

References

    1. Arasaki K, Mikami Y, Shames SR, Inoue H, Wakana Y, Tagaya M. (2017). Legionella effector Lpg1137 shuts down ER-mitochondria communication through cleavage of syntaxin 17. Nat Commun , 15406. - PMC - PubMed
    1. Bento CF, Renna M, Ghislat G, Puri C, Ashkenazi A, Vicinanza M, Menzies FM, Rubinsztein DC. (2016). Mammalian autophagy: how does it work? Annu Rev Biochem , 685–713. - PubMed
    1. Bonifacino JS, Glick BS. (2004). The mechanisms of vesicle budding and fusion. Cell , 153–166. - PubMed
    1. Cai H, Reinisch K, Ferro-Novick S. (2007). Coats, tethers, Rabs, and SNAREs work together to mediate the intracellular destination of a transport vesicle. Dev Cell , 671–682. - PubMed
    1. Darsow T, Rieder SE, Emr SD. (1997). A multispecificity syntaxin homologue, Vam3p, essential for autophagic and biosynthetic protein transport to the vacuole. J Cell Biol , 517–529. - PMC - PubMed

Publication types

LinkOut - more resources