Meta-Analysis
. 2019 Jun 12;14(6):e0218263.
doi: 10.1371/journal.pone.0218263. eCollection 2019.

Meta-analysis of genome-wide association studies for loin muscle area and loin muscle depth in two Duroc pig populations

Affiliations
Meta-Analysis

Meta-analysis of genome-wide association studies for loin muscle area and loin muscle depth in two Duroc pig populations

Zhanwei Zhuang et al. PLoS One. .

Abstract

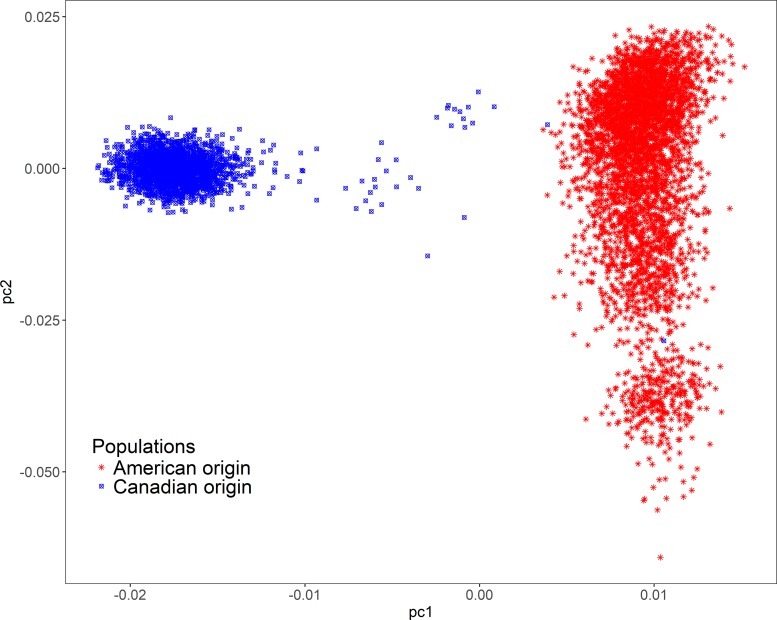
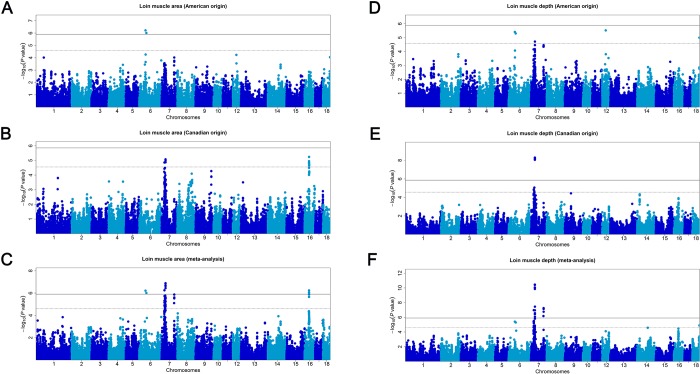
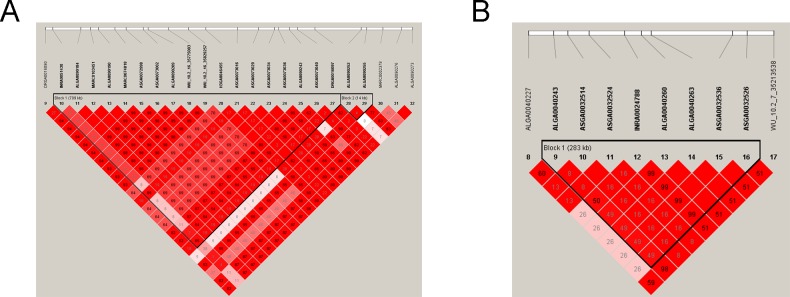
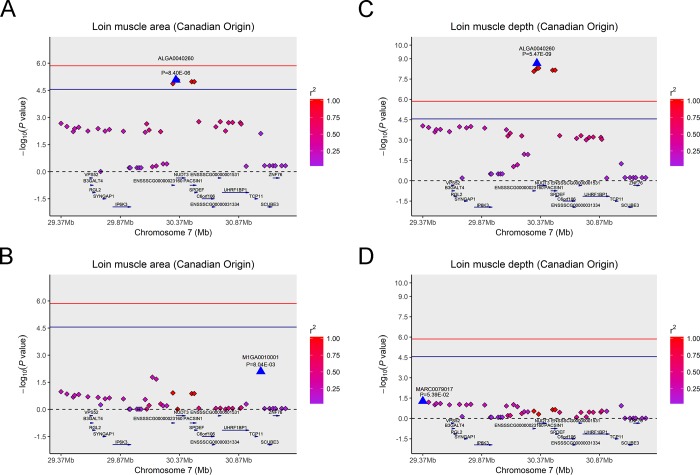
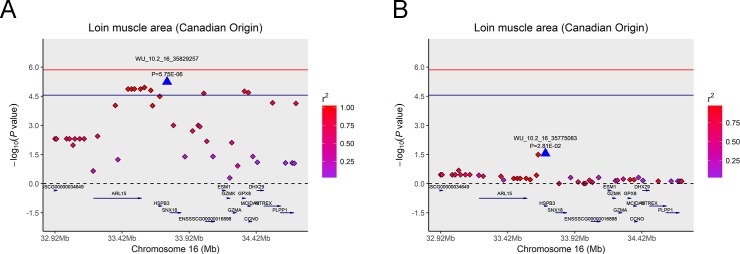
Loin muscle area (LMA) and loin muscle depth (LMD) are important traits influencing the production performance of breeding pigs. However, the genetic architecture of these two traits is still poorly understood. To discern the genetic architecture of LMA and LMD, a material consisting of 6043 Duroc pigs belonging to two populations with different genetic backgrounds was collected and applied in genome-wide association studies (GWAS) with a genome-wide distributed panel of 50K single nucleotide polymorphisms (SNPs). To improve the power of detection for common SNPs, we conducted a meta-analysis in these two pig populations and uncovered additional significant SNPs. As a result, we identified 75 significant SNPs for LMA and LMD on SSC6, 7, 12, 16, and 18. Among them, 25 common SNPs were associated with LMA and LMD. One pleiotropic quantitative trait locus (QTL), which was located on SSC7 with a 283 kb interval, was identified to affect LMA and LMD. Marker ALGA0040260 is a key SNP for this QTL, explained 1.77% and 2.48% of the phenotypic variance for LMA and LMD, respectively. Another genetic region on SSC16 (709 kb) was detected and displayed prominent association with LMA and the peak SNP, WU_10.2_16_35829257, contributed 1.83% of the phenotypic variance for LMA. Further bioinformatics analysis determined eight promising candidate genes (GCLC, GPX8, DAXX, FGF21, TAF11, SPDEF, NUDT3, and PACSIN1) with functions in glutathione metabolism, adipose and muscle tissues development and lipid metabolism. This study provides the first GWAS for the LMA and LMD of Duroc breed to analyze the underlying genetic variants through a large sample size. The findings further advance our understanding and help elucidate the genetic architecture of LMA, LMD and growth-related traits in pigs.


Conflict of interest statement

The authors have declared that no competing interests exist.

Figures

Fig 1
Fig 1. Population structure for two Duroc populations.
pc1 = first principal component; pc2 = second principal component. The first two PCs derived from the genomic kinship matrix were extracted to assess the population structure. In this study, the two Duroc pig populations can be clearly identified via principal component analysis.
Fig 2
Fig 2. Manhattan plots of genome-wide association studies for LMA and LMD in the two Duroc pig populations.
The x-axis represents the chromosomes, and the y-axis represents the -log10(P-value). Different colors indicate various chromosomes. The solid and dashed lines indicate the 5% genome-wide and chromosome-wide Bonferroni corrected thresholds, respectively. The thresholds of the genome-wide and the chromosome-wide levels are P < 1.29E-06 and P < 2.58E-05 (American population); P < 1.39E-06 and P < 2.79E-05 (Canadian population); P < 1.25E-06 and P < 2.50E-05 (meta-analysis). Manhattan plots on the left are shown for the single-trait association analysis in (A) American original population, (B) Canadian original population, and (C) meta-analysis for LMA. Manhattan plots on the right are shown for the single-trait association analysis in (D) American original population, (E) Canadian original population, and (F) meta-analysis for LMD.
Fig 3
Fig 3
Linkage disequilibrium (LD) blocks in the significant region on SSC16 (A) and SSC7. (B). LD blocks are marked with triangles. Values in boxes are LD (r2) between SNP pairs and the boxes are colored according to the standard Haploview color scheme. The complete red boxes with no numbers indicated that SNP pairs have complete linkage disequilibrium. Annotated genes in the chromosomal region were retrieved from the Ensemble genome browser (www.ensembl.org/Sus_scrofa/Info/Index).
Fig 4
Fig 4. Regional association plot of the primary signal (ALGA0040260) associated with LMA and LMD at SSC7.
For each plot, the -log10(observed P-values) of SNPs (y-axis) are presented according to their chromosomal position (x-axis). The red line and darkblue line indicate the genome-wide significance level (P < 1.39E-06) and the chromosome-wide significance level (P < 2.79E-05), respectively. The primary SNPs are denoted by large blue triangles. SNPs are represented by colored rhombi according to the target SNP with which they were in strongest LD. The left panel of the figure shows the association results for LMA (A) before and (B) after conditional analysis on ALGA0040260. The right panel of the figure shows the association results for LMD (C) before and (D) after conditional analysis on ALGA0040260. The P-value of association results for (B) LMA and (D) LMD after conditional analysis on ALGA0040260 fell below the predicted threshold.
Fig 5
Fig 5. Regional association plot of the primary signal (WU_10.2_16_35829257) associated with LMA at SSC16.
For each plot, the -log10(observed P-values) of SNPs (y-axis) are presented according to their chromosomal position (x-axis). The red line and darkblue line indicate the genome-wide significance level (P < 1.39E-06) and the chromosome-wide significance level (P < 2.79E-05), respectively. The primary SNPs are denoted by large blue triangles. SNPs are represented by colored rhombi according to the target SNP with which they were in strongest LD. The left panel of the figure shows the association results for LMA (A) before conditional analysis on ALGA0040260. In the right panel of the figure (B), the P-value of corresponding SNPs fell below the predicted threshold.
Fig 6
Fig 6. Heritabilities of LMA and LMD by chromosome in the two populations.
Estimates of chromosome-wide heritability on LMA and LMD are drawn against the chromosome length (x-axis). The blue line represents heritability regressed on chromosome length. Grey area around the blue line is the 95% confidence level interval for prediction from the linear model. In the figure, (A) and (B) show the heritability that each chromosome explained for LMA in the American and Canadian original populations, respectively. (C) and (D) show the heritability that each chromosome explained for LMD in the American and Canadian original populations, respectively.

Similar articles

Cited by

References

    1. Bendixen E, Danielsen M, Larsen K, Bendixen C. Advances in porcine genomics and proteomics-a toolbox for developing the pig as a model organism for molecular biomedical research. Brief Funct Genomics. 2010;9(3):208–19. 10.1093/bfgp/elq004 WOS:000278232900003. - DOI - PubMed
    1. Wang K, Liu D, Hernandez-Sanchez J, Chen J, Liu C, Wu Z, et al. Genome Wide Association Analysis Reveals New Production Trait Genes in a Male Duroc Population. PLoS One. 2015;10(9):e0139207 10.1371/journal.pone.0139207 - DOI - PMC - PubMed
    1. Friesen KG, Nelssen JL, Goodband RD, Tokach MD, Unruh JA, Kropf DH, et al. The effect of dietary lysine on growth, carcass composition, and lipid metabolism in high-lean growth gilts fed from 72 to 136 kilograms. J Anim Sci. 1995;73(11):3392–401. 10.2527/1995.73113392x . - DOI - PubMed
    1. He Y, Ma J, Zhang F, Hou L, Chen H, Guo Y, et al. Multi-breed genome-wide association study reveals heterogeneous loci associated with loin eye area in pigs. J Appl Genet. 2016;57(4):511–8. 10.1007/s13353-016-0351-8 . - DOI - PubMed
    1. Yang XR, Yu B, Mao XB, Zheng P, He J, Yu J, et al. Lean and obese pig breeds exhibit differences in prenatal gene expression profiles of muscle development. Animal. 2015;9(1):28–34. 10.1017/S1751731114002316 . - DOI - PubMed

Publication types