. 2019 Jun 12;15(6):e1007852.
doi: 10.1371/journal.ppat.1007852. eCollection 2019 Jun.

The landscape of transcription initiation across latent and lytic KSHV genomes

Affiliations

The landscape of transcription initiation across latent and lytic KSHV genomes

Xiang Ye et al. PLoS Pathog. .

Abstract

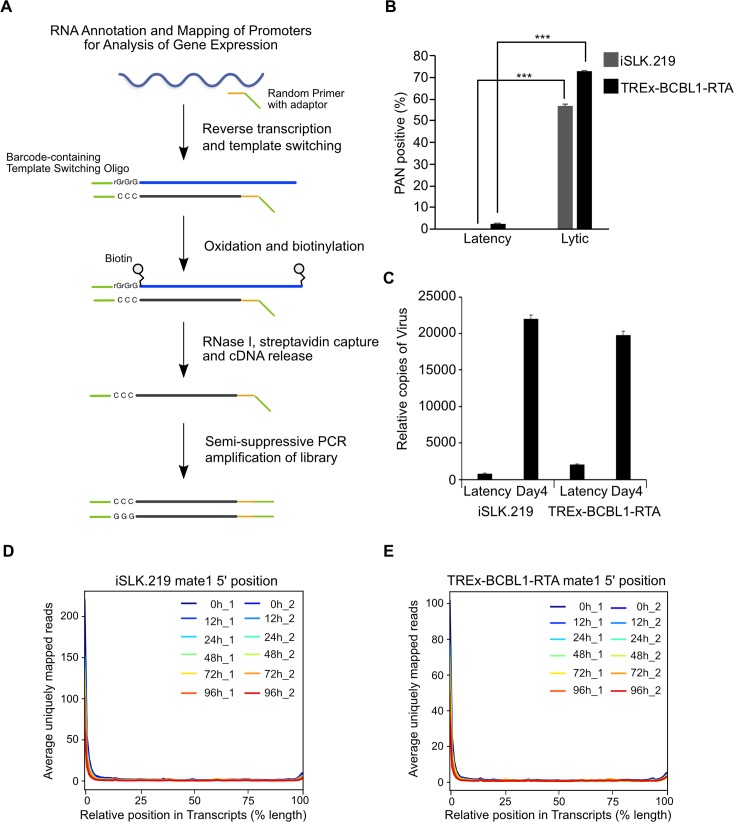
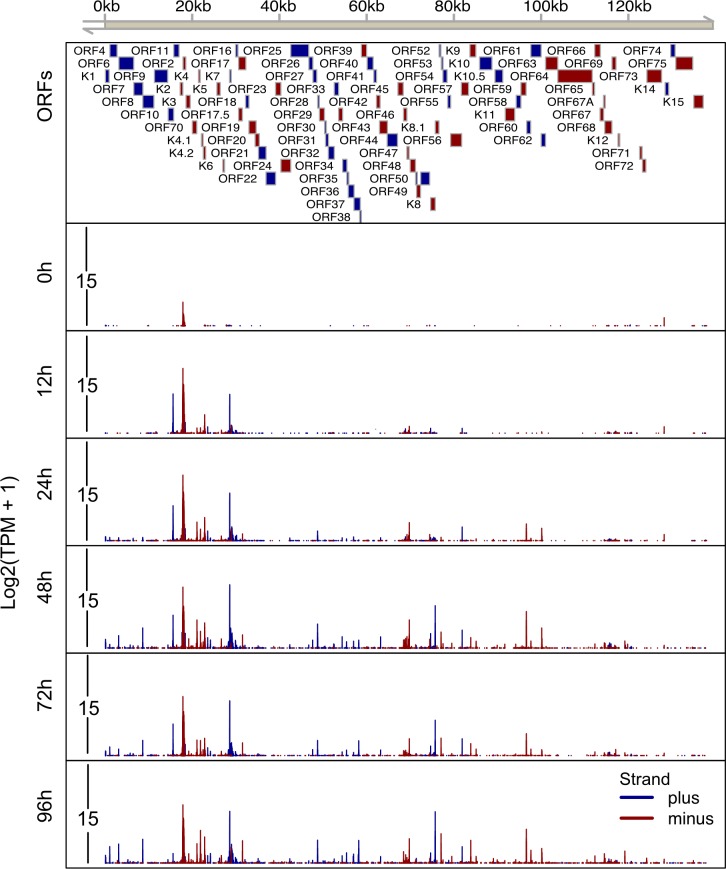
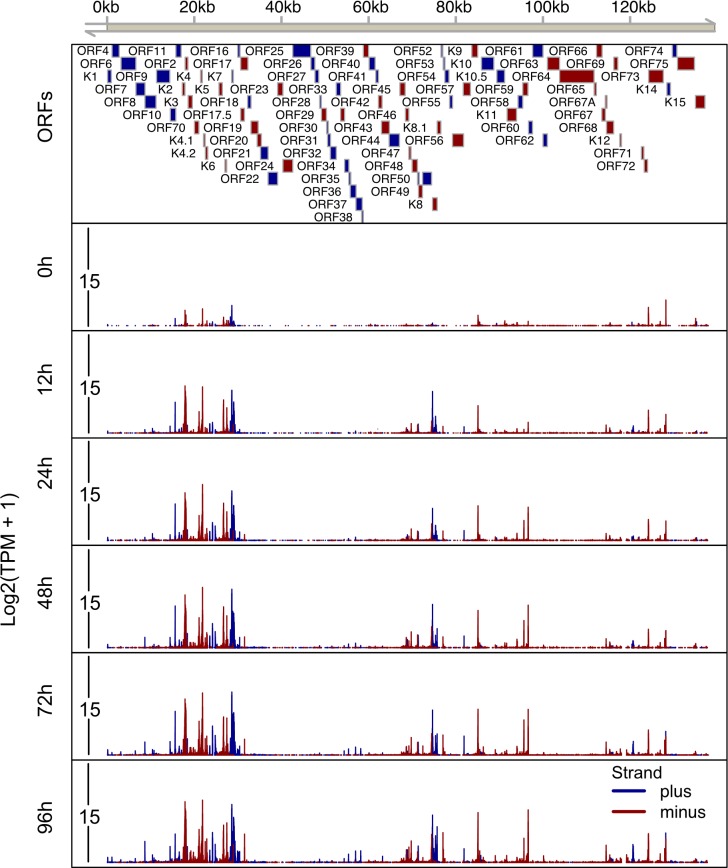
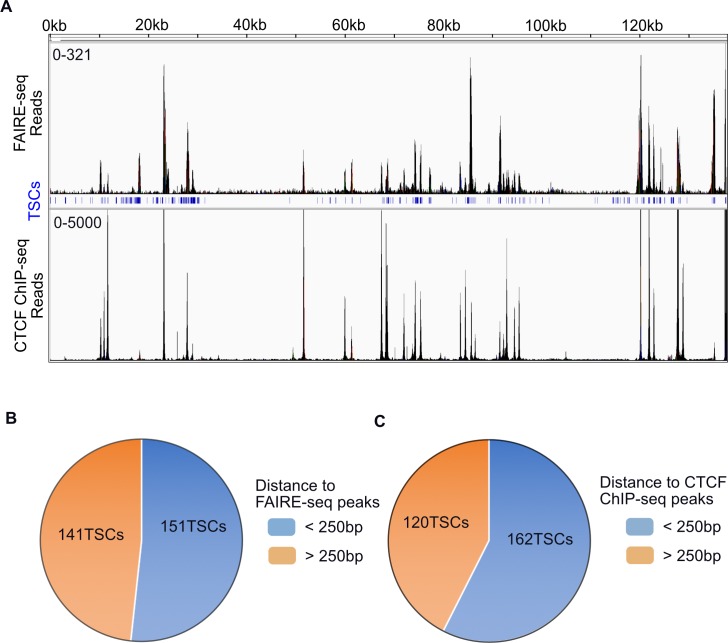
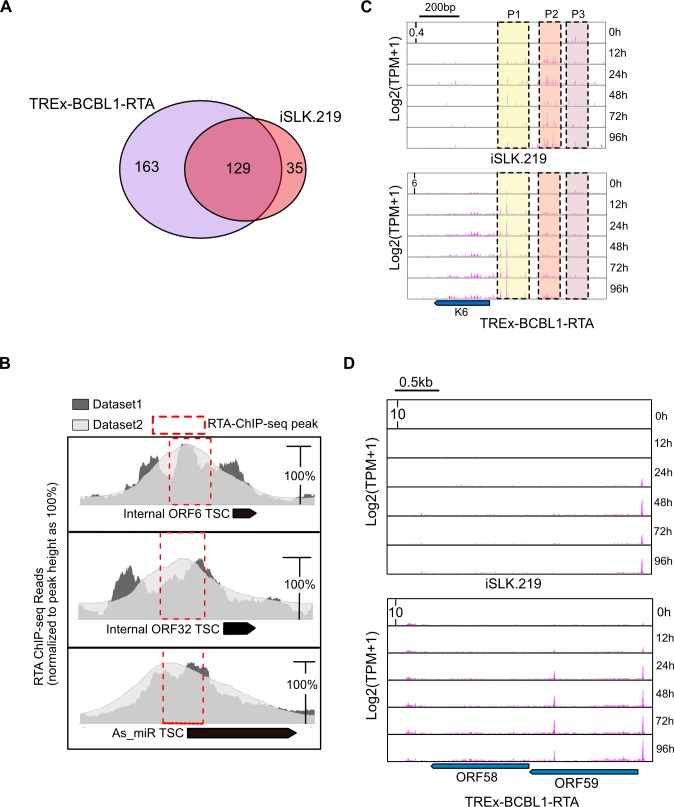
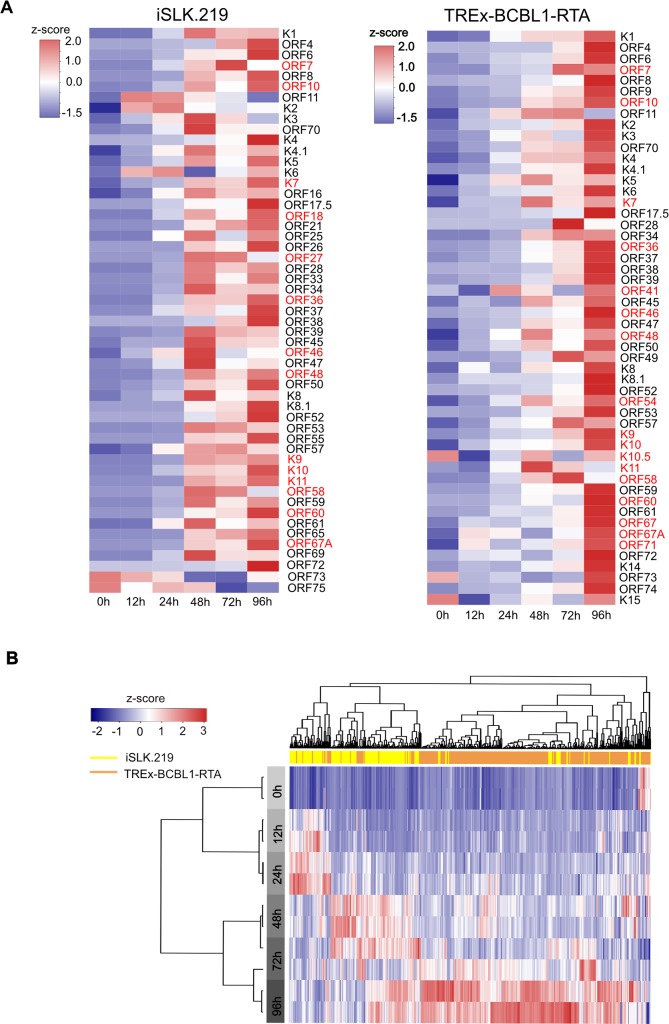
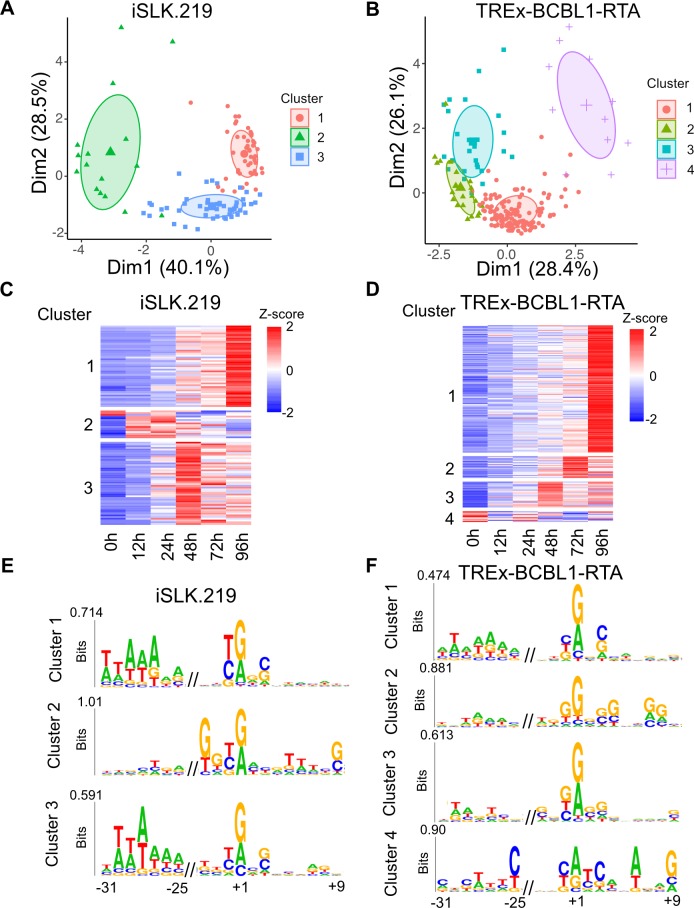
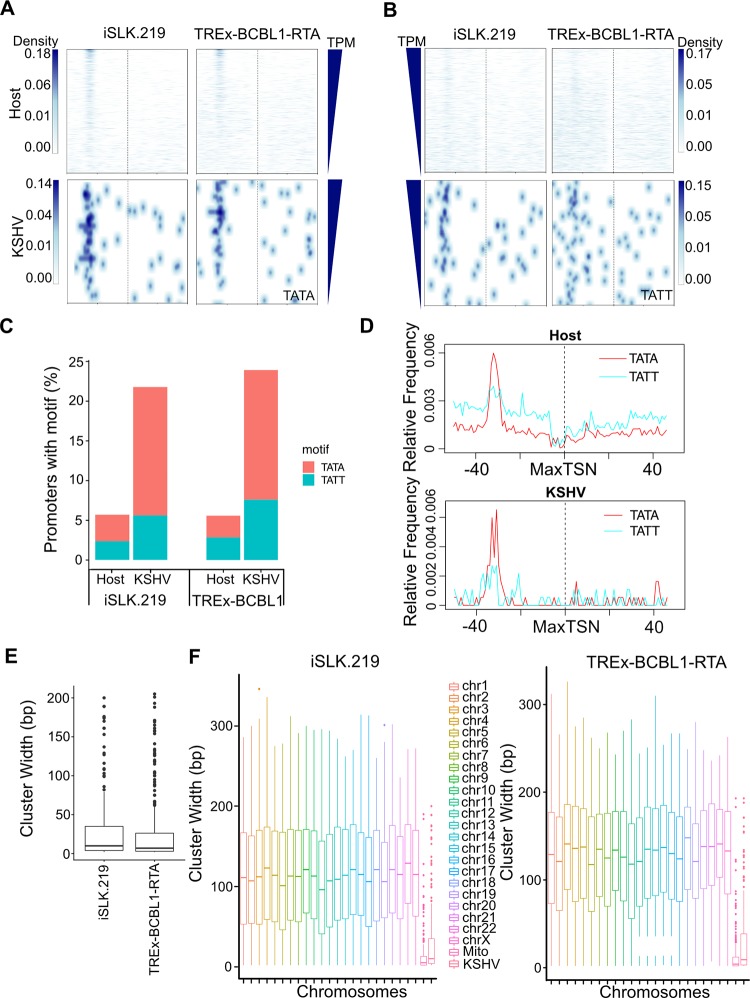
Precise promoter annotation is required for understanding the mechanistic basis of transcription initiation. In the context of complex genomes, such as herpesviruses where there is extensive genic overlap, identification of transcription start sites (TSSs) is particularly problematic and cannot be comprehensively accessed by standard RNA sequencing approaches. Kaposi's sarcoma-associated herpesvirus (KSHV) is an oncogenic gammaherpesvirus and the etiological agent of Kaposi's sarcoma and the B cell lymphoma primary effusion lymphoma (PEL). Here, we leverage RNA annotation and mapping of promoters for analysis of gene expression (RAMPAGE) and define KSHV TSSs transcriptome-wide and at nucleotide resolution in two widely used models of KSHV infection, namely iSLK.219 cells and the PEL cell line TREx-BCBL1-RTA. By mapping TSSs over a 96 h time course of reactivation we confirm 48 of 50 previously identified TSSs. Moreover, we identify over 100 novel transcription start site clusters (TSCs) in each cell line. Our analyses identified cell-type specific differences in TSC positions as well as promoter strength, and defined motifs within viral core promoters. Collectively, by defining TSSs at high resolution we have greatly expanded the transcriptional landscape of the KSHV genome and identified transcriptional control mechanisms at play during KSHV lytic reactivation.


Conflict of interest statement

The authors have declared that no competing interests exist.

Figures

Fig 1
Fig 1. RAMPAGE enables transcription start site identification at nucleotide resolution.
(A) Schematic illustration of the RAMPAGE method. (B) iSLK.219 and TREx-BCBL1-RTA cells were reactivated for 72 h and the percentage of lytic reactivated cells was quantified by PAN RNA FISH-FLOW. (C) Virions were isolated from supernatants of iSLK.219 and TREx-BCBL1-RTA cells induced for 96 h and KSHV genomes were quantified by qPCR against ORF52. (D and E) Average uniquely mapped reads by position for endogenous transcripts, for libraries generated from (D) iSLK.219 and (E) TREx-BCBL1-RTA RNA. Error bars in all panels represent mean±SD from three independent experiments. p Values were determined by the Student’s t test ***, p < 0.001.
Fig 2
Fig 2. High resolution map of transcription start sites on the KSHV.219 genome in iSLK.219 cells.
Total RNA was isolated from iSLK.219 cells at 0h, 12h, 24h, 48h, 72h and 96h post-dox induced lytic reactivation and RAMPAGE libraries were prepared and sequenced. The 5’ signal of read 1, which corresponds to transcriptional start sites, were mapped on the KSHV genome (GQ994935.1). A schematic of the KSHV genome including genomic coordinates of annotated ORFs is depicted on the top horizontal axis. The lower 6 tracks depict the transcripts initiated from every nucleotide across the whole KSHV genome at each time point. The Y axis depicts the log2 transformed TPM value. Blue boxes/lines indicate ORFs/TSSs on the plus strand, red boxes/lines indicate ORFs/TSSs on the minus strand.
Fig 3
Fig 3. High resolution mapping of transcription start sites on the KSHV genome in TREx-BCBL1-RTA cells.
Total RNA was isolated from TREx-BCBL1-RTA cells at 0h, 12h, 24h, 48h, 72h and 96h post-dox induced lytic reactivation and RAMPAGE libraries were prepared and sequenced. The 5’ signal of read 1, which corresponds to transcriptional start sites, were mapped on the KSHV genome (GQ994935.1). A schematic of the KSHV genome including genomic coordinates of annotated ORFs is depicted on the top horizontal axis. The lower 6 tracks transcripts initiated from every nucleotide across the whole KSHV genome at each time point. The Y axis depicts the log2 transformed TPM value. Blue boxes/lines indicate ORFs/TSSs on the plus strand, red boxes/lines indicate ORFs/TSSs on the minus strand.
Fig 4
Fig 4. KSHV TSCs are located in regions of open chromatin and CTCF binding.
(A) Overlap of RAMPAGE identified TSCs with FAIRE-seq and CTCF ChIP-seq signal in TREx-BCBL1-RTA cells. The top coordinates mark positions on KSHV genome, middle blue track shows the position of TSCs defined by RAMPAGE in TREx-BCBL1-RTA cell. (B) Pie chart depiction of the number of viral TSCs within 250bp of FAIRE-seq peaks in TREx-BCBL1-RTA. (C) Pie chart depiction of the number of viral TSCs within 250bp of CTCF ChIP-Seq peaks in TREx-BCBL1-RTA. The enrichment of TSCs on FAIRE-seq (p < 0.00001) and CTCF ChIP-seq peaks (p < 0.00001) were tested by permutations.
Fig 5
Fig 5. Cell-type specific TSC usage in KSHV-infected cells.
(A) Venn diagram illustrating the overlap of viral TSCs in iSLK.219 and TREx-BCBL1-RTA cells. (B) RTA ChIP-seq read pile associated with three novel TSCs. The peak summit of each RTA ChIP-seq dataset was normalized to 100% for comparison. Black rectangles mark the position of RAMPAGE identified TSCs. Red-dashed boxes represent the location of RTA ChIP-seq peaks identified by MACs2. (C) RAMPAGE 5' signal at the K6 locus in iSLK.219 and TREx-BCBL1-RTA cells. The 5' signal on y axis is log transformed TPM value at single nucleotide resolution. The dash-line rectangle marks the primary TSCs (promoters), P1, P2, P3. (D) 5’ nucleotide signal of RAMPAGE read 1 associated with ORF58 and ORF59 in TREx-BCBL1-RTA, and iSLK.219 cells. The black bar on the top of the panel indicates the scale, the middle six tracks depict the six different time points post-dox induction. The location of the coding regions for ORF58 and ORF59, which is present on the minus strand, is shown below the panel.
Fig 6
Fig 6. Kinetics of KSHV gene expression leveraging RAMPAGE.
(A) Heat map illustrating the expression level of known ORFs based on promoter activity at the indicated time points. iSLK.219 cells (left panel) and TREx-BCBL1-RTA cells (right panel). The TSCs of ORFs in red are identified for the first time in this study. (B) Unsupervised hierarchical clustering analysis of transcriptional activity of all viral TSCs identified by RAMPAGE. The top horizontal bar indicates the cell lines: yellow and tan represent iSLK.219 and TREx-BCBL1-RTA cells, respectively. The left gray bar indicates the time point of sampling after doxycycline induced lytic reactivation. For all heat maps TPM expressions of TSCs were scaled to Z score before mapping.
Fig 7
Fig 7. K-means and motif analysis of cis-elements within KSHV promoters.
(A and B) PCA plot of all KSHV TSCs expression for (A) iSLK.219 and (B) TREx-BCBL1-RTA cells. (C and D) Corresponding heat map of the KSHV TSCs identified for (C) iSLK.219 and (D) TREx-BCBL1-RTA cells. Clusters identified by K-means are shown. (E and F) Sequences and up and downstream of the MaxTSN within each cluster were extracted and subjected to kplogo analysis. Ultra-short motifs identified in (E) iSLK.219 and (F) TREx-BCBL1-RTA cells are depicted.
Fig 8
Fig 8. Comparison between host and KSHV cis-element use and TSC architecture.
(A) Heatmap showing the TATA box motif density 50 bp up- and downstream of MaxTSN in iSLK.219 and TREx-BCBL1-RTA cells. (B) Heatmap showing the TATT box motif density 50bp up- and downstream of MaxTSN in iSLK.219 and TREx-BCBL1-RTA cells. In both A and B the TSCs were order by the expression value of MaxTSN. (C) Percentage of TSCs with TATA and TATT motifs between 20-31bp upstream of the MaxTSN for host and KSHV. (D) Frequency of TATA and TATT motifs found relative to MaxTSN of TSCs from host and KSHV in TREx-BCBL1-RTA cell. (E) Cluster width of KSHV TSCs from iSLK.219 and TREx-BCBL1-RTA cells. (F) Cluster width of TSCs identified from host chromosomes and KSHV genome for iSLK.219 and TREx-BCBL1-RTA cells.

References

    1. Haberle V, Stark A. Eukaryotic core promoters and the functional basis of transcription initiation. Nat Rev Mol Cell Biol. 2018;19(10):621–37. 10.1038/s41580-018-0028-8 - DOI - PMC - PubMed
    1. Shiraki T, Kondo S, Katayama S, Waki K, Kasukawa T, Kawaji H, et al. Cap analysis gene expression for high-throughput analysis of transcriptional starting point and identification of promoter usage. Proc Natl Acad Sci U S A. 2003;100(26):15776–81. Epub 2003/12/08. 10.1073/pnas.2136655100 - DOI - PMC - PubMed
    1. Kawaji H, Kasukawa T, Forrest A, Carninci P, Hayashizaki Y. The FANTOM5 collection, a data series underpinning mammalian transcriptome atlases in diverse cell types. Sci Data. 2017;4:170113 Epub 2017/08/29. 10.1038/sdata.2017.113 - DOI - PMC - PubMed
    1. Carninci P, Sandelin A, Lenhard B, Katayama S, Shimokawa K, Ponjavic J, et al. Genome-wide analysis of mammalian promoter architecture and evolution. Nat Genet. 2006;38(6):626–35. Epub 2006/04/28. 10.1038/ng1789 . - DOI - PubMed
    1. Frith MC, Valen E, Krogh A, Hayashizaki Y, Carninci P, Sandelin A. A code for transcription initiation in mammalian genomes. Genome Res. 2008;18(1):1–12. Epub 2007/11/21. 10.1101/gr.6831208 - DOI - PMC - PubMed

Publication types

MeSH terms