. 2019 Jul-Sep;42(3):611-623.
doi: 10.1590/1678-4685-GMB-2018-0235. Epub 2019 Nov 14.

Genome-wide identification and characterization of R2R3-MYB genes in Medicago truncatula

Affiliations

Genome-wide identification and characterization of R2R3-MYB genes in Medicago truncatula

Wei Li et al. Genet Mol Biol. 2019 Jul-Sep.

Abstract

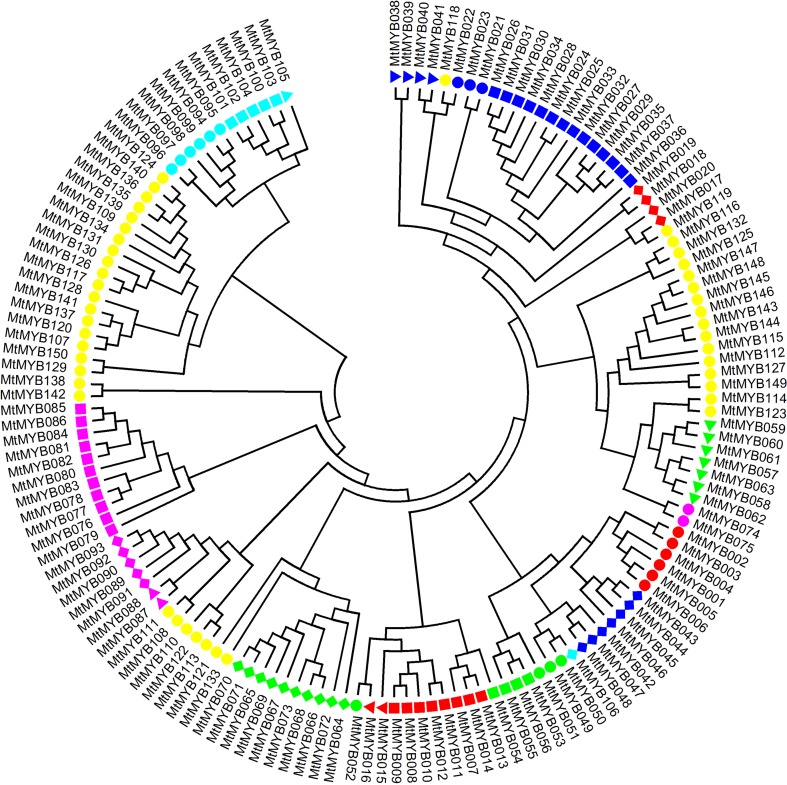
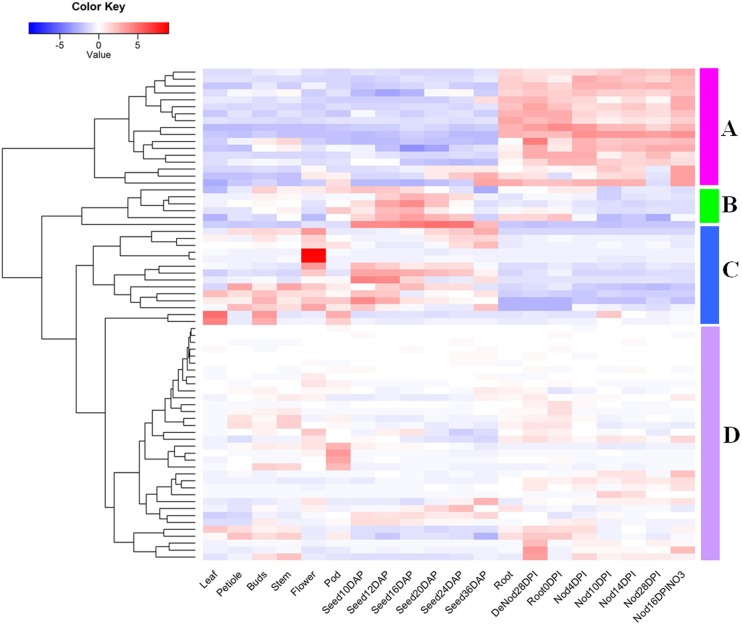
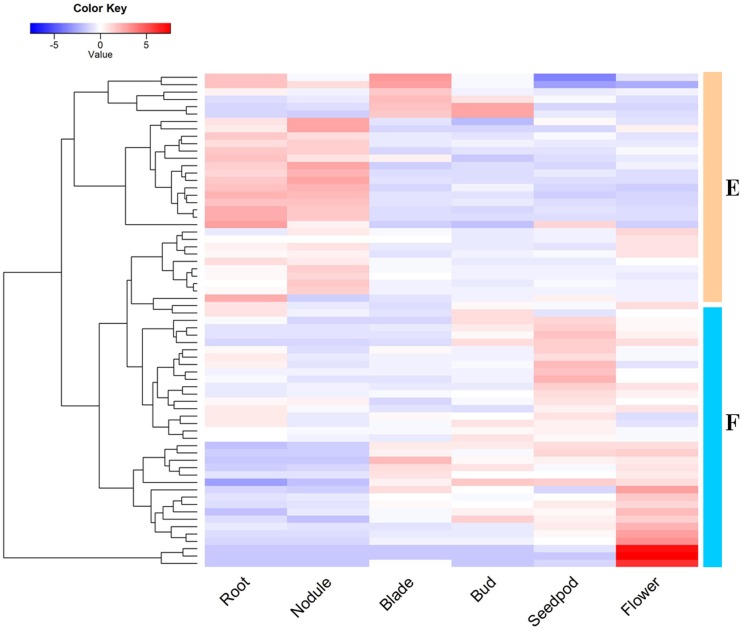
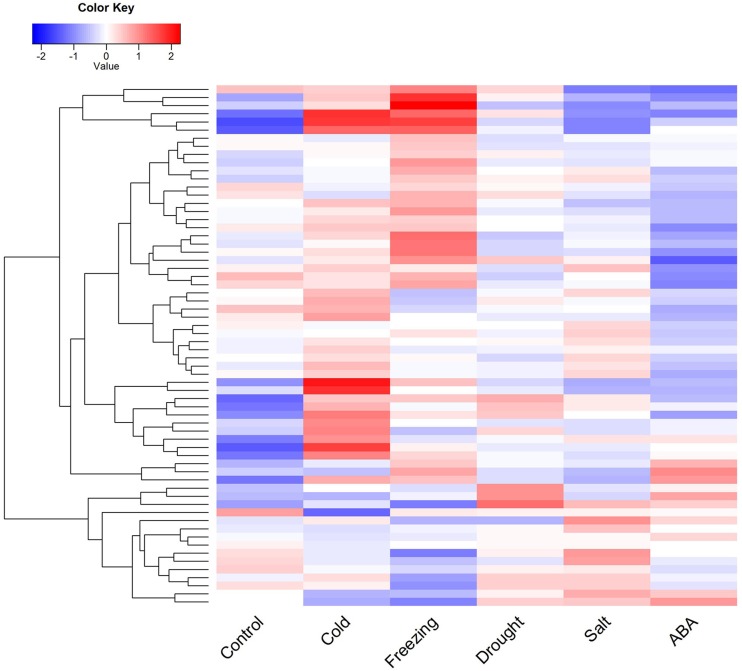
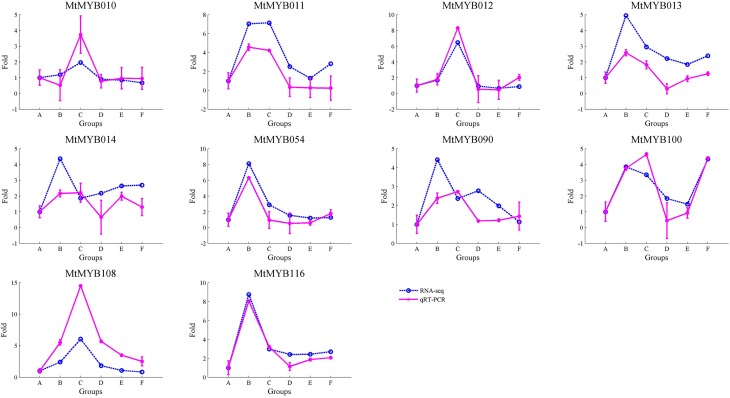
MYB is a large family of plant transcription factors. Its function has been identified in several plants, while there are few reports in Medicago truncatula. In this study, we used RNA-seq data to analyze and identify R2R3-MYB genes in the genome of Medicago truncatula. Phylogenetic analysis classified 150 MtMYB genes into 21 subfamilies with homologs. Out of the 150 MtMYB genes, 139 were distributed among 8 chromosomes, with tandem duplications (TD) and segment duplications (SD). Microarray data were used for functional analysis of the MtMYB genes during growth and developmental processes providing evidence for a role in tissues differentiation, seed development processes, and especially the nodulation process. Furthermore, we investigated the expression of MtMYB genes in response to abiotic stresses using RNA-seq data, which confirmed the critical roles in signal transduction and regulation processes under abiotic stress. We used quantitative real-time PCR (qRT-PCR) to validate expression profiles. The expression pattern of M. truncatula MYB genes under different abiotic stress conditions suggest that some may play a major role in cross-talk among different signal transduction pathways in response to abiotic stresses. Our study will serve as a foundation for future research into the molecular function of M. truncatula R2R3-MYB genes.


Figures

Figure 1
Figure 1. Phylogenetic tree analysis of the R2R3-MYB transcription factors in Medicago truncatula. Red circle: subgroup 1; red square: subgroup 2; red triangle: subgroup 3; red diamond: subgroup 4; blue circle: subgroup five; blue square subgroup six; blue indicates subgroup seven; blue diamond subgroup nine; green circular subgroup ten; green square subgroup 11; green triangle: subgroup 13; green diamond: subgroup 14; pink circle: subgroup 16; pink square: subgroup 18; pink triangle: subgroup 19; pink diamond: subgroup 20; cyan circle: subgroup 21; cyan square: subgroup 22; cyan triangle: subgroup 23; cyan diamond: subgroup 24; yellow circle: subgroup 25.
Figure 2
Figure 2. Chromosome distribution and expansion analysis of R2R3-MYB transcription factors in Medicago truncatula. The genome locations of R2R3-MYB transcription factors were retrieved from Medicago genome website, and the duplications between R2R3-MYB genes identified using software PGDD and BLAST analysis.
Figure 3
Figure 3. Microarray expression data of R2R3-MYB transcription factors in Medicago truncatula. The heatmap was generated using R gplots package. The expressional values of 71 R2R3-MYB genes were retrieved from MtGEA, and they were normalized and used as input, red represents high expressional levels, while blue represents low expressional level.
Figure 4
Figure 4. RNA-seq analysis of R2R3-MYB transcription factors in Medicago truncatula. The heatmap was generated using R gplots package, and the FPKM values of Medicago truncatula genes were evaluated and normalized based RNA-seq data from NCBI SRA database. The plot data included expressional profiles of 67 R2R3-MYB genes in six tissues, and red represents high expressional levels, while blue represents low expressional level.
Figure 5
Figure 5. Expression profile analysis of R2R3-MYB transcription factors in response to abiotic stresses in Medicago truncatula. The heatmap was generated using R gplots package, and the FPKM values of Medicago truncatula genes were evaluated and normalized based RNA-seq data from NCBI SRA database. The plot data included expressional profiles of 64 R2R3-MYB genes in response to abiotic stress, and red represents high expressional levels, while blue represents low expressional level.
Figure 6
Figure 6. qRT-PCR validation of R2R3-MYB transcription factors in Medicago truncatula. All expressional levels of each R2R3-MYB genes were normalized with control expression value (group A) set as one. The groups B (cold stress), C (freezing stress), D (drought stress), E (salt stress), and F (ABA treatment) were compared with control group, and fold-changes were calculated. The fold-change data was used to create the plot, and the blue indicates RNA-seq results, while pink indicates qRT-PCR analysis results.

References

    1. Al-Attala MN, Wang X, Abou-Attia MA, Duan X, Kang Z. A novel TaMYB4 transcription factor involved in the defence response against Puccinia striiformis f. sp. tritici and abiotic stresses. Plant Mol Biol. 2014;84:589–603. - PubMed
    1. Ambawat S, Sharma P, Yadav NR, Yadav RC. MYB transcription factor genes as regulators for plant responses: an overview. Physiol Mol Biol Plants. 2013;19:307–321. - PMC - PubMed
    1. Benedito VA, Torres-Jerez I, Murray JD, Andriankaja A, Allen S, Kakar K, Wandrey M, Verdier J, Zuber H, Ott T, et al. A gene expression atlas of the model legume Medicago truncatula . Plant J. 2008;55:504–513. - PubMed
    1. Cannon SB, Mitra A, Baumgarten A, Young ND, May G. The roles of segmental and tandem gene duplication in the evolution of large gene families in Arabidopsis thaliana . BMC Plant Biol. 2004;4:10. - PMC - PubMed
    1. Chen BJ, Wang Y, Hu YL, Wu Q, Pin ZP. Cloning and characterization of a drought inducible MYB gene from Boea crassifolia . Plant Sci. 2005;168:493–500.