

Optimized quantification of spin relaxation times in the hybrid state
- PMID: 31189025
- PMCID: PMC7301573
- DOI: 10.1002/mrm.27819
Optimized quantification of spin relaxation times in the hybrid state
Abstract
Purpose: The optimization and analysis of spin ensemble trajectories in the hybrid state-a state in which the direction of the magnetization adiabatically follows the steady state while the magnitude remains in a transient state.
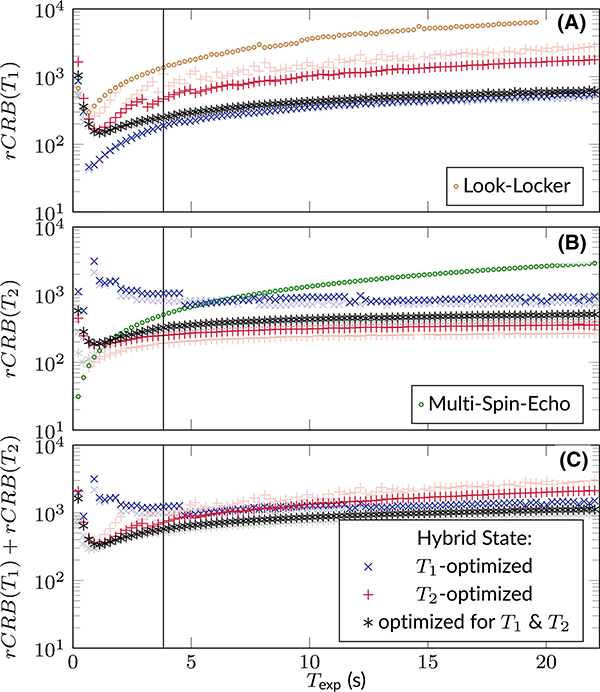
Methods: Numerical optimizations were performed to find spin ensemble trajectories that minimize the Cramér-Rao bound for -encoding, -encoding, and their weighted sum, respectively, followed by a comparison between the Cramér-Rao bounds obtained with our optimized spin-trajectories, Look-Locker sequences, and multi-spin-echo methods. Finally, we experimentally tested our optimized spin trajectories with in vivo scans of the human brain.
Results: After a nonrecurring inversion segment on the southern half of the Bloch sphere, all optimized spin trajectories pursue repetitive loops on the northern hemisphere in which the beginning of the first and the end of the last loop deviate from the others. The numerical results obtained in this work align well with intuitive insights gleaned directly from the governing equation. Our results suggest that hybrid-state sequences outperform traditional methods. Moreover, hybrid-state sequences that balance - and -encoding still result in near optimal signal-to-noise efficiency for each relaxation time. Thus, the second parameter can be encoded at virtually no extra cost.
Conclusions: We provided new insights into the optimal encoding processes of spin relaxation times in order to guide the design of robust and efficient pulse sequences. We found that joint acquisitions of and in the hybrid state are substantially more efficient than sequential encoding techniques.
Keywords: HSFP; MRF; SSFP; optimal control; parameter mapping; quantitative MRI.
© 2019 International Society for Magnetic Resonance in Medicine.
Figures


Similar articles
-
Flexible and efficient optimization of quantitative sequences using automatic differentiation of Bloch simulations.Magn Reson Med. 2019 Oct;82(4):1438-1451. doi: 10.1002/mrm.27832. Epub 2019 May 26. Magn Reson Med. 2019. PMID: 31131500 Free PMC article.
-
T1 and T2 quantification from standard turbo spin echo images.Magn Reson Med. 2019 Mar;81(3):2052-2063. doi: 10.1002/mrm.27495. Epub 2018 Oct 19. Magn Reson Med. 2019. PMID: 30338866
-
Rapid quantitative magnetization transfer imaging: Utilizing the hybrid state and the generalized Bloch model.Magn Reson Med. 2024 Apr;91(4):1478-1497. doi: 10.1002/mrm.29951. Epub 2023 Dec 10. Magn Reson Med. 2024. PMID: 38073093 Free PMC article.
-
Optimization of selective inversion recovery magnetization transfer imaging for macromolecular content mapping in the human brain.Magn Reson Med. 2018 Nov;80(5):1824-1835. doi: 10.1002/mrm.27174. Epub 2018 Mar 24. Magn Reson Med. 2018. PMID: 29573356 Free PMC article.
-
Model-based nonlinear inverse reconstruction for T2 mapping using highly undersampled spin-echo MRI.J Magn Reson Imaging. 2011 Aug;34(2):420-8. doi: 10.1002/jmri.22634. J Magn Reson Imaging. 2011. PMID: 21780234
Cited by
-
An efficient approach to optimal experimental design for magnetic resonance fingerprinting with B-splines.Magn Reson Med. 2022 Jul;88(1):239-253. doi: 10.1002/mrm.29212. Epub 2022 Mar 7. Magn Reson Med. 2022. PMID: 35253922 Free PMC article.
-
Automated design of pulse sequences for magnetic resonance fingerprinting using physics-inspired optimization.Proc Natl Acad Sci U S A. 2021 Oct 5;118(40):e2020516118. doi: 10.1073/pnas.2020516118. Epub 2021 Sep 30. Proc Natl Acad Sci U S A. 2021. PMID: 34593630 Free PMC article.
-
Efficient performance analysis and optimization of transient-state sequences for multiparametric magnetic resonance imaging.NMR Biomed. 2023 Mar;36(3):e4864. doi: 10.1002/nbm.4864. Epub 2022 Nov 23. NMR Biomed. 2023. PMID: 36321222 Free PMC article.
-
Toward magnetic resonance fingerprinting for low-field MR-guided radiation therapy.Med Phys. 2021 Nov;48(11):6930-6940. doi: 10.1002/mp.15202. Epub 2021 Sep 18. Med Phys. 2021. PMID: 34487357 Free PMC article.
-
Unconstrained quantitative magnetization transfer imaging: disentangling T 1 of the free and semi-solid spin pools.ArXiv [Preprint]. 2024 Apr 1:arXiv:2301.08394v3. ArXiv. 2024. Update in: Imaging Neurosci (Camb). 2024 May 20;2:imag-2-00177. doi: 10.1162/imag_a_00177. PMID: 36713253 Free PMC article. Updated. Preprint.
References
-
- Crawley AP, Henkelman RM. A comparison of one-shot and recovery methods in T1 imaging. Magn Reson Med. 1988; 7: 23–34. - PubMed
-
- Cheng HLM, Wright GA. Rapid high-resolution T1 mapping by variable flip angles: accurate and precise measurements in the presence of radiofrequency field inhomogeneity. Magn Reson Med. 2006;55:566–574. - PubMed
-
- Deoni SCL, Rutt BK, Peters TM. Rapid combined T1 and T2 mapping using gradient recalled acquisition in the steady state. Magn Reson Med. 2003;49:515–526. - PubMed
-
- Deoni SCL, Peters TM, Rutt BK. Determination of optimal angles for variable nutation proton magnetic spin-lattice, T1, and Spin-Spin, T2, relaxation times measurement. Magn Reson Med. 2004;51:194–199. - PubMed
Publication types
MeSH terms
Grants and funding
LinkOut - more resources
Full Text Sources
Medical
Miscellaneous
