. 2019 Jun 11;12(6):1282-1297.
doi: 10.1016/j.stemcr.2019.05.003.

Differentiation and Functional Comparison of Monocytes and Macrophages from hiPSCs with Peripheral Blood Derivatives

Affiliations

Differentiation and Functional Comparison of Monocytes and Macrophages from hiPSCs with Peripheral Blood Derivatives

Xu Cao et al. Stem Cell Reports. .

Abstract

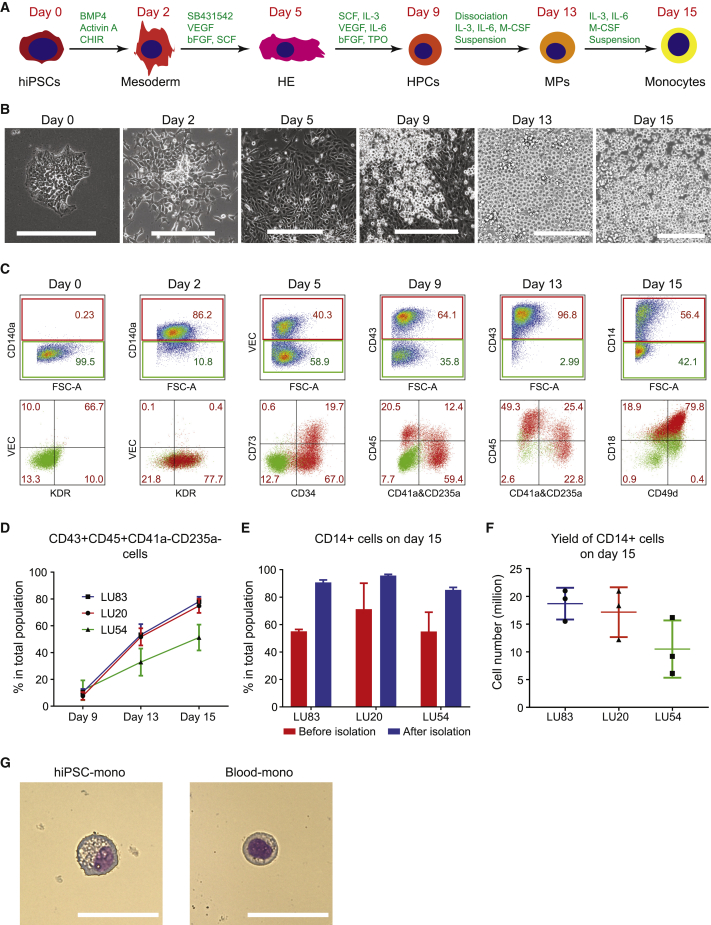
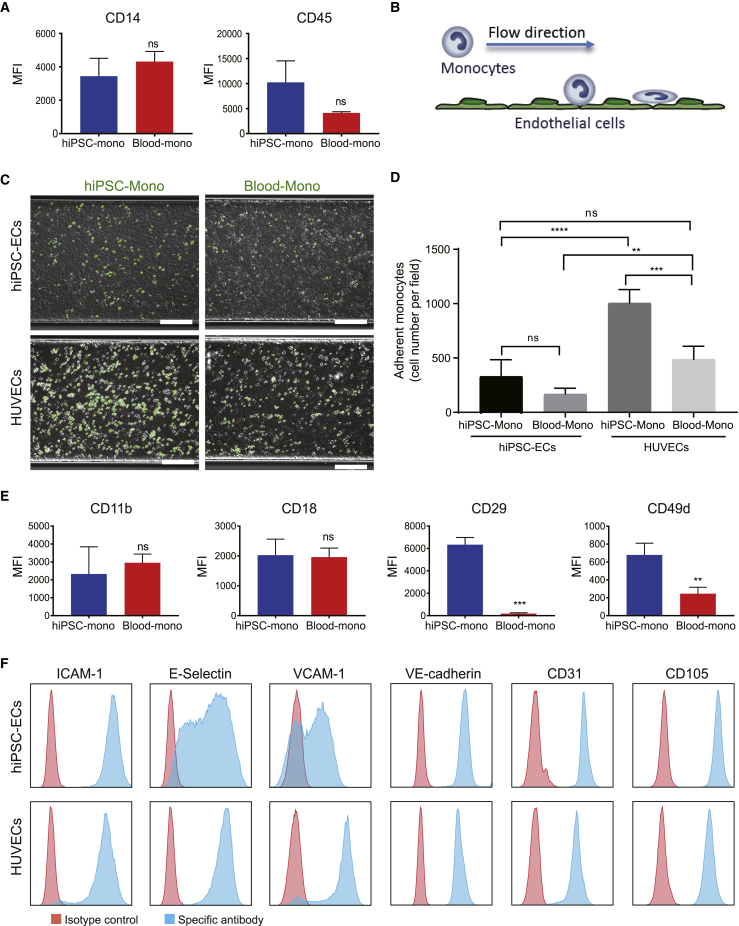
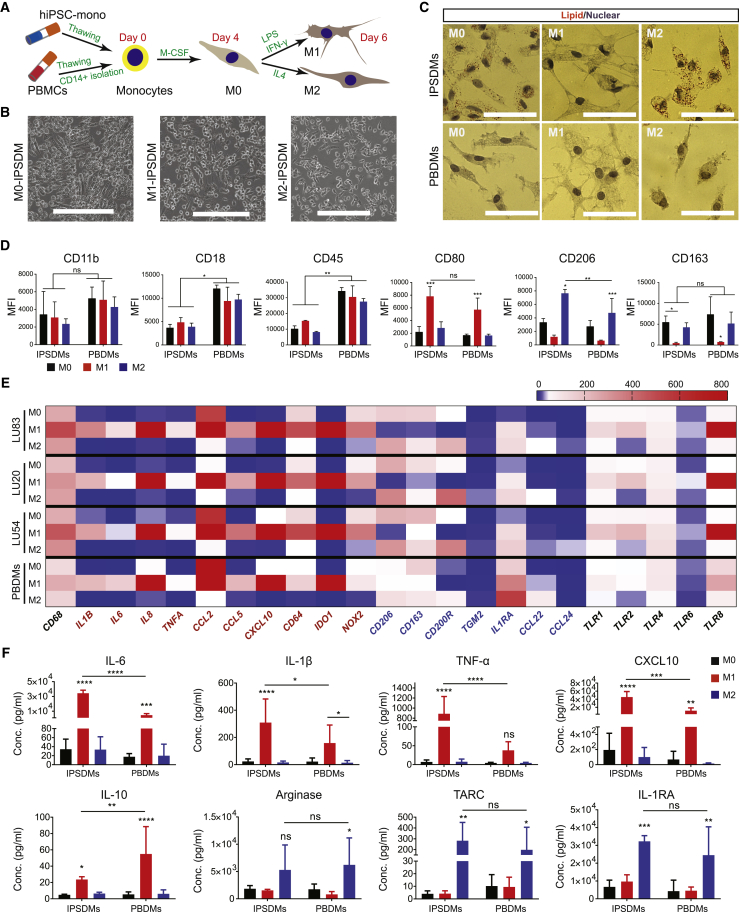
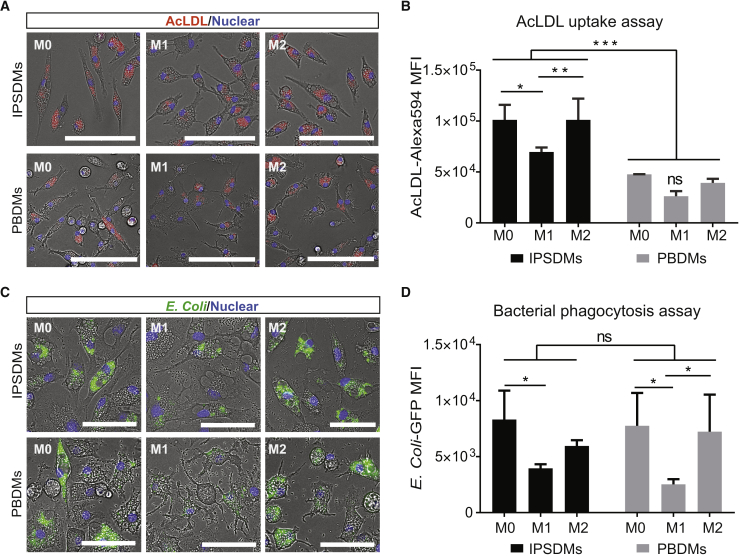
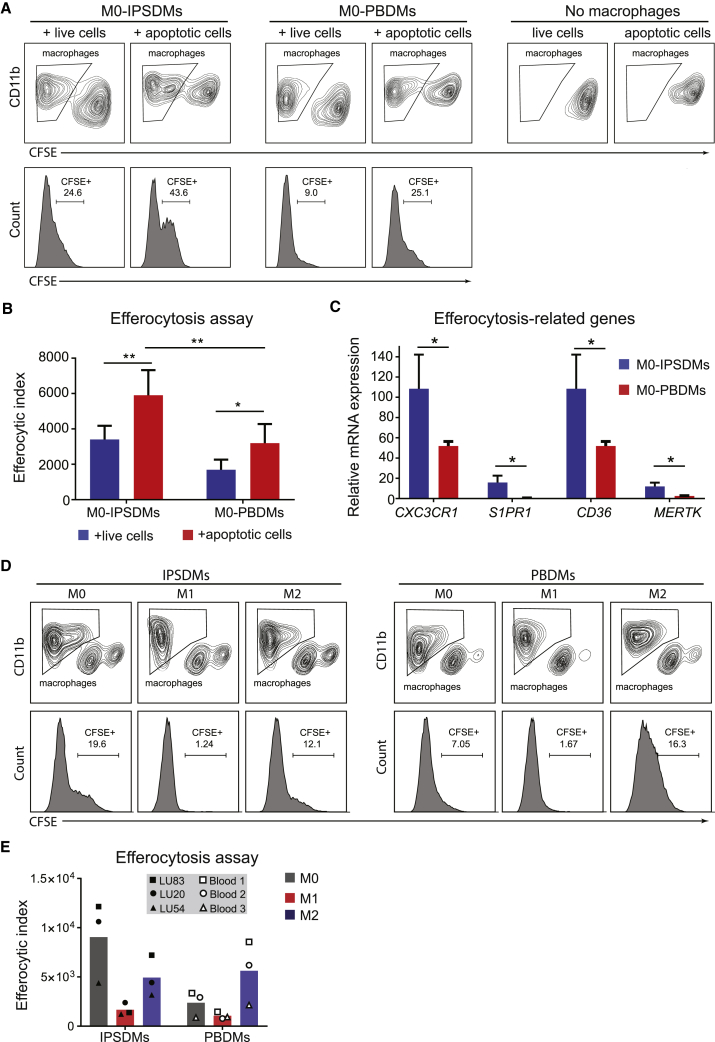
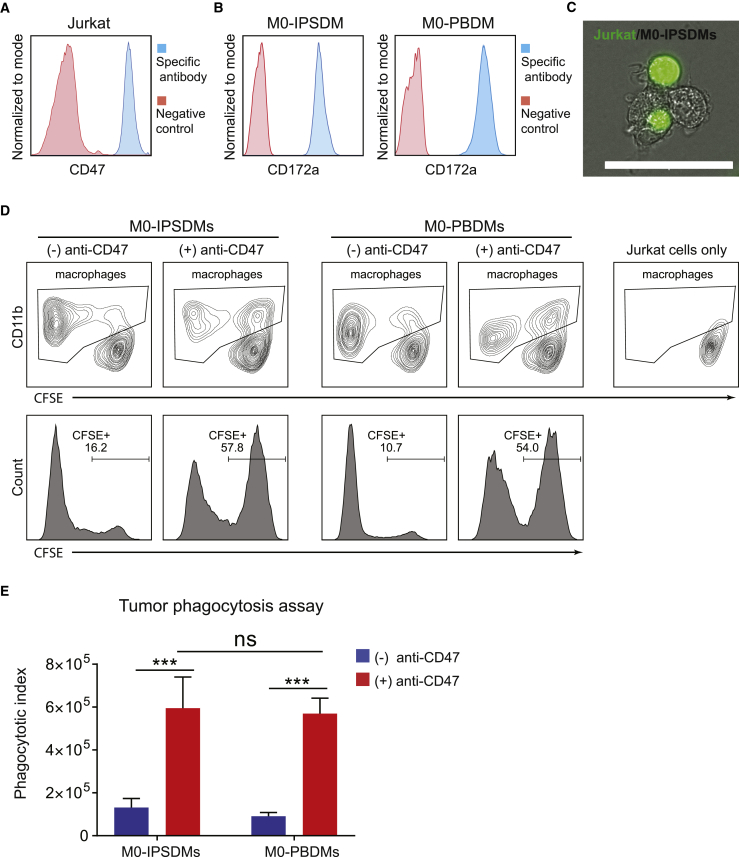
A renewable source of human monocytes and macrophages would be a valuable alternative to primary cells from peripheral blood (PB) in biomedical research. We developed an efficient protocol to derive monocytes and macrophages from human induced pluripotent stem cells (hiPSCs) and performed a functional comparison with PB-derived cells. hiPSC-derived monocytes were functional after cryopreservation and exhibited gene expression profiles comparable with PB-derived monocytes. Notably, hiPSC-derived monocytes were more activated with greater adhesion to endothelial cells under physiological flow. hiPSC-derived monocytes were successfully polarized to M1 and M2 macrophage subtypes, which showed similar pan- and subtype-specific gene and surface protein expression and cytokine secretion to PB-derived macrophages. hiPSC-derived macrophages exhibited higher endocytosis and efferocytosis and similar bacterial and tumor cell phagocytosis to PB-derived macrophages. In summary, we developed a robust protocol to generate hiPSC monocytes and macrophages from independent hiPSC lines that showed aspects of functional maturity comparable with those from PB.

Keywords: efferocytosis; hiPSC-derived macrophages (IPSDMs); hiPSC-derived monocytes; inflammation; monocyte adhesion under flow; tumor phagocytosis.


Figures

Figure 1
Figure 1
Differentiation of CD14+ Monocytes from hiPSCs (A) Schematic overview of CD14+ monocyte differentiation protocol from hiPSCs. (B) Bright-field images of representative cellular morphology at day 0 (undifferentiated hiPSCs), day 2 (mesoderm), day 5 (HE), day 9 (HPCs), day 13 (MPs), and day 15 (CD14+ monocytes). Scale bar represents 200 μm. (C) FACS analysis of stage-specific markers at day 0, day 2, day 5, day 9, day 13, and day 15 of differentiation from a representative hiPSC line (LU83). Positive populations are gated in the upper panels, and their percentages are shown in red in both upper and lower panels. (D) Quantification of the percentage of myeloid lineage cells (CD43+CD45+CD41a−CD235a−) in the total cell population at day 9, day 13, and day 15 of differentiation. Quantification of three independent experiments from three hiPSC lines (LU83, LU20, and LU54) is shown. (E) Quantification of the percentage of CD14+ cells at day 15 of differentiation before and after isolation using CD14+ MACS. Quantification of three independent experiments from three hiPSC lines (LU83, LU20, and LU54) is shown. (F) Yield of CD14+ monocytes at day 15 of differentiation from three hiPSC lines and three independent experiments. Yield of monocytes is equal to the total cell number multiplied by percentages of CD14+ cells. (G) Giemsa staining of hiPSC-mono isolated at day 15 of differentiation from one representative hiPSC line (LU83) and Blood-mono. Scale bar represents 50 μm. Error bars are ±SD of three independent experiments in (D–F). See also Figure S1 and Videos S1 and S2.
Figure 2
Figure 2
Functional Comparison of hiPSC-Mono and Blood-Mono in the Microfluidic Adhesion Assay (A) FACS analysis of surface expression of CD14 and CD45 on hiPSC-mono and Blood-mono after cryopreservation. Error bars are ±SD of three independent experiments. Unpaired t test: ns, non-significant. (B) Schematic for the microfluidic flow adhesion assay of monocytes and ECs. (C) Representative images taken at the end of the flow assay for each combination of ECs and monocytes. Monocytes were labeled with DiOC6 (green). Scale bar represents 200 μm. (D) Quantification of the number of adhered monocytes: hiPSC-mono and hiPSC-ECs, Blood-mono and hiPSC-ECs, hiPSC-mono and HUVECs, Blood-mono and HUVECs. Error bars are ±SD of four independent experiments. Uncorrected Fisher's least significant differences test: ns, non-significant; ∗∗p < 0.01, ∗∗∗p < 0.001, ∗∗∗∗p < 0.0001. (E) FACS analysis of surface expression of MAC-1 (CD11b and CD18) and VLA-4 (CD49d and CD29) integrin subunits on hiPSC-mono and Blood-mono. Error bars are ±SD of three independent experiments. Unpaired t test: ns, non-significant; ∗∗p < 0.01, ∗∗∗p < 0.001. (F) FACS analysis of ICAM-1, E-Selectin, VCAM-1, VE-cadherin, CD31, and CD105 on hiPSC-ECs and HUVECs after TNF-α treatment. Isotype control is shown in red and antigen-specific antibody is shown in blue. See also Figure S2.
Figure 3
Figure 3
Characterization of IPSDMs (A) Schematic overview of the macrophage differentiation protocol from cryopreserved hiPSC-mono and PBMCs. (B) Bright-field images of representative cellular morphology of IPSDMs. Scale bar represents 200 μm. (C) Oil red O staining of lipid (red) within M0, M1, and M2 subtypes of IPSDMs and PBDMs. Nuclei (purple) were stained with hematoxylin. Scale bar represents 50 μm. (D) Quantification of surface expression of pan-specific macrophage markers, CD11b, CD18, and CD45, and subtype-specific markers, CD80 (M1) and CD206 (M2), on IPSDMs (differentiated from LU83) and PBDMs. Error bars are ±SD of three independent experiments. Uncorrected Fisher's least significant differences test: ns, non-significant; p < 0.05, ∗∗p < 0.01, ∗∗∗p < 0.001. (E) Heatmap of gene expression analysis of macrophage-specific markers by qPCR in IPSDMs differentiated from three hiPSC lines (LU83, LU20, and LU54) and PBDMs. Mean values of three independent experiments are shown. M1-specific genes are shown in red and M2-specific genes are shown in blue. (F) Quantification of secreted cytokines and chemokines by a Multiplex assay using supernatants from IPSDMs and PBDMs after 48 h of polarization. Error bars are ±SD of three independent experiments. Uncorrected Fisher's least significant differences test: ns, non-significant; p < 0.05, ∗∗p < 0.01, ∗∗∗p < 0.001, ∗∗∗∗p < 0.0001. See also Figure S3.
Figure 4
Figure 4
Endocytosis and Phagocytosis of Bacteria by IPSDMs and PBDMs (A) Representative images of the AcLDL-Alexa Fluor 594 uptake assay by different subtypes of IPSDMs and PBDMs. AcLDL positive uptake is shown in red; cell nuclei are stained with Hoechst in blue. Scale bar represents 100 μm. (B) Quantification of AcLDL-Alexa Fluor 594 median fluorescence intensity of different macrophage subtypes by FACS. Error bars are ±SD of three independent experiments. Uncorrected Fisher's least significant differences test: ns, non-significant; p < 0.05, ∗∗p < 0.01, ∗∗∗p < 0.001. (C) Representative images of bacterial phagocytosis by different subtypes of IPSDMs and PBDMs. Nuclei were stained with Hoechst in blue. GFP-labeled (pHrodo green) E. coli were pH sensitive and only show green fluorescence inside macrophages. Scale bar represents 100 μm. (D) Quantification of E. coli-GFP median fluorescence intensities in macrophage subtypes by FACS. Error bars are ±SD of three independent experiments. Uncorrected Fisher's least significant differences test: ns, non-significant; p < 0.05. IPSDMs were differentiated from LU83 in (A)–(D).
Figure 5
Figure 5
Characterization of Efferocytosis Activity of IPSDMs and PBDMs (A) Efferocytosis assay of M0-IPSDMs and M0-PBDMs. Live cells (used as a negative control) and apoptotic cells were labeled with CFSE, and macrophages were stained by anti-CD11b antibody. Histogram plots of CFSE (lower panel) within the CD11b+ population (upper panel) are shown. (B) Efferocytic index of M0-IPSDMs and M0-PBDMs. The percentage of CFSE+ macrophages was multiplied by the MFI of CFSE in order to calculate the efferocytic index. Error bars are ±SD of four independent experiments. Uncorrected Fisher's least significant differences test: p < 0.05, ∗∗p < 0.01. (C) Quantification of gene expression of efferocytosis-related genes CX3CR1, S1PR1, CD36, and MERTK by qPCR in M0-IPSDMs and M0-PBDMs. Unpaired t test: p < 0.05. (D) Efferocytosis assay of different subtypes of IPSDMs and PBDMs. Live cells (used as a negative control) and apoptotic cells were labeled with CFSE, and macrophages were stained by anti-CD11b antibody. Histogram plots of CFSE (lower panel) within the CD11b+ population (upper panel) are shown. (E) Efferocytic index of different subtypes of IPSDMs and PBDMs. The percentage of CFSE+ macrophages was multiplied by MFI of CFSE in order to calculate the efferocytic index. Data are presented as means of three biological replicates (three hiPSC lines or PBMC samples). IPSDMs were differentiated from LU83 in (A)–(D). See also Figure S4.
Figure 6
Figure 6
Phagocytosis of Tumor Cells by IPSDMs and PBDMs (A) FACS analysis of CD47 on Jurkat cells. Secondary antibody only was used as a negative control. (B) FACS analysis of CD172a on M0-IPSDMs and M0-PBDMs. Non-stained cells were used as negative control. (C) A representative image of Jurkat cells (labeled with green fluorescent dye) phagocytized by M0-IPSDMs (phase contrast image). Scale bar represents 50 μm. CFSE-labeled Jurkat cells were incubated with anti-CD47 blocking antibody and co-cultured with M0-IPSDMs for 30 min. (D) FACS analysis of Jurkat cell phagocytosis by M0-IPSDMs and M0-PBDMs. CFSE-labeled Jurkat cells were incubated with or without anti-CD47 blocking antibody and added to macrophages for 2 h. CD11b+ macrophages are gated (upper panel), and their CFSE intensity is shown as a histogram (lower panel). (E) Phagocytotic index of M0-IPSDMs and M0-PBDMs with and without CD47 blocking antibody. The percentage of CFSE+ macrophages was multiplied by the MFI of CFSE to get the phagocytotic index. Error bars are ±SD of four independent experiments. Uncorrected Fisher's least significant differences test: ns, non-significant; ∗∗∗p < 0.001. M0-IPSDMs were differentiated from LU83 in (B)–(E). See also Figure S5 and Video S3.

References

    1. A-Gonzalez N., Quintana J.A., Garcia-Silva S., Mazariegos M., Gonzalez de la Aleja A., Nicolas-Avila J.A., Walter W., Adrover J.M., Crainiciuc G., Kuchroo V.K. Phagocytosis imprints heterogeneity in tissue-resident macrophages. J. Exp. Med. 2017;214:1281–1296. - PMC - PubMed
    2. A-Gonzalez, N., Quintana, J.A., Garcia-Silva, S., Mazariegos, M., Gonzalez de la Aleja, A., Nicolas-Avila, J.A., Walter, W., Adrover, J.M., Crainiciuc, G., Kuchroo, V.K., et al. (2017). Phagocytosis imprints heterogeneity in tissue-resident macrophages. J. Exp. Med. 214, 1281-1296. - PMC - PubMed
    1. Ackermann M., Kempf H., Hetzel M., Hesse C., Hashtchin A.R., Brinkert K., Schott J.W., Haake K., Kuhnel M.P., Glage S. Bioreactor-based mass production of human iPSC-derived macrophages enables immunotherapies against bacterial airway infections. Nat. Commun. 2018;9:5088. - PMC - PubMed
    2. Ackermann, M., Kempf, H., Hetzel, M., Hesse, C., Hashtchin, A.R., Brinkert, K., Schott, J.W., Haake, K., Kuhnel, M.P., Glage, S., et al. (2018). Bioreactor-based mass production of human iPSC-derived macrophages enables immunotherapies against bacterial airway infections. Nat. Commun. 9, 5088. - PMC - PubMed
    1. Buchrieser J., James W., Moore M.D. Human induced pluripotent stem cell-derived macrophages share ontogeny with MYB-independent tissue-resident macrophages. Stem Cell Reports. 2017;8:334–345. - PMC - PubMed
    2. Buchrieser, J., James, W., and Moore, M.D.. (2017). Human induced pluripotent stem cell-derived macrophages share ontogeny with MYB-independent tissue-resident macrophages. Stem Cell Reports 8, 334-345. - PMC - PubMed
    1. Carpenter A.E., Jones T.R., Lamprecht M.R., Clarke C., Kang I.H., Friman O., Guertin D.A., Chang J.H., Lindquist R.A., Moffat J. CellProfiler: image analysis software for identifying and quantifying cell phenotypes. Genome Biol. 2006;7:R100. - PMC - PubMed
    2. Carpenter, A.E., Jones, T.R., Lamprecht, M.R., Clarke, C., Kang, I.H., Friman, O., Guertin, D.A., Chang, J.H., Lindquist, R.A., Moffat, J., et al. (2006). CellProfiler: image analysis software for identifying and quantifying cell phenotypes. Genome Biol. 7, R100. - PMC - PubMed
    1. Chao M.P., Weissman I.L., Majeti R. The CD47-SIRPalpha pathway in cancer immune evasion and potential therapeutic implications. Curr. Opin. Immunol. 2012;24:225–232. - PMC - PubMed
    2. Chao, M.P., Weissman, I.L., and Majeti, R.. (2012). The CD47-SIRPalpha pathway in cancer immune evasion and potential therapeutic implications. Curr. Opin. Immunol. 24, 225-232. - PMC - PubMed

Publication types

Substances