. 2019 Jun 11;27(11):3345-3358.e4.
doi: 10.1016/j.celrep.2019.05.057.

Tumor Heterogeneity Underlies Differential Cisplatin Sensitivity in Mouse Models of Small-Cell Lung Cancer

Affiliations

Tumor Heterogeneity Underlies Differential Cisplatin Sensitivity in Mouse Models of Small-Cell Lung Cancer

Franziska Böttger et al. Cell Rep. .

Abstract

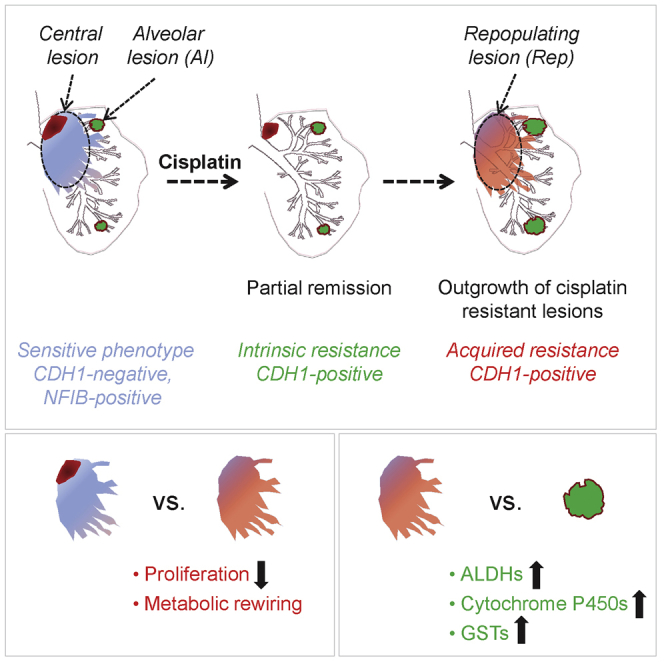
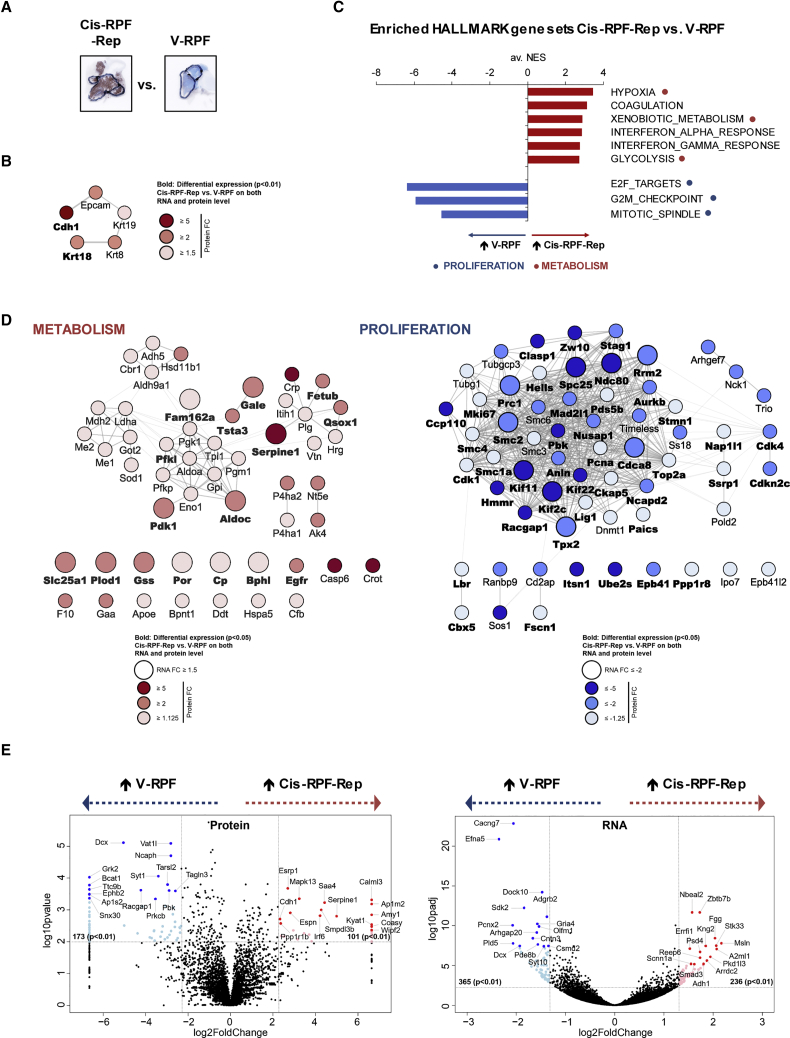
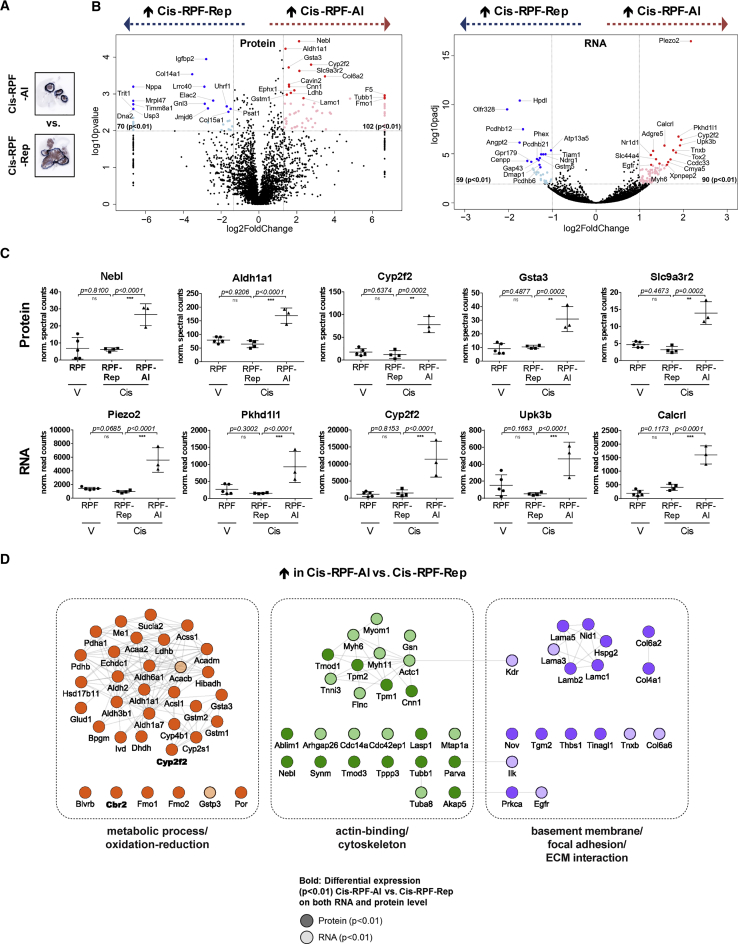
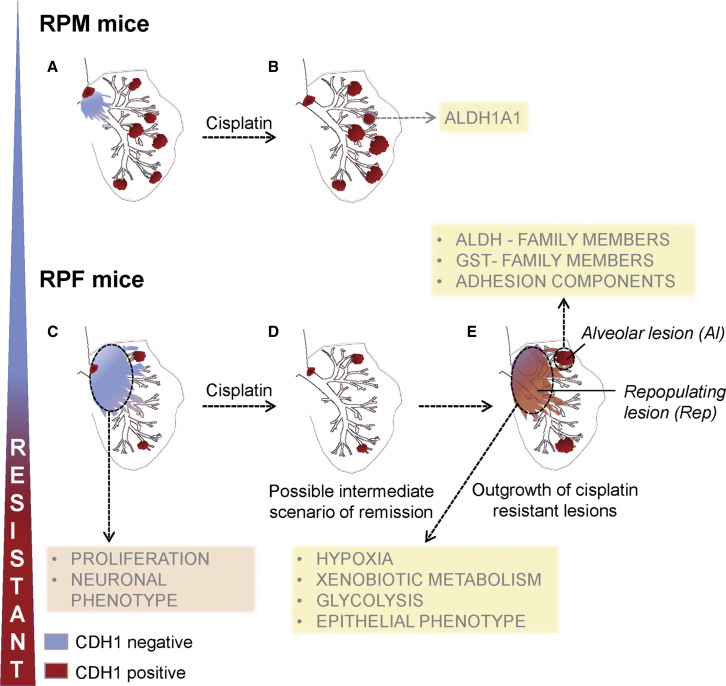
Small-cell lung cancer is the most aggressive type of lung cancer, characterized by a remarkable response to chemotherapy followed by development of resistance. Here, we describe SCLC subtypes in Mycl- and Nfib-driven GEMM that include CDH1-high peripheral primary tumor lesions and CDH1-negative, aggressive intrapulmonary metastases. Cisplatin treatment preferentially eliminates the latter, thus revealing a striking differential response. Using a combined transcriptomic and proteomic approach, we find a marked reduction in proliferation and metabolic rewiring following cisplatin treatment and present evidence for a distinctive metabolic and structural profile defining intrinsically resistant populations. This offers perspectives for effective combination therapies that might also hold promise for treating human SCLC, given the very similar response of both mouse and human SCLC to cisplatin.

Keywords: RNA-seq; SCLC; chemotherapy; cisplatin; mass spectrometry; mouse models; proteomics; transcriptomics; tumor heterogeneity.


Figures

None
Graphical abstract
Figure 1
Figure 1
Tumor Heterogeneity in Mouse Models of SCLC (A) Representative H&E staining of RP control lung (n = 13 mice). Upper right inset shows an area of the central tumor with two tumor populations in close proximity (scale bar, 50 μm). Lower right inset shows an alveolar lesion, lower left, a bronchial lesion (scale bar, 20 μm). LN, lymph node; T, thymus. (B) Representative H&E staining of RPF lung (n = 17 mice) with large central and disseminating lesions. (C) Representative H&E staining of RPM lung (n = 17 mice), showing central and numerous peripheral lesions. (D–F) CDH1 staining of RP (D), RPF (E), and RPM (F) lungs, demonstrating the heterogeneity of positive (brown) and negative (blue) populations among the SCLCs. (G) H&E staining showing intrapulmonary metastasis lesions within peri-vascular and peri-bronchiolar space of the lung of RP animals; arrowheads indicate sheath growth pattern. (H) Peri-vascular and peri-bronchiolar space of the lung of a non-tumor-bearing animal. (I) Peri-vascular and peri-bronchiolar space of the lung of a tumor-bearing animal showing edematous change; arrowheads indicate tumor cells within lymph vessels. LN, lymph node. Scale bars for (G)–(I), 100 μm. (J and K) Quantification of bronchiolar (J) and alveolar (K) lesions. (L) Percentage of total tumor area within the lung occupied by the central tumor compartment. See also Figure S1.
Figure 2
Figure 2
MYCL Promotes Development of NE Lesions in the Alveolar Space (A) Part of a bronchial tree in an RP mouse (n = 13 mice) showing several bronchial lesions. (B) Part of a bronchial tree in an RPM mouse (n = 17 mice) showing multiple bronchial and alveolar lesions. (C) Alveolar lesion showing pseudo-glandular structures. (D) Ki67 staining showing proliferating cells within alveolar lesion and within the adjacent intrapulmonary metastasis lesion. (E) Magnification of the area within (D). (F) ASCL1 staining of alveolar lesion. (G–I) CDH1 (G), CGRP (H), and NFIB (I) staining of three alveolar lesions in close proximity to intrapulmonary metastasis lesions (sequential sections). Scale bar for (A), (B), (D), and (G)–(I), 500 μm. Scale bar for (C), 20 μm. Scale bar for (E) and (F), 50 μm. See also Figure S1.
Figure 3
Figure 3
Differential Sensitivity of Distinct Tumor Populations to Cisplatin Treatment (A) Representative CDH1 staining of RPM lung treated with vehicle (n = 13 mice). (B) Representative CDH1 staining of RPM lung treated with cisplatin (n = 15 mice). (C) Quantification of the area of the lung occupied by CDH1-negative tumor. (D) Survival curves for vehicle- and cisplatin-treated RPM animals; time 0 is set at the day of the first treatment. (E) Representative CDH1 staining of RPF lung treated with vehicle (n = 9 mice). (F) Representative CDH1 staining of RPF lung treated with cisplatin (n = 11 mice). (G) Quantification of the area of the lung occupied by CDH1-negative tumor. (H) Survival curves for vehicle- and cisplatin-treated RPF animals; time 0 is set at the day of the first treatment. (I and J) Magnification of (I) an intrapulmonary metastasis (Ipm; vehicle-treated animal) and (J) a repopulating (Rep; cisplatin-treated animal) tumor. (K) Image of cisplatin-treated RPF lung showing predominantly alveolar lesions (Al) after treatment. Scale bar for (I) and (J), 500 μm. See also Figure S2 and Table S1.
Figure 4
Figure 4
Cisplatin-Treated RPF Samples Display Reduced Proliferation and a Metabolic Switch (A) Representative images (CDH1 staining) of samples used for Cis-RPF-Rep versus V-RPF comparison (for images of all five V-RPF and four Cis-RPF-Rep mice analyzed, see Figure S3A). (B) Functional interaction cluster of significantly (p < 0.01) differentially expressed proteins (determined using beta-binomial test on normalized spectral counts) Cis-RPF-Rep versus V-RPF associated with Cdh1 (STRING database). Node color corresponds to fold change (FC) at the protein level and edge thickness to confidence of STRING interaction (thinnest = high confidence [≥0.7], thickest = highest confidence [≥0.9]). Gene names in boldface type (Cdh1 and Krt18) correspond to proteins that are significantly (p < 0.01) differentially expressed on both protein and RNA level (for RNA-seq data, DESeq2 was used for normalization and differential expression analysis). (C) Common gene sets significantly (FDR q value < 0.05, normalized enrichment score [NES] ≥ 2.5) enriched at both the protein and RNA levels in Cis-RPF-Rep versus V-RPF comparison (GSEA_HALLMARKS). NES values of protein and RNA analyses were averaged for representative purposes (av. NES); separate protein and RNA enrichment graphs can be found in Figure S5B. (D) Network analysis of differentially expressed genes (DEGs; unadjusted p < 0.05), on the basis of proteins contributing to core enrichment of gene sets HYPOXIA, XENOBIOTIC_METABOLISM, and GLYCOLYSIS (“metabolism”) and E2F_TARGETS, G2M_CHECKPOINT, and MITOTIC_SPINDLE (“proliferation”), respectively. Marked in boldface type are genes that were significantly differentially expressed at both the RNA and protein levels. Node color reflects FC at the protein level and node size FC at the RNA level. (E) Most discriminatory genes in Cis-RPF-Rep versus V-RPF comparison. All genes with p values < 0.01 and −5 ≥ FC ≥ 5 (protein, left plot) or −2.5 ≥ FC ≥ 2.5 (RNA, right plot) are colored in light blue (UP in vehicle-treated) or light red (UP in cisplatin-treated RPF-Rep), respectively. Highlighted with proteins names (and marked with dark blue and red dots) are the 15 most highly differentially expressed genes in each direction (by p value after FC filtering). See also Figures S3–S5 and Tables S2, S3, and S4.
Figure 5
Figure 5
Comparison of the Two Cisplatin-Treated RPF Populations Highlights a Unique Alveolar Lesion Identity (A) Representative images (CDH1 staining) of samples used for RPF-Al versus RPF-Rep comparison (for images of all three RPF-Al and four RPF-Rep mice analyzed, see Figure S3A). (B) Most discriminatory genes in RPF-Al versus RPF-Rep comparison (determined using beta-binomial test for protein and DESeq2 for RNA-seq data). All genes with p values < 0.01 and −2.5 ≥ fold change (FC) ≥ 2.5 (protein, left plot) or −2 ≥ FC ≥ 2 (RNA, right plot) are colored in light blue (UP in RPF-Rep) or light red (UP in RPF-Al), respectively. Highlighted with proteins names (and marked with dark blue and red dots) are the 15 most highly differentially expressed genes in each direction (by p value after FC filtering). (C) Expression plots of the 5 most differential genes on protein (top row) and RNA level (bottom row), respectively (p < 0.01, ∗∗p < 0.001, and ∗∗∗p < 0.0001; n.s., not significant). (D) Highly differentially expressed proteins (p < 0.01 at the protein and/or RNA level) form three highly interactive functional clusters: metabolic process and oxidation-reduction (left), actin-binding and cytoskeleton (middle), and basement membrane, focal adhesion, and ECM interaction (right). See also Figure S6 and Tables S2 and S3.
Figure 6
Figure 6
Schematic Representation of SCLC Heterogeneity in Mouse Models as Underlying Mechanism of Differential Sensitivity to Cisplatin Our results suggest that the outcome of cisplatin treatment might depend on the ratio between CDH1-positive resistant primary (brown) and CDH1-negative intrapulmonary metastasis (blue) compartments within SCLC lesions. (A and B) In RPM mice, in which CDH1-positive compartment is on average predominant (A), the regression of CDH1-negative population following cisplatin treatment (B) is not sufficient to guarantee a longer survival. (C and D) In RPF mice, the sensitive CDH1-negative central compartment (C) responds to cisplatin, and consequently its regression (D) is associated with a significant survival advantage. (E) This positive response to cisplatin is followed by subsequent growth of resistant populations, similar to what is seen in patients. Resistant tumor may represent peripheral lesions, frequently present in RPM mice, and/or central lesions that repopulate the empty peri-vascular/peri-bronchial space left behind following elimination of the sensitive population. The targeting of metabolic pathways (yellow rectangles) active in the resistant populations, in combination with cisplatin treatment, may offer an opportunity to eradicate recalcitrant SCLC.

References

    1. Allison Stewart C., Tong P., Cardnell R.J., Sen T., Li L., Gay C.M., Masrorpour F., Fan Y., Bara R.O., Feng Y. Dynamic variations in epithelial-to-mesenchymal transition (EMT), ATM, and SLFN11 govern response to PARP inhibitors and cisplatin in small cell lung cancer. Oncotarget. 2017;8:28575–28587. - PMC - PubMed
    2. Allison Stewart, C., Tong, P., Cardnell, R.J., Sen, T., Li, L., Gay, C.M., Masrorpour, F., Fan, Y., Bara, R.O., Feng, Y., et al. (2017). Dynamic variations in epithelial-to-mesenchymal transition (EMT), ATM, and SLFN11 govern response to PARP inhibitors and cisplatin in small cell lung cancer. Oncotarget 8, 28575-28587. - PMC - PubMed
    1. Anders S., Pyl P.T., Huber W. HTSeq—a Python framework to work with high-throughput sequencing data. Bioinformatics. 2015;31:166–169. - PMC - PubMed
    2. Anders, S., Pyl, P.T., and Huber, W. (2015). HTSeq-a Python framework to work with high-throughput sequencing data. Bioinformatics 31, 166-169. - PMC - PubMed
    1. Borromeo M.D., Savage T.K., Kollipara R.K., He M., Augustyn A., Osborne J.K., Girard L., Minna J.D., Gazdar A.F., Cobb M.H., Johnson J.E. ASCL1 and NEUROD1 reveal heterogeneity in pulmonary neuroendocrine tumors and regulate distinct genetic programs. Cell Rep. 2016;16:1259–1272. - PMC - PubMed
    2. Borromeo, M.D., Savage, T.K., Kollipara, R.K., He, M., Augustyn, A., Osborne, J.K., Girard, L., Minna, J.D., Gazdar, A.F., Cobb, M.H., and Johnson, J.E. (2016). ASCL1 and NEUROD1 reveal heterogeneity in pulmonary neuroendocrine tumors and regulate distinct genetic programs. Cell Rep. 16, 1259-1272. - PMC - PubMed
    1. Calbo J., van Montfort E., Proost N., van Drunen E., Beverloo H.B., Meuwissen R., Berns A. A functional role for tumor cell heterogeneity in a mouse model of small cell lung cancer. Cancer Cell. 2011;19:244–256. - PubMed
    2. Calbo, J., van Montfort, E., Proost, N., van Drunen, E., Beverloo, H.B., Meuwissen, R., and Berns, A. (2011). A functional role for tumor cell heterogeneity in a mouse model of small cell lung cancer. Cancer Cell 19, 244-256. - PubMed
    1. Cox J., Mann M. MaxQuant enables high peptide identification rates, individualized p.p.b.-range mass accuracies and proteome-wide protein quantification. Nat. Biotechnol. 2008;26:1367–1372. - PubMed
    2. Cox, J., and Mann, M. (2008). MaxQuant enables high peptide identification rates, individualized p.p.b.-range mass accuracies and proteome-wide protein quantification. Nat. Biotechnol. 26, 1367-1372. - PubMed

Publication types