

Performance of the Framingham risk models and pooled cohort equations for predicting 10-year risk of cardiovascular disease: a systematic review and meta-analysis
- PMID: 31189462
- PMCID: PMC6563379
- DOI: 10.1186/s12916-019-1340-7
Performance of the Framingham risk models and pooled cohort equations for predicting 10-year risk of cardiovascular disease: a systematic review and meta-analysis
Abstract
Background: The Framingham risk models and pooled cohort equations (PCE) are widely used and advocated in guidelines for predicting 10-year risk of developing coronary heart disease (CHD) and cardiovascular disease (CVD) in the general population. Over the past few decades, these models have been extensively validated within different populations, which provided mounting evidence that local tailoring is often necessary to obtain accurate predictions. The objective is to systematically review and summarize the predictive performance of three widely advocated cardiovascular risk prediction models (Framingham Wilson 1998, Framingham ATP III 2002 and PCE 2013) in men and women separately, to assess the generalizability of performance across different subgroups and geographical regions, and to determine sources of heterogeneity in the findings across studies.
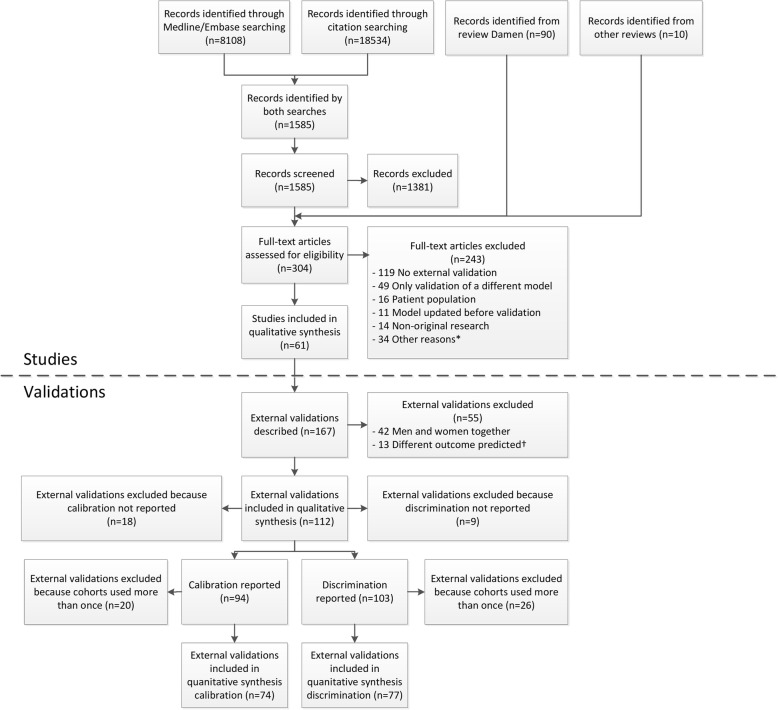
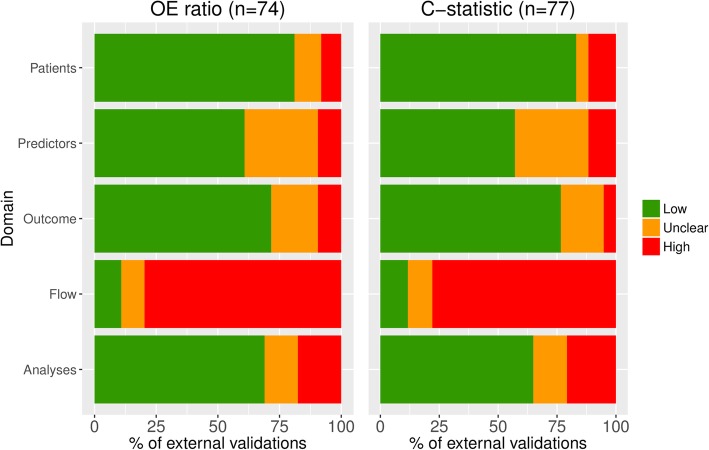
Methods: A search was performed in October 2017 to identify studies investigating the predictive performance of the aforementioned models. Studies were included if they externally validated one or more of the original models in the general population for the same outcome as the original model. We assessed risk of bias for each validation and extracted data on population characteristics and model performance. Performance estimates (observed versus expected (OE) ratio and c-statistic) were summarized using a random effects models and sources of heterogeneity were explored with meta-regression.
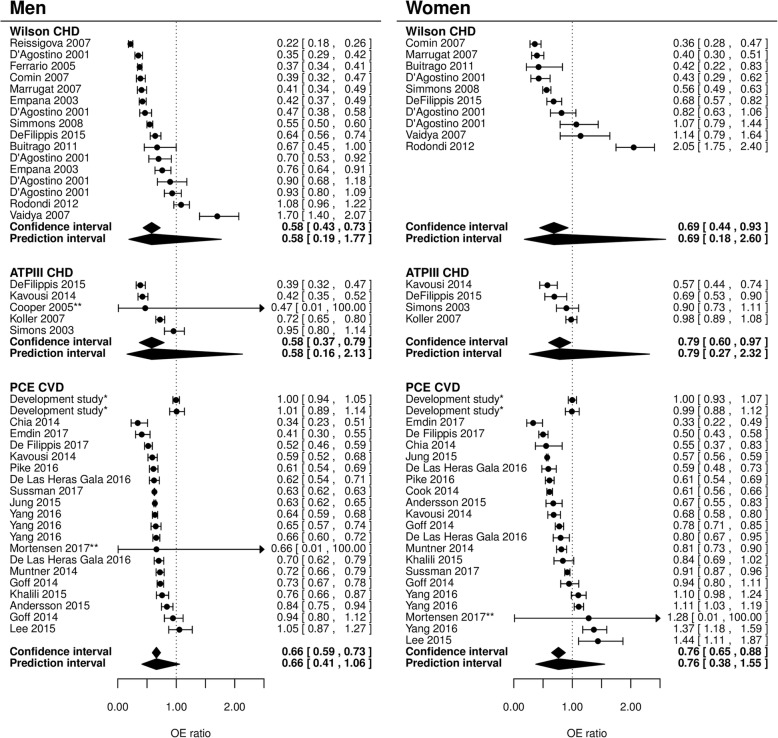
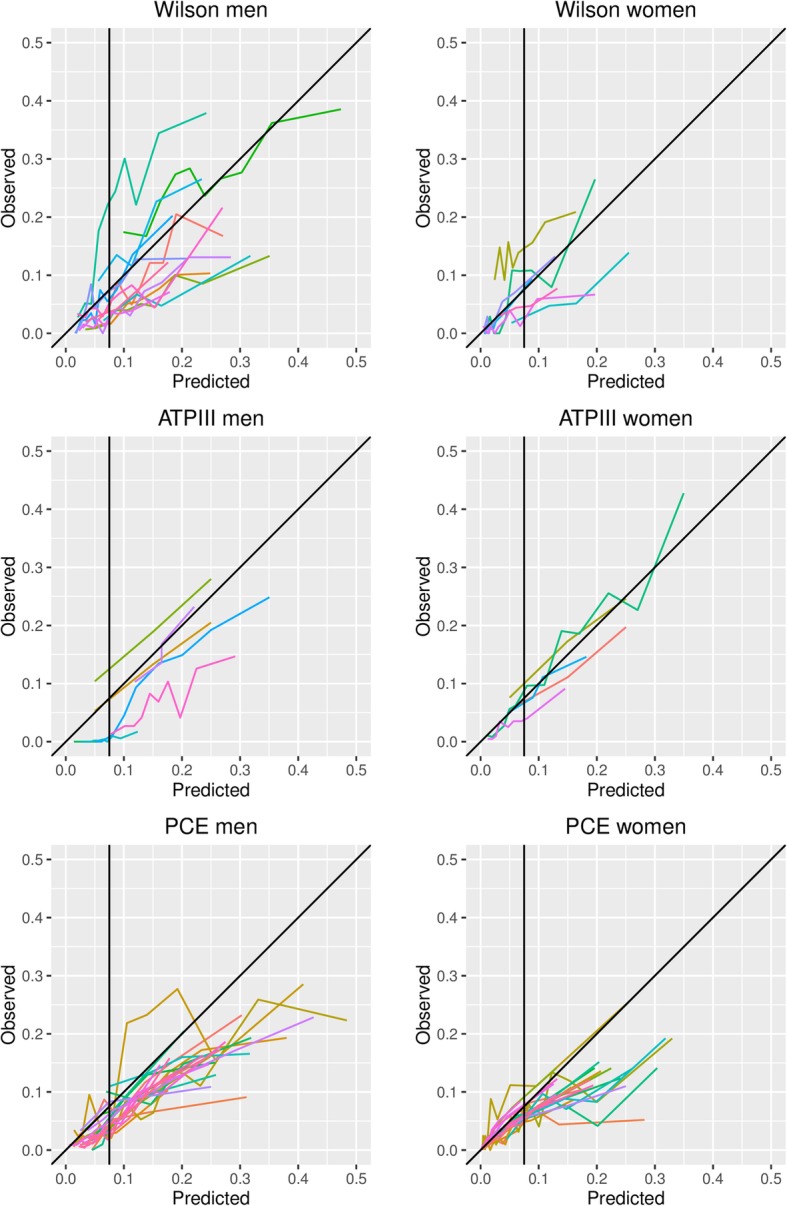
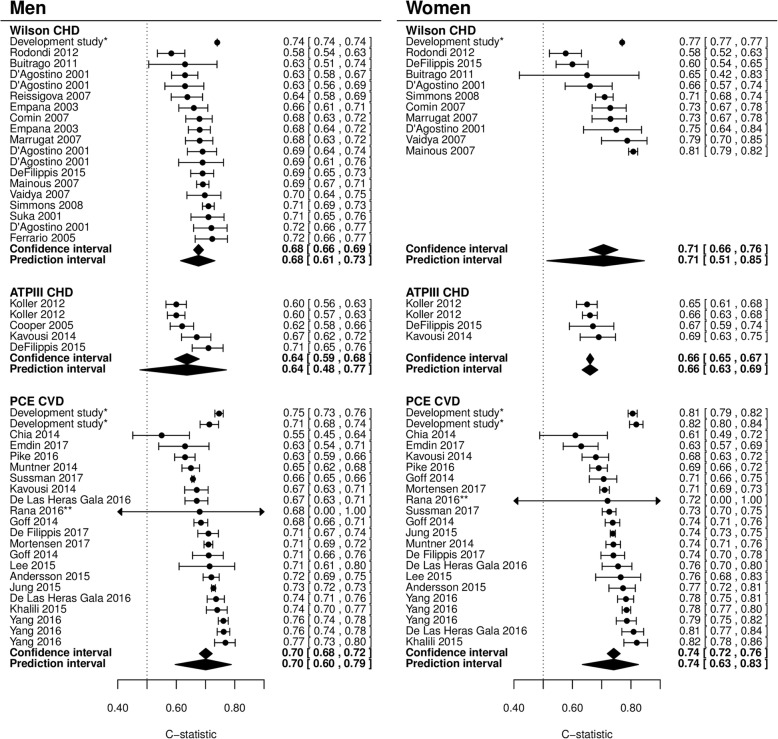
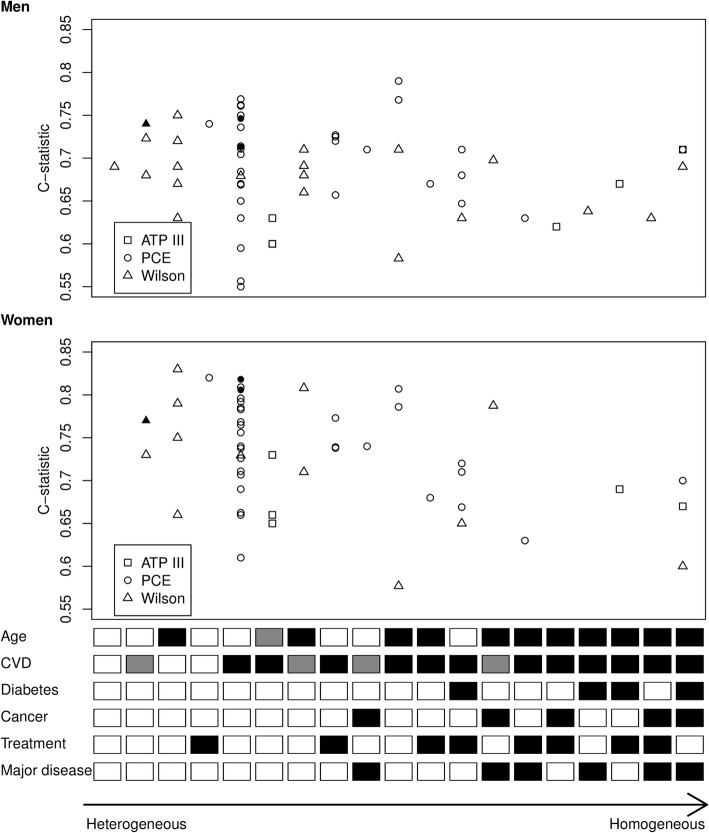
Results: The search identified 1585 studies, of which 38 were included, describing a total of 112 external validations. Results indicate that, on average, all models overestimate the 10-year risk of CHD and CVD (pooled OE ratio ranged from 0.58 (95% CI 0.43-0.73; Wilson men) to 0.79 (95% CI 0.60-0.97; ATP III women)). Overestimation was most pronounced for high-risk individuals and European populations. Further, discriminative performance was better in women for all models. There was considerable heterogeneity in the c-statistic between studies, likely due to differences in population characteristics.
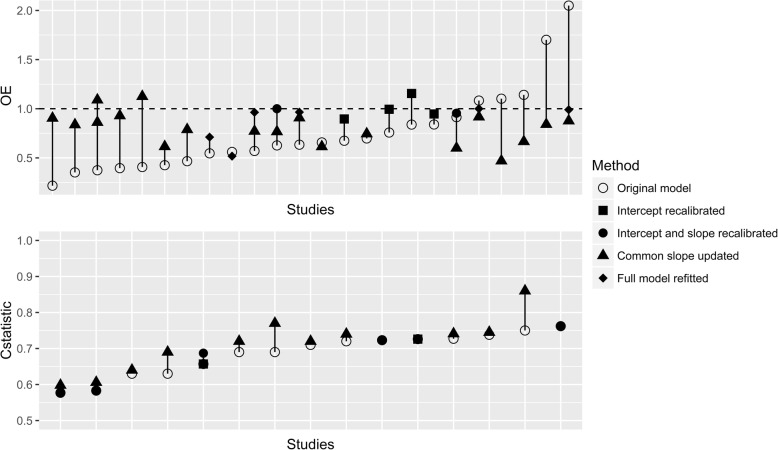
Conclusions: The Framingham Wilson, ATP III and PCE discriminate comparably well but all overestimate the risk of developing CVD, especially in higher risk populations. Because the extent of miscalibration substantially varied across settings, we highly recommend that researchers further explore reasons for overprediction and that the models be updated for specific populations.
Keywords: Cardiovascular disease; Meta-analysis; Prediction models; Prognosis; Systematic review.
Conflict of interest statement
The authors declare that they have no competing interests.
Figures
Similar articles
-
Validity of the models predicting 10-year risk of cardiovascular diseases in Asia: A systematic review and prediction model meta-analysis.PLoS One. 2023 Nov 30;18(11):e0292396. doi: 10.1371/journal.pone.0292396. eCollection 2023. PLoS One. 2023. PMID: 38032893 Free PMC article.
-
External validation of two Framingham cardiovascular risk equations and the Pooled Cohort equations: A nationwide registry analysis.Int J Cardiol. 2019 May 15;283:165-170. doi: 10.1016/j.ijcard.2018.11.001. Epub 2018 Nov 5. Int J Cardiol. 2019. PMID: 30429082
-
External validation and comparison of four cardiovascular risk prediction models with data from the Australian Diabetes, Obesity and Lifestyle study.Med J Aust. 2019 Mar;210(4):161-167. doi: 10.5694/mja2.12061. Epub 2019 Jan 18. Med J Aust. 2019. PMID: 30656697
-
Comparison of application of the ACC/AHA guidelines, Adult Treatment Panel III guidelines, and European Society of Cardiology guidelines for cardiovascular disease prevention in a European cohort.JAMA. 2014 Apr 9;311(14):1416-23. doi: 10.1001/jama.2014.2632. JAMA. 2014. PMID: 24681960
-
Performance of Cardiovascular Risk Prediction Models Among People Living With HIV: A Systematic Review and Meta-analysis.JAMA Cardiol. 2023 Feb 1;8(2):139-149. doi: 10.1001/jamacardio.2022.4873. JAMA Cardiol. 2023. PMID: 36576812 Free PMC article.
Cited by
-
Cardiovascular risk in US adults with nonalcoholic steatohepatitis (NASH) vs. matched non-NASH controls, National Health and Nutrition Examination Survey, 2017-2020.PLoS One. 2024 Aug 27;19(8):e0309617. doi: 10.1371/journal.pone.0309617. eCollection 2024. PLoS One. 2024. PMID: 39190769 Free PMC article.
-
Improving Cardiovascular Disease Primary Prevention Treatment Thresholds in a New England Health Care System.JACC Adv. 2024 Sep 6;3(10):101257. doi: 10.1016/j.jacadv.2024.101257. eCollection 2024 Oct. JACC Adv. 2024. PMID: 39290815 Free PMC article.
-
Disease Risk Score Derivation and Validation in Abu Dhabi, United Arab Emirates: A Retrospective Cohort Study.J Am Heart Assoc. 2024 Dec 3;13(23):e035930. doi: 10.1161/JAHA.124.035930. Epub 2024 Nov 29. J Am Heart Assoc. 2024. PMID: 39611388 Free PMC article.
-
Relationship Between 8-iso-prostaglandin-F2α and Predicted 10-Year Cardiovascular Risk in Hypertensive Patients.Life (Basel). 2025 Mar 4;15(3):401. doi: 10.3390/life15030401. Life (Basel). 2025. PMID: 40141746 Free PMC article.
-
Performance of the American Heart Association's PREVENT risk score for cardiovascular risk prediction in a multiethnic population.Nat Med. 2025 Aug;31(8):2655-2662. doi: 10.1038/s41591-025-03789-2. Epub 2025 Jul 4. Nat Med. 2025. PMID: 40615687
References
-
- Cardiovascular diseases (CVDs) Fact sheet N°317. http://www.who.int/mediacentre/factsheets/fs317/en/ Accessed 24 Oct 2016.
-
- Stone NJ, Robinson JG, Lichtenstein AH, Bairey Merz CN, Blum CB, Eckel RH, Goldberg AC, Gordon D, Levy D, Lloyd-Jones DM, et al. 2013 ACC/AHA guideline on the treatment of blood cholesterol to reduce atherosclerotic cardiovascular risk in adults: a report of the American College of Cardiology/American Heart Association Task Force on Practice Guidelines. Circulation. 2014;129(25 Suppl 2):S1–45. - PubMed
-
- National Cholesterol Education Program (NCEP) Expert Panel on Detection, Evaluation, and Treatment of High Blood Cholesterol in Adults (Adult Treatment Panel III) Third Report of the National Cholesterol Education Program (NCEP) Expert Panel on Detection, Evaluation, and Treatment of High Blood Cholesterol in Adults (Adult Treatment Panel III) final report. Circulation. 2002;106(25):3143–3421. - PubMed
-
- Wilson PW, D’Agostino RB, Levy D, Belanger AM, Silbershatz H, Kannel WB. Prediction of coronary heart disease using risk factor categories. Circulation. 1998;97(18):1837–1847. - PubMed
Publication types
MeSH terms
LinkOut - more resources
Full Text Sources
Miscellaneous
