. 2019 Jun 12;17(1):47.
doi: 10.1186/s12915-019-0660-6.

The impact of skin care products on skin chemistry and microbiome dynamics

Affiliations

The impact of skin care products on skin chemistry and microbiome dynamics

Amina Bouslimani et al. BMC Biol. .

Abstract

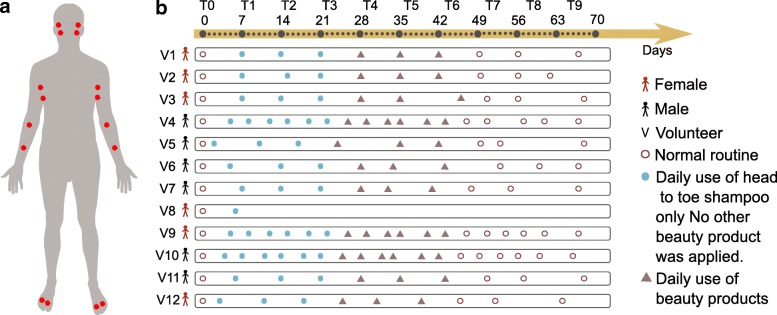
Background: Use of skin personal care products on a regular basis is nearly ubiquitous, but their effects on molecular and microbial diversity of the skin are unknown. We evaluated the impact of four beauty products (a facial lotion, a moisturizer, a foot powder, and a deodorant) on 11 volunteers over 9 weeks.

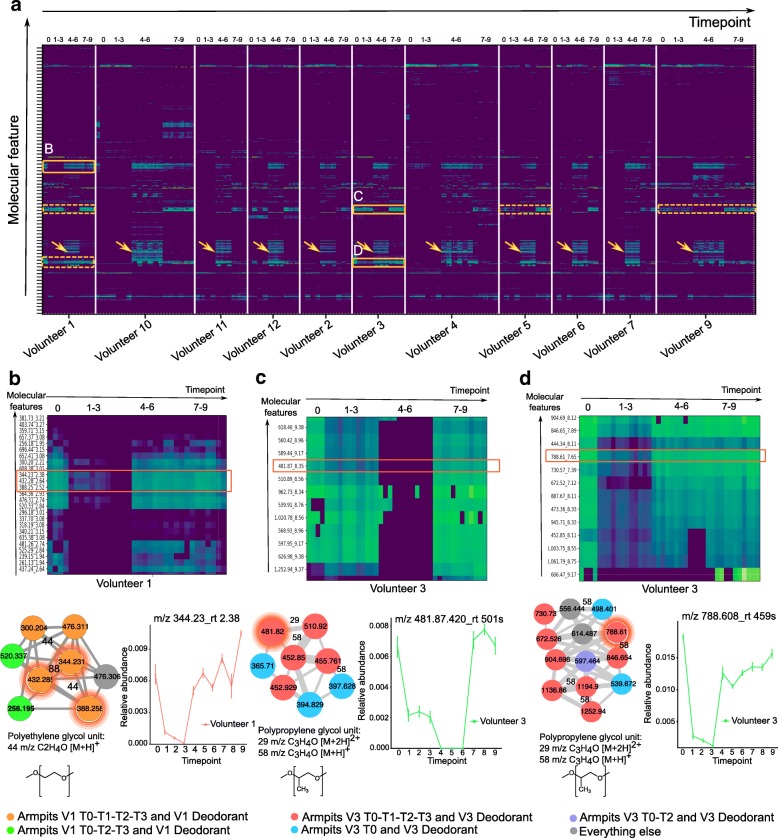
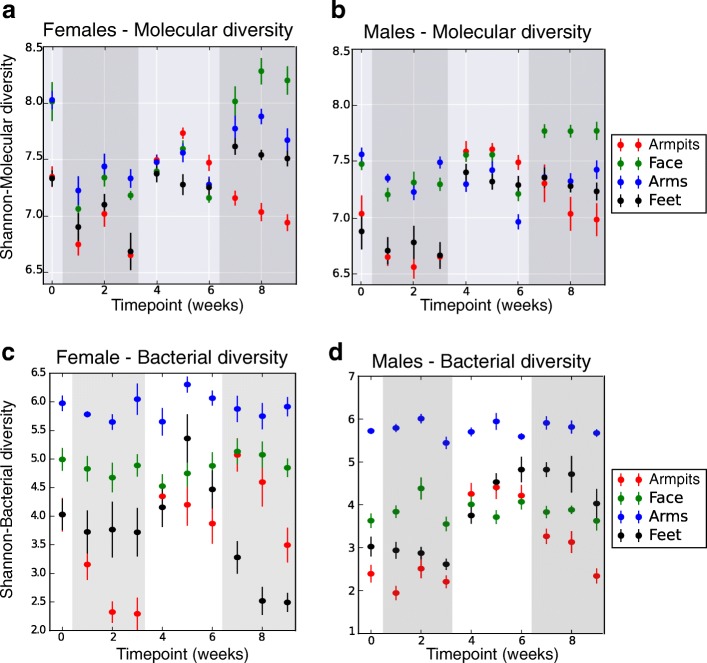
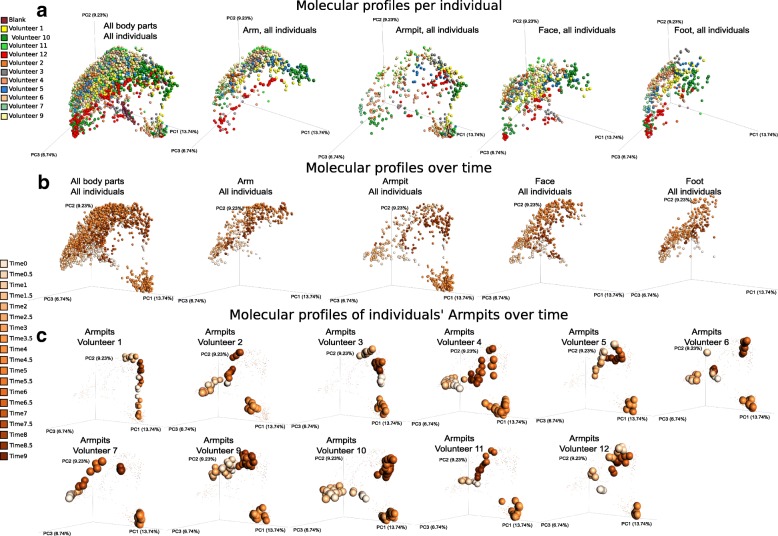
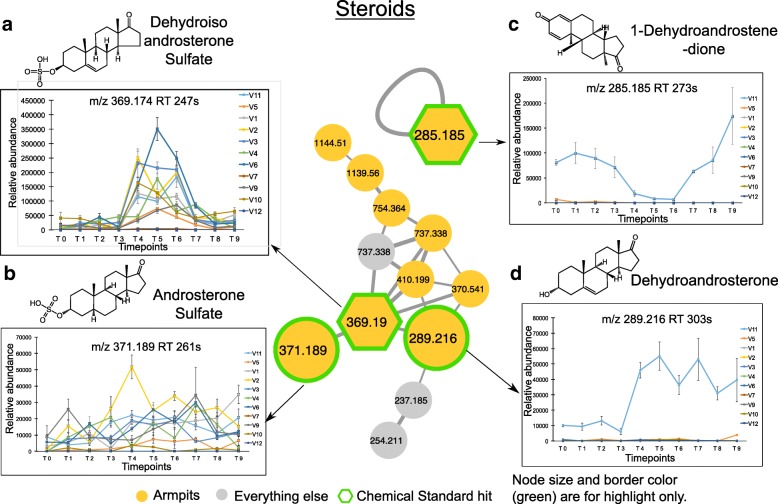
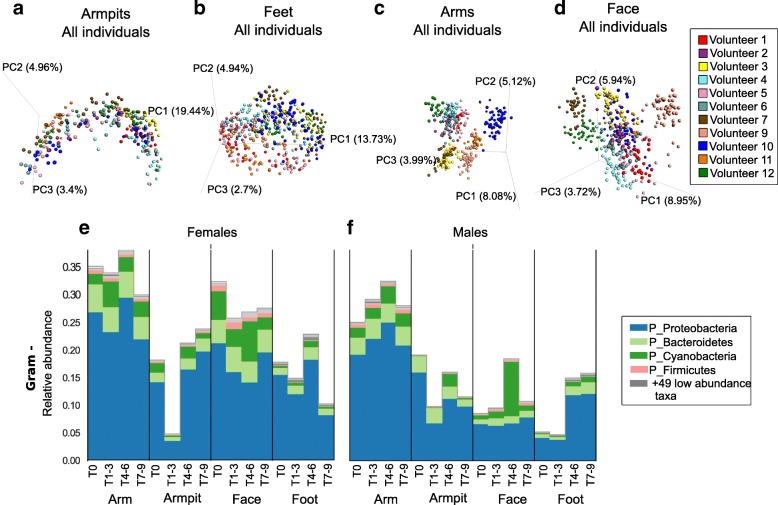
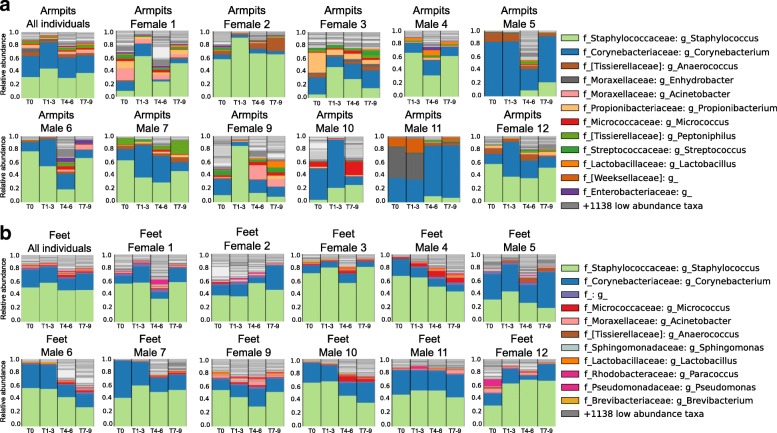
Results: Mass spectrometry and 16S rRNA inventories of the skin revealed decreases in chemical as well as in bacterial and archaeal diversity on halting deodorant use. Specific compounds from beauty products used before the study remain detectable with half-lives of 0.5-1.9 weeks. The deodorant and foot powder increased molecular, bacterial, and archaeal diversity, while arm and face lotions had little effect on bacterial and archaeal but increased chemical diversity. Personal care product effects last for weeks and produce highly individualized responses, including alterations in steroid and pheromone levels and in bacterial and archaeal ecosystem structure and dynamics.

Conclusions: These findings may lead to next-generation precision beauty products and therapies for skin disorders.

Keywords: 16S rRNA sequencing; Bacteria; Mass spectrometry; Metabolomics; Skin; Skin care products.


Conflict of interest statement

Dorrestein is on the advisory board for SIRENAS, a company that aims to find therapeutics from ocean environments. There is no overlap between this research and the company. The other authors declare that they have no competing interests.

Figures

Fig. 1
Fig. 1
Study design and representation of changes in personal care regime over the course of 9 weeks. a Six males and six females were recruited and sampled using swabs on two locations from each body part (face, armpits, front forearms, and between toes) on the right and left side. The locations sampled were the face—upper cheek bone and lower jaw, armpit—upper and lower area, arm—front of elbow (antecubitis) and forearm (antebrachium), and feet—in between the first and second toe and third and fourth toe. Volunteers were asked to follow specific instructions for the use of skin care products. b Following the use of their personal skin care products (brown circles), all volunteers used only the same head to toe shampoo during the first 3 weeks (week 1–week 3) and no other beauty product was applied (solid blue circle). The following 3 weeks (week 4–week 6), four selected commercial beauty products were applied daily by all volunteers on the specific body part (deodorant antiperspirant for the armpits, soothing foot powder for the feet between toes, sunscreen for the face, and moisturizer for the front forearm) (triangles) and continued to use the same shampoo. During the last 3 weeks (week 7–week 9), all volunteers went back to their normal routine and used their personal beauty products (circles). Samples were collected once a week (from day 0 to day 68—10 timepoints from T0 to T9) for volunteers 1, 2, 3, 4, 5, 6, 7, 9, 10, 11, and 12, and on day 0 and day 6 for volunteer 8, who withdraw from the study after day 6. For 3 individuals (volunteers 4, 9, 10), samples were collected twice a week (19 timepoints total). Samples collected for 11 volunteers during 10 timepoints: 11 volunteers × 10 timepoints × 4 samples × 4 body sites = 1760. Samples collected from 3 selected volunteers during 9 additional timepoints: 3 volunteers × 9 timepoints × 4 samples × 4 body sites = 432. See also the “Subject recruitment and sample collection” section in the “Methods” section
Fig. 2
Fig. 2
Monitoring the persistence of personal care product ingredients in the armpits over a 9-week period. a Heatmap representation of the most abundant molecular features detected in the armpits of all individuals during the four phases (0: initial, 1–3: no beauty products, 4–6: common products, and 7–9: personal products). Green color in the heatmap represents the highest molecular abundance and blue color the lowest one. Orange boxes with plain lines represent enlargement of cluster of molecules that persist on the armpits of volunteer 1 (b) and volunteer 3 (c, d). Orange clusters with dotted lines represent same clusters of molecules found on the armpits of other volunteers. Orange arrows represent the cluster of compounds characteristic of the antiperspirant used during T4–T6. b Polyethylene glycol (PEG) molecular clusters that persist on the armpits of individual 1. The molecular subnetwork, representing molecular families [24], is part of a molecular network (http://gnps.ucsd.edu/ProteoSAFe/status.jsp?task=f5325c3b278a46b29e8860ec5791d5ad) generated from MS/MS data collected from the armpits of volunteer 1 (T0–T3) MSV000081582 and MS/MS data collected from the deodorant used by volunteer 1 before the study started (T0) MSV000081580. c, d Polypropylene glycol (PPG) molecular families that persist on the armpits of individual 3, along with the corresponding molecular subnetwork that is part of the molecular network accessible here http://gnps.ucsd.edu/ProteoSAFe/status.jsp?task=aaa1af68099d4c1a87e9a09f398fe253. Subnetworks were generated from MS/MS data collected from the armpits of volunteer 3 (T0–T3) MSV000081582 and MS/MS data collected from the deodorant used by volunteer 3 at T0 MSV000081580. The network nodes were annotated with colors. Nodes represent MS/MS spectra found in armpit samples of individual 1 collected during T0, T1, T2, and T3 and in personal deodorant used by individual 1 (orange nodes); armpit samples of individual 1 collected during T0, T2, and T3 and personal deodorant used by individual 1 (green nodes); armpit samples of individual 3 collected during T0, T1, T2, and T3 and in personal deodorant used by individual 3 (red nodes); armpit samples of individual 3 collected during T0 and in personal deodorant used by individual 3 (blue nodes); and armpit samples of individual 3 collected during T0 and T2 and in personal deodorant used by individual 3 (purple nodes). Gray nodes represent everything else. Error bars represent standard error of the mean calculated at each timepoint from four armpit samples collected from the right and left side of each individual separately. See also Additional file 1: Figure S1
Fig. 3
Fig. 3
Molecular and bacterial diversity over a 9-week period, comparing samples based on their molecular (UPLC-Q-TOF-MS) or bacterial (16S rRNA amplicon) profiles. Molecular and bacterial diversity using the Shannon index was calculated from samples collected from each body part at each timepoint, separately for female (n = 5) and male (n = 6) individuals. Error bars represent standard error of the mean calculated at each timepoint, from up to four samples collected from the right and left side of each body part, of females (n = 5) and males (n = 6) separately. a, b Molecular alpha diversity measured using the Shannon index from five females (left panel) and six males (right panel), over 9 weeks, from four distinct body parts (armpits, face, arms, feet). c, d Bacterial alpha diversity measured using the Shannon index, from skin samples collected from five female (left panel) and six male individuals (right panel), over 9 weeks, from four distinct body parts (armpits, face, arms, feet). See also Additional file 1: Figure S2
Fig. 4
Fig. 4
Individualized influence of beauty product application on skin metabolomics profiles over time. a Multivariate statistical analysis (principal coordinate analysis (PCoA)) comparing mass spectrometry data collected over 9 weeks from the skin of 11 individuals, all body parts, combined (first plot from the left) and then displayed separately (arm, armpits, face, feet). Color scale represents volunteer ID. The PCoA was calculated on all samples together, and subsets of the data are shown in this shared space and the other panels. b The molecular profiles collected over 9 weeks from all body parts, combined then separately (arm, armpits, face, feet). c Representative molecular profiles collected over 9 weeks from armpits of 11 individuals (volunteers 1, 2, 3, 4, 5, 6, 7, 9, 10, 11, 12). Color gradient in b and c represents timepoints (time 0 to time 9), ranging from the lightest orange color to the darkest one that represent the earliest (time 0) to the latest (time 9) timepoint, respectively. 0.5 timepoints represent additional timepoints where three selected volunteers were samples (volunteers 4, 9, and 10). PCoA plots were generated using the Bray–Curtis dissimilarity matrix and visualized in Emperor [28]. See also Additional file 1: Figure S3
Fig. 5
Fig. 5
Underarm steroids and their longitudinal abundance. ad Steroid molecular families in the armpits and their relative abundance over a 9-week period. Molecular networking was applied to characterize chemistries from the skin of 11 healthy individuals. The full network is shown in Additional file 1: Figure S4A, and networking parameters can be found here http://gnps.ucsd.edu/ProteoSAFe/status.jsp?task=284fc383e4c44c4db48912f01905f9c5 for MS/MS datasets MSV000081582. Each node represents a consensus of a minimum of 3 identical MS/MS spectra. Yellow nodes represent MS/MS spectra detected in armpits samples. Hexagonal shape represents MS/MS spectra match between skin samples and chemical standards. Plots are representative of the relative abundance of each compound over time, calculated separately from LC-MS1 data collected from the armpits of each individual. Steroids detected in armpits are a, dehydroisoandrosterone sulfate (m/z 369.190, rt 247 s), b androsterone sulfate (m/z 371.189, rt 261 s), c 1-dehydroandrostenedione (m/z 285.185, rt 273 s), and d dehydroandrosterone (m/z 289.216, rt 303 s). Relative abundance over time of each steroid compound is represented. Error bars represent the standard error of the mean calculated at each timepoint from four armpit samples from the right and left side of each individual separately. See also Additional file 1: Figures S4-S8
Fig. 6
Fig. 6
Longitudinal variation of skin bacterial communities in association with beauty product use. a-d Bacterial profiles collected from skin samples of 11 individuals, over 9 weeks, from four distinct body parts a) armpits, b) feet, c) arms and d) face, using multivariate statistical analysis (Principal Coordinates Analysis PCoA) and unweighted Unifrac metric. Each color represents bacterial samples collected from an individual. PCoA were calculated separately for each body part. e, f Representative Gram-negative (Gram -) bacteria collected from arms, armpits, face and feet of e) female and f) male participants. See also Additional file 1: Figure S9A, B showing Gram-negative bacterial communities represented at the genus level
Fig. 7
Fig. 7
Person-to-person bacterial variabilities over time in the armpits and feet. a Armpit microbiome changes when stopping personal care product use, then resuming. Armpit bacterial composition of the 11 volunteers combined, then separately, (female 1, female 2, female 3, male 4, male 5, male 6, male 7, female 9, male 10, male 11, female 12) according to the four periods within the experiment. b Feet bacterial variation over time of the 12 volunteers combined, then separately (female 1, female 2, female 3, male 4, male 5, male 6, male 7, female 9, male 10, male 11, female 12) according to the four periods within the experiment. See also Additional file 1: Figure S9-S13

References

    1. Oh J, Byrd AL, Deming C, Conlan S, Kong HH, Segre JA. Biogeography and individuality shape function in the human skin metagenome. Nature. 2014;514(7520):59–64. - PMC - PubMed
    1. Grice EA, Segre JA. The skin microbiome. Nat Rev Microbiol. 2011;9(4):244–253. - PMC - PubMed
    1. Costello EK, Lauber CL, Hamady M, Fierer N, Gordon JI, Knight R. Bacterial community variation in human body habitats across space and time. Science. 2009;326(5960):1694–1697. - PMC - PubMed
    1. Grice EA, Kong HH, Conlan S, Deming CB, Davis J, Young AC, et al. Topographical and temporal diversity of the human skin microbiome. Science. 2009;324(5931):1190–1192. - PMC - PubMed
    1. Urban J, Fergus DJ, Savage AM, Ehlers M, Menninger HL, Dunn RR, et al. The effect of habitual and experimental antiperspirant and deodorant product use on the armpit microbiome. PeerJ. 2016;4:e1605. - PMC - PubMed

Publication types