. 2019 Aug 13;93(17):e00526-19.
doi: 10.1128/JVI.00526-19. Print 2019 Sep 1.

Porcine Reproductive and Respiratory Syndrome Virus Activates Lipophagy To Facilitate Viral Replication through Downregulation of NDRG1 Expression

Affiliations

Porcine Reproductive and Respiratory Syndrome Virus Activates Lipophagy To Facilitate Viral Replication through Downregulation of NDRG1 Expression

Jiang Wang et al. J Virol. .

Abstract

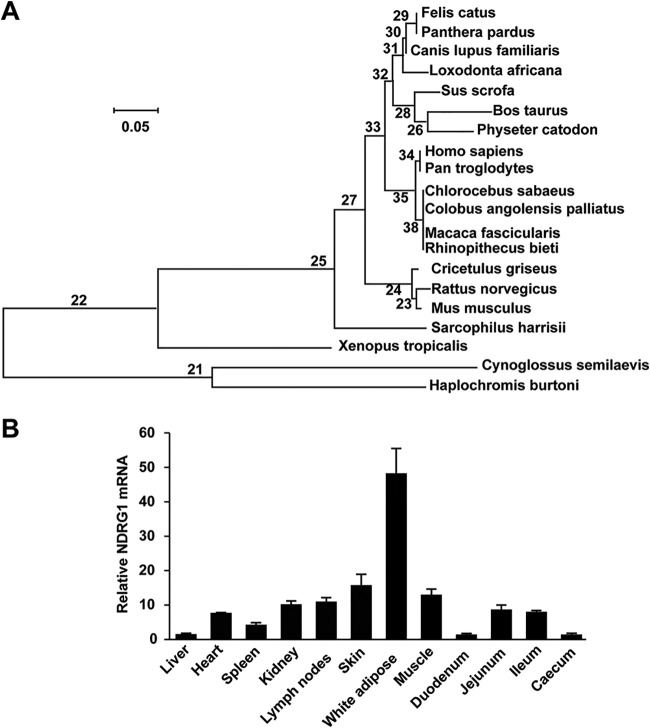
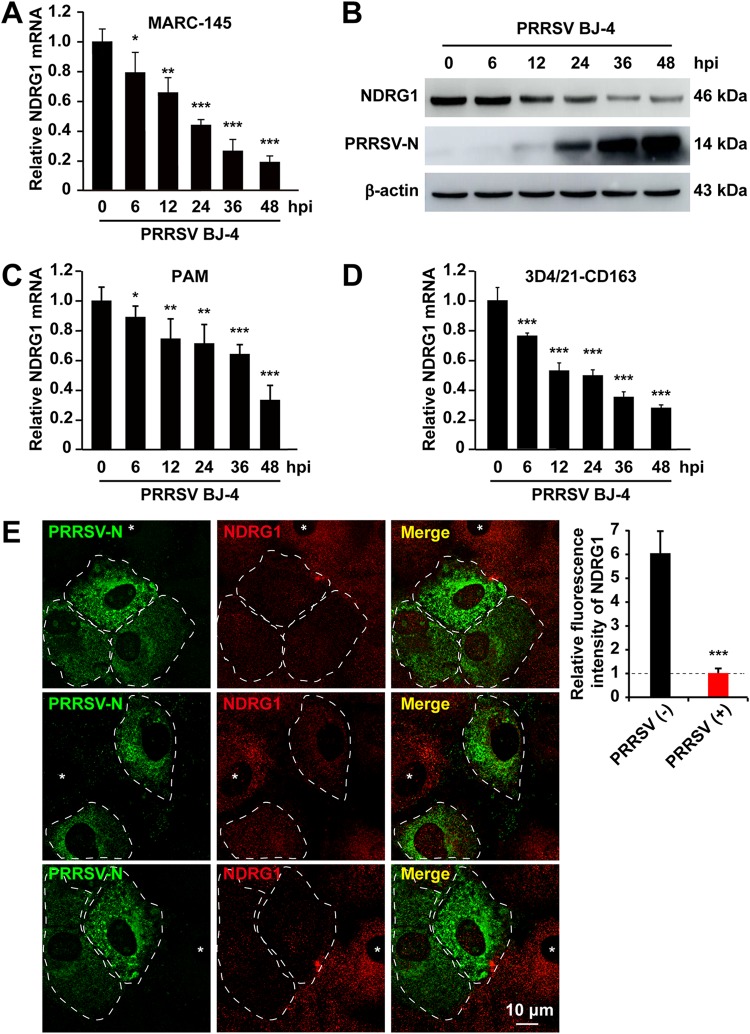
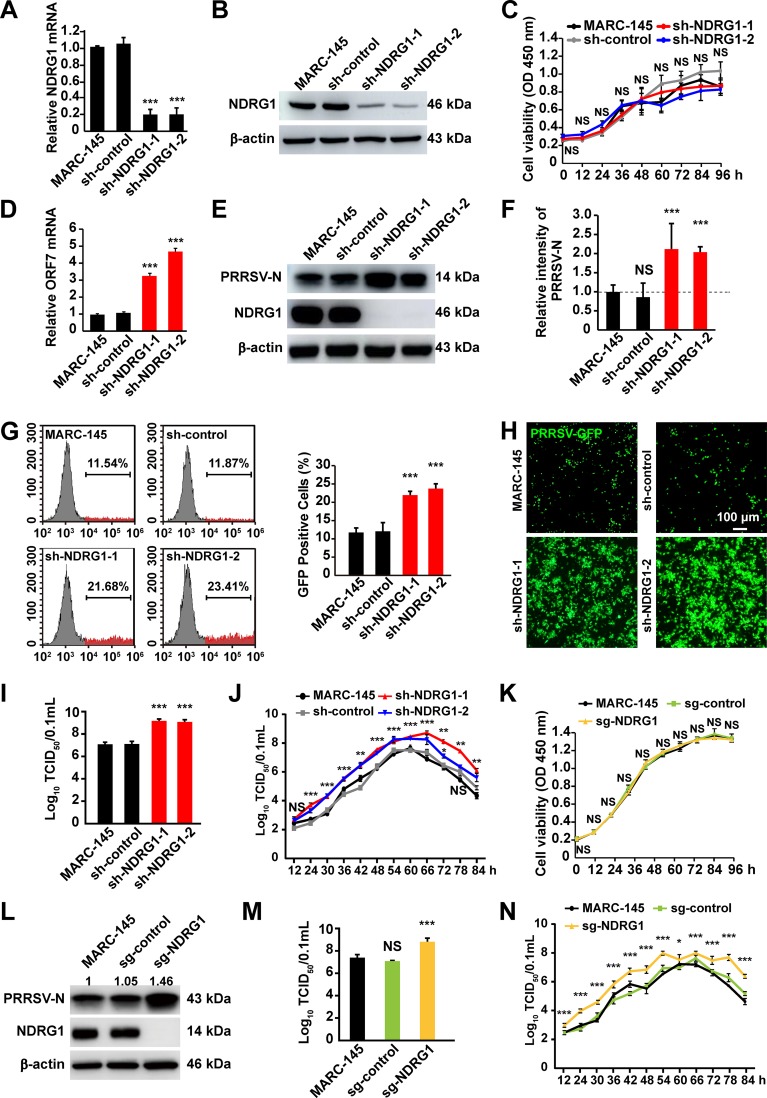
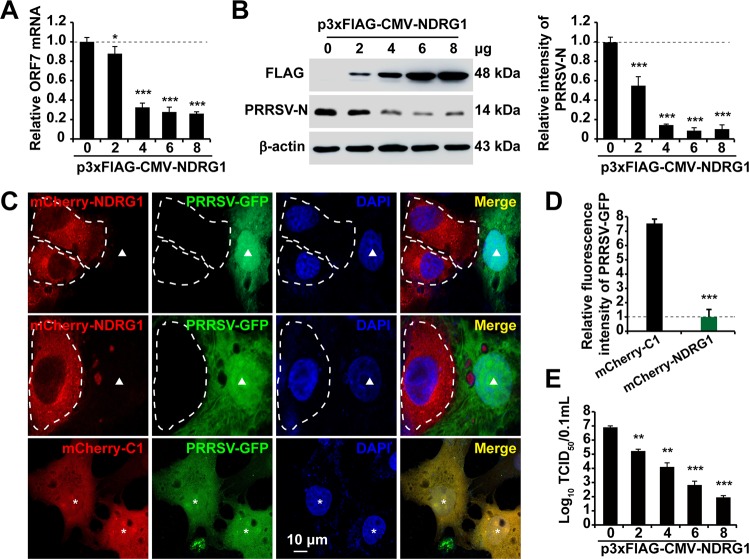
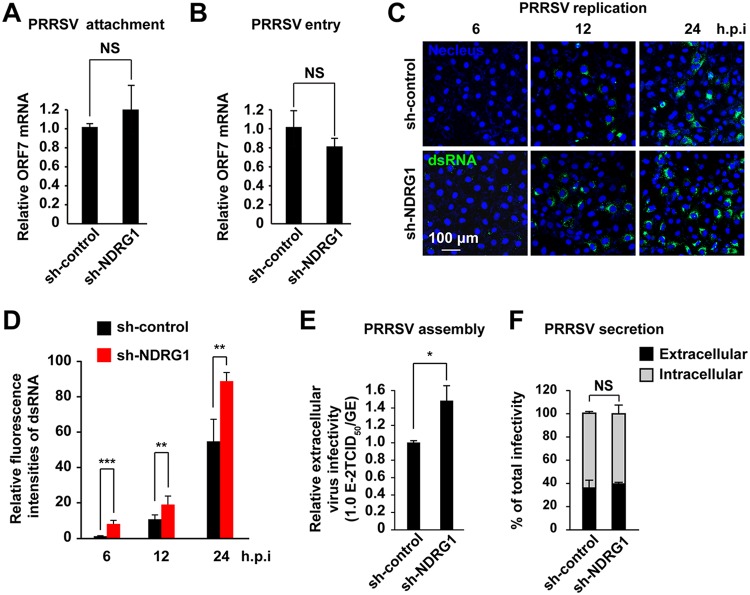
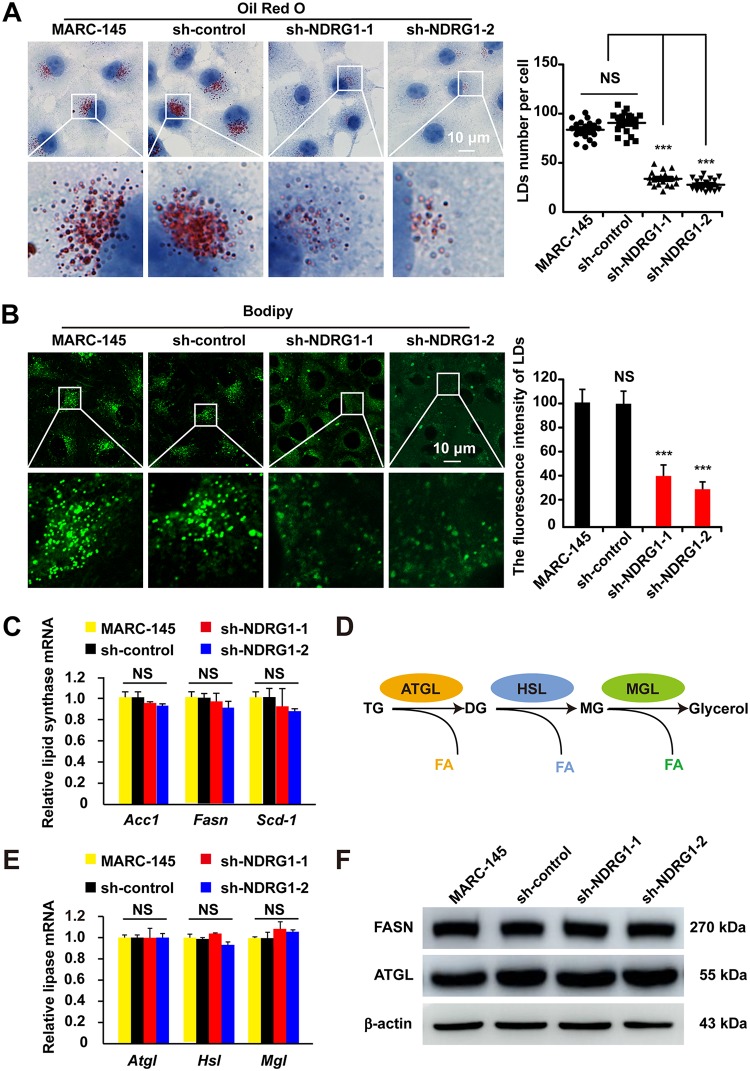
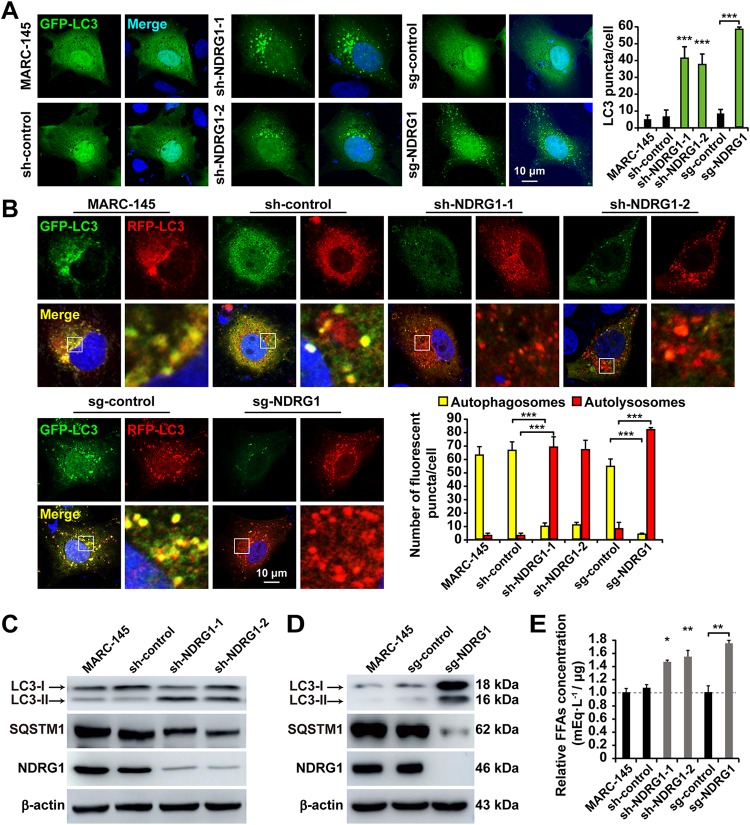
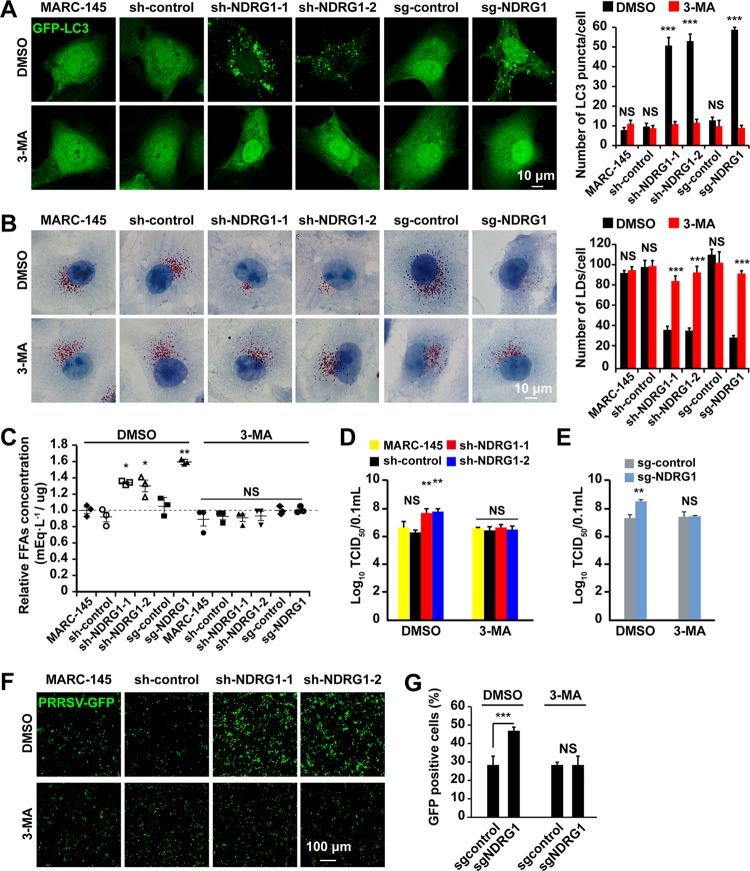
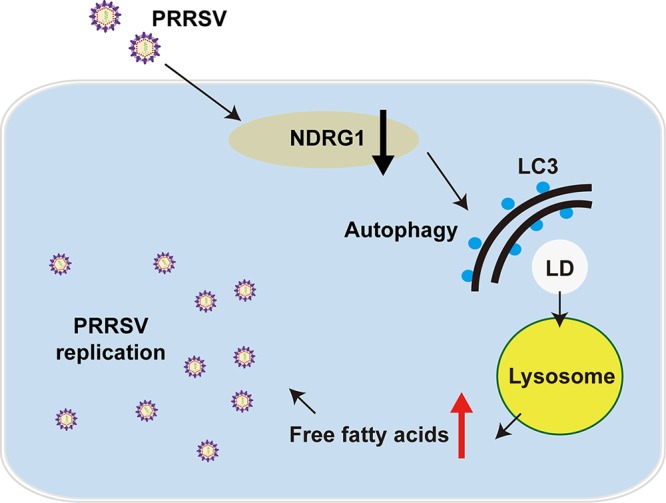
Autophagy maintains cellular homeostasis by degrading organelles, proteins, and lipids in lysosomes. Autophagy is involved in the innate and adaptive immune responses to a variety of pathogens. Some viruses can hijack host autophagy to enhance their replication. However, the role of autophagy in porcine reproductive and respiratory syndrome virus (PRRSV) infection is unclear. Here, we show that N-Myc downstream-regulated gene 1 (NDRG1) deficiency induced autophagy, which facilitated PRRSV replication by regulating lipid metabolism. NDRG1 mRNA is expressed ubiquitously in most porcine tissues and most strongly in white adipose tissue. PRRSV infection downregulated the expression of NDRG1 mRNA and protein, while NDRG1 deficiency contributed to PRRSV RNA replication and progeny virus assembly. NDRG1 deficiency reduced the number of intracellular lipid droplets (LDs), but the expression levels of key genes in lipogenesis and lipolysis were not altered. Our results also show that NDRG1 deficiency promoted autophagy and increased the subsequent yields of hydrolyzed free fatty acids (FFAs). The reduced LD numbers, increased FFA levels, and enhanced PRRSV replication were abrogated in the presence of an autophagy inhibitor. Overall, our findings suggest that NDRG1 plays a negative role in PRRSV replication by suppressing autophagy and LD degradation.IMPORTANCE Porcine reproductive and respiratory syndrome virus (PRRSV), an enveloped single-positive-stranded RNA virus, causes acute respiratory distress in piglets and reproductive failure in sows. It has led to tremendous economic losses in the swine industry worldwide since it was first documented in the late 1980s. Vaccination is currently the major strategy used to control the disease. However, conventional vaccines and other strategies do not provide satisfactory or sustainable prevention. Therefore, safe and effective strategies to control PRRSV are urgently required. The significance of our research is that we demonstrate a previously unreported relationship between PRRSV, NDRG1, and lipophagy in the context of viral infection. Furthermore, our data point to a new role for NDRG1 in autophagy and lipid metabolism. Thus, NDRG1 and lipophagy will have significant implications for understanding PRRSV pathogenesis for developing new therapeutics.

Keywords: N-Myc downstream-regulated gene 1; autophagy; lipid droplet; lipophagy; porcine reproductive and respiratory syndrome virus.


Figures

FIG 1
FIG 1
Expression analysis of NDRG1. (A) Phylogenetic tree of NDRG1 proteins constructed with MEGA6 software. Protein sequences of NDRG1 from different species were taken from GenBank, under accession numbers XP_020944534 (Sus scrofa), NP_001030181 (Bos taurus), NP_001011991 (Rattus norvegicus), NP_032707 (Mus musculus), NP_001128714 (Homo sapiens), XP_007999783 (Chlorocebus sabaeus), XP_005628031 (Canis lupus familiaris), XP_012820024 (Xenopus tropicalis), XP_019315342 (Panthera pardus), XP_017730622 (Rhinopithecus bieti), XP_012397285 (Sarcophilus harrisii), XP_005935015 (Haplochromis burtoni), XP_005564176 (Macaca fascicularis), XP_011793534 (Colobus angolensis palliatus), XP_008321638 (Cynoglossus semilaevis), XP_007106495 (Physeter catodon), XP_023104387 (Felis catus), XP_010586814 (Loxodonta africana), XP_009454233 (Pan troglodytes), and XP_007605917 (Cricetulus griseus). (B) NDRG1 mRNA levels were detected in porcine tissues by RT-qPCR. Values were normalized to the β-actin (ACTB) mRNA levels. Relative amounts of NDRG1 mRNA were compared with those in the liver. Data represent means ± standard errors of the means from three independent experiments.
FIG 2
FIG 2
PRRSV infection reduces NDRG1 mRNA and protein levels. (A) MARC-145 cells were infected with PRRSV BJ-4 at an MOI of 10 for the indicated times. RNA was extracted from uninfected and infected cells. NDRG1 mRNA levels were detected by RT-qPCR. Values were normalized to β-actin (ACTB) mRNA levels. Data are the means ± standard errors of the means from three independent experiments. *, P < 0.05; **, P < 0.01; ***, P < 0.0001 (by one-way ANOVA). hpi, hours postinfection. (B) Lysates of uninfected or infected cells were analyzed by immunoblotting using anti-NDRG1 and anti-PRRSV-N antibodies. β-Actin was used as the loading control. (C) PAM cells were infected with PRRSV BJ-4 at an MOI of 5 for the indicated times. RNA was extracted from uninfected and infected cells. NDRG1 mRNA levels were detected by RT-qPCR. (D) 3D4/21-CD163 cells were infected with PRRSV BJ-4 at an MOI of 10 for the indicated times. RNA was extracted from uninfected and infected cells. NDRG1 mRNA levels were detected by RT-qPCR. (E) Staining for NDRG1 was reduced in PRRSV-infected cells. MARC-145 cells were infected with PRRSV BJ-4 at an MOI of 10 for 48 h and then fixed and stained with antibodies directed against PRRSV-N (green) and NDRG1 (red). White dotted lines highlight infected cells, and asterisks indicate uninfected cells. Fluorescence intensities were quantified in both uninfected and PRRSV-positive cells (n = 40) with ImageJ. ***, P < 0.0001 (by an unpaired two-tailed t test).
FIG 3
FIG 3
Knockdown of NDRG1 promotes PRRSV infection. (A) NDRG1 mRNA levels in cells stably expressing shRNAs were detected by RT-qPCR. MARC-145 cells and scrambled control shRNA (sh-control)-expressing cells were used as controls. Values were normalized to the β-actin (ACTB) mRNA levels. ***, P < 0.0001 (by one-way ANOVA). (B) Immunoblot analysis of NDRG1 expression in cells from panel A. Antibodies used are indicated on the left. (C) Proliferation of MARC-145 cells stably expressing sh-control or sh-NDRG1 was determined by a CCK assay. OD, optical density; NS, not significant (by one-way ANOVA). (D) Cells were infected with PRRSV BJ-4 (MOI = 10) for 48 h. The mRNA levels of PRRSV ORF7 in the cells were detected by RT-qPCR. ***, P < 0.0001 (by one-way ANOVA). (E) Cells were infected with PRRSV BJ-4 (MOI = 10) for 48 h. Immunoblot analyses were performed with the indicated antibodies. (F) Semiquantitative densitometric analysis of PRRSV-N from panel E was performed with ImageJ. Protein content was normalized to the corresponding β-actin content. NS, not significant; ***, P < 0.0001 (by one-way ANOVA). (G) Cells were infected with PRRSV-GFP (MOI = 10) for 48 h, and fluorescence-positive cells were measured by flow cytometry. Gray peaks, GFP-negative cells (cells not infected with PRRSV); red peaks, GFP-positive cells (cells infected with PRRSV). ***, P < 0.0001 (by one-way ANOVA). (H) Cells were infected with PRRSV-GFP (MOI = 10) for 48 h, and fluorescence was detected with a fluorescence microscope. The bottom panel shows bright-field images of the corresponding cells. (I) Cells were infected with PRRSV BJ-4 (MOI = 10) for 48 h. Virus was harvested with three freeze-thaw cycles, and the viral titer was determined by a TCID50 assay. ***, P < 0.0001 (by one-way ANOVA). (J) Growth curve of PRRSV BJ-4. Cells were incubated with PRRSV BJ-4 (MOI = 10) at 4°C for 1 h and then washed twice with PBS. At each hour after infection, the infected cells were frozen and thawed twice in an equal volume of the supernatant for titrating the intracellular virus with the TCID50 assay. (K) Proliferation of MARC-145 cells and MARC-145 cells transfected with control sgRNA (sg-control) or with sgRNA mediating NDRG1 knockout (sg-NDRG1) was determined by a CCK assay. NS, not significant (by one-way ANOVA). (L) Cells were infected with PRRSV BJ-4 (MOI = 10) for 48 h. Immunoblot analyses were performed with the indicated antibodies. (M) Growth curve of PRRSV BJ-4 in NDRG1−/− cells. Cells were incubated with PRRSV BJ-4 (MOI = 10) at 4°C for 1 h and then washed twice with PBS. At each hour after infection, the infected cells were frozen and thawed twice in an equal volume of the supernatant for titrating the intracellular virus by a TCID50 assay. (N) Cells were infected with PRRSV BJ-4 (MOI = 10) for 48 h. Virus was harvested with three freeze-thaw cycles, and the viral titer was determined by a TCID50 assay. ***, P < 0.0001 (by one-way ANOVA).
FIG 4
FIG 4
Overexpression of NDRG1 reduces PRRSV replication. (A) MARC-145 cells were transfected with different concentrations of a plasmid encoding FLAG-NDRG1 or with p3×Flag-CMV-10 for 24 h and then infected with PRRSV BJ-4 (MOI = 10) for 36 h. The mRNA levels of PRRSV ORF7 were detected by RT-qPCR. Values were normalized to the β-actin (ACTB) mRNA levels. *, P < 0.05; ***, P < 0.0001. (B) Immunoblot analysis of PRRSV-N expression in cells from panel A. Antibodies used are indicated on the left. β-Actin was used as the loading control. Semiquantitative densitometric analyses of FLAG-NDRG1 and PRRSV-N were performed using ImageJ software. The protein content was normalized to the corresponding β-actin level. ***, P < 0.0001 (by one-way ANOVA). (C) MARC-145 cells were transfected with plasmid mCherry-NDRG1 or mCherry-C1 for 24 h and then infected with PRRSV-GFP at an MOI of 10 for 36 h. Cells were fixed and stained with DAPI (4′,6-diamidino-2-phenylindole), and their fluorescence was detected by fluorescence microscopy. White dotted lines highlight NDRG1-transfected cells, arrowheads indicate PRRSV-GFP-infected cells transfected with mCherry-NDRG1, and asterisks indicate PRRSV-GFP-infected cells transfected with pmCherry-C1. (D) GFP fluorescence intensities were quantified in cells transfected with both pmCherry-C1 and pmCherry-NDRG1 (n = 40) using ImageJ. Data are means ± standard errors of the means. ***, P < 0.0001 (by an unpaired two-tailed t test). (E) MARC-145 cells were transfected with different concentrations of a plasmid encoding FLAG-NDRG1 or with p3×Flag-CMV-10 for 24 h and then infected with PRRSV BJ-4 (MOI = 10) for 36 h. Virus was harvested with three freeze-thaw cycles, and the viral titer was determined by a TCID50 assay. **, P < 0.01; ***, P < 0.0001 (by one-way ANOVA).
FIG 5
FIG 5
NDRG1 knockdown increases PRRSV replication and assembly. (A) PRRSV BJ-4 (MOI = 10) was allowed to bind to the surfaces of sh-control and sh-NDRG1 cells on ice for 1 h. After the cells were washed with PBS, the viral RNA was isolated and quantified by RT-qPCR with ORF7-specific primers. NS, not significant (by an unpaired two-tailed t test). (B) PRRSV BJ-4 (MOI = 10) was allowed to bind to the surfaces of sh-control and sh-NDRG1 cells on ice for 1 h (binding), and cells were then shifted to 37°C for 2 h (internalization). Intracellular viral RNA was isolated and quantified by RT-qPCR using ORF7-specific primers. NS, not significant (by an unpaired two-tailed t test). (C) Cells were infected with PRRSV BJ-4 at an MOI of 10 for the indicated times, before the cells were fixed and stained for double-stranded RNA (dsRNA) and with DAPI. Random fields of view were recorded with a confocal microscope. (D) Fluorescence intensities of dsRNA in panel C were quantified in cells containing PRRSV dsRNA. (E) Cells were infected with PRRSV BJ-4 at an MOI of 10 for 24 h. The efficiency of viral assembly in the supernatants was determined by comparing the infectious titers (TCID50 per milliliter) with the total PRRSV genome equivalents (GE). *, P < 0.05 (by an unpaired two-tailed t test). (F) Cells were infected with PRRSV BJ-4 at an MOI of 10 for 24 h. The efficiency of virus secretion was determined as the ratio of intra- and extracellular infectivity relative to the total infectivity. NS, not significant (by an unpaired two-tailed t test).
FIG 6
FIG 6
NDRG1 knockdown reduces intracellular LD numbers. (A) Cells were fixed and stained with oil red O. Nuclei were counterstained with hematoxylin. The boxed region in the top image is enlarged at the bottom. Each image is representative of results from three independent experiments. A plot of the LD numbers per cell in the oil red O images is shown. At least 80 cells were counted. NS, not significant; ***, P < 0.0001 (by one-way ANOVA). (B) LDs in cells were stained with BODIPY 493/503. The boxed region in the top image is enlarged at the bottom. Each image is representative of results from three independent experiments. ImageJ analysis was used for the semiquantification of the fluorescence intensity. NS, not significant; ***, P < 0.0001 (by one-way ANOVA). (C) ACC1, FASN, and SCD mRNA levels were examined by RT-qPCR in MARC-145 cells and shRNA-expressing cells. Values were normalized to β-actin (ACTB) mRNA levels. NS, not significant (by one-way ANOVA). (D) Schematic diagram of the coordinated breakdown of TG. (E) ATGL, HSL, and MGL mRNA levels were examined by RT-qPCR in MARC-145 cells and shRNA-expressing cells. Values were normalized to β-actin (ACTB) mRNA levels. NS, not significant (by one-way ANOVA). (F) Immunoblot analyses of FASN and ATGL expression in MARC-145 cells and shRNA-expressing cells. β-Actin was used as the loading control.
FIG 7
FIG 7
NDRG1 deficiency induces autophagy and increases the FFA content. (A) Cells were transfected with a plasmid encoding GFP-LC3 for 24 h and then fixed and stained with DAPI (blue). The number of GFP-LC3 puncta per cell was counted in 30 cells per group. ***, P < 0.0001 (by one-way ANOVA). (B) Cells were transfected with a plasmid encoding RFP-GFP-LC3 for 24 h and then fixed and stained with DAPI. The boxed region in the image is enlarged below. The numbers of autophagosomes (RFP- and GFP-positive puncta) and autolysosomes (only RFP-positive puncta) per cell were counted in 30 cells per group. ***, P < 0.0001 (by one-way ANOVA). (C) Immunoblot analysis of LC3 and SQSTM1 expression in MARC-145 cells and shRNA-expressing cells. β-Actin was used as the loading control. (D) Immunoblot analysis of LC3 and SQSTM1 expression in MARC-145 cells and NDRG1−/− cells. β-Actin was used as the loading control. (E) Cellular lipids were extracted from cells, and the amounts of FFAs were quantified. Values were normalized to the total cellular protein content. *, P < 0.05; **, P < 0.01 (by one-way ANOVA).
FIG 8
FIG 8
Inhibition of autophagy abrogates the promotion of PRRSV replication. (A) Cells transfected with a plasmid encoding GFP-LC3 were treated with DMSO or 3-MA for 24 h. The number of GFP-LC3 puncta per cell was counted in 30 cells per group. NS, not significant; ***, P < 0.0001 (by one-way ANOVA). (B) Cells were treated with DMSO or 3-MA for 24 h and then fixed and stained with oil red O. Nuclei were counterstained with hematoxylin. The average number of LDs per cell was counted in 30 cells per group. NS, not significant; ***, P < 0.0001 (by one-way ANOVA). (C) Cells were treated with DMSO or 3-MA for 24 h. Cellular lipids were extracted, and the amounts of FFAs were quantified. Values were normalized to the total cellular protein content. NS, not significant; *, P < 0.05 (by one-way ANOVA). (D) MARC-145 and shRNA-expressing cells were infected with PRRSV BJ-4 (MOI = 10) for 1 h. The virus was removed, and 3-MA was applied at 48 h postinfection. Virus was harvested with three freeze-thaw cycles, and the viral titer was determined by a TCID50 assay. NS, not significant; **, P < 0.01 (by one-way ANOVA). (E) sg-control and NDRG1−/− cells were infected with PRRSV BJ-4 (MOI = 10) for 1 h. The virus was removed, and 3-MA was applied at 48 h postinfection. Virus was harvested with three freeze-thaw cycles, and the viral titer was determined by a TCID50 assay. NS, not significant; **, P < 0.01 (by one-way ANOVA). (F) MARC-145 and shRNA-expressing cells were infected with PRRSV-GFP (MOI = 10) for 1 h. The virus was removed, and 3-MA was applied at 48 h postinfection. Fluorescence was detected with a fluorescence microscope. The bottom panel shows bright-field images of the corresponding cells. (G) sg-control and NDRG1−/− cells were infected with PRRSV-GFP (MOI = 10) for 48 h, and the fluorescence-positive cells were measured by flow cytometry. ***, P < 0.0001 (by one-way ANOVA).
FIG 9
FIG 9
NDRG1 deficiency induces autophagy, which alters cellular lipid metabolism, promoting PRRSV replication. PRRSV infection reduced the expression of NDRG1, and the loss of NDRG1 induced autophagy. Autophagy provides FFAs via LD degradation, which increases the virus yield.

Similar articles

Cited by

References

    1. Lunney JK, Benfield DA, Rowland RR. 2010. Porcine reproductive and respiratory syndrome virus: an update on an emerging and re-emerging viral disease of swine. Virus Res 154:1–6. doi:10.1016/j.virusres.2010.10.009. - DOI - PMC - PubMed
    1. Rossow KD. 1998. Porcine reproductive and respiratory syndrome. Vet Pathol 35:1–20. doi:10.1177/030098589803500101. - DOI - PubMed
    1. Snijder EJ, Kikkert M, Fang Y. 2013. Arterivirus molecular biology and pathogenesis. J Gen Virol 94:2141–2163. doi:10.1099/vir.0.056341-0. - DOI - PubMed
    1. Tian K, Yu X, Zhao T, Feng Y, Cao Z, Wang C, Hu Y, Chen X, Hu D, Tian X, Liu D, Zhang S, Deng X, Ding Y, Yang L, Zhang Y, Xiao H, Qiao M, Wang B, Hou L, Wang X, Yang X, Kang L, Sun M, Jin P, Wang S, Kitamura Y, Yan J, Gao GF. 2007. Emergence of fatal PRRSV variants: unparalleled outbreaks of atypical PRRS in China and molecular dissection of the unique hallmark. PLoS One 2:e526. doi:10.1371/journal.pone.0000526. - DOI - PMC - PubMed
    1. Lager KM, Schlink SN, Brockmeier SL, Miller LC, Henningson JN, Kappes MA, Kehrli ME, Loving CL, Guo B, Swenson SL, Yang HC, Faaberg KS. 2014. Efficacy of type 2 PRRSV vaccine against Chinese and Vietnamese HP-PRRSV challenge in pigs. Vaccine 32:6457–6462. doi:10.1016/j.vaccine.2014.09.046. - DOI - PubMed

Publication types

MeSH terms

Substances