. 2019 Jun 12;11(496):eaav1892.
doi: 10.1126/scitranslmed.aav1892.

The gut microbiota regulates white adipose tissue inflammation and obesity via a family of microRNAs

Affiliations

The gut microbiota regulates white adipose tissue inflammation and obesity via a family of microRNAs

Anthony T Virtue et al. Sci Transl Med. .

Abstract

The gut microbiota is a key environmental determinant of mammalian metabolism. Regulation of white adipose tissue (WAT) by the gut microbiota is a process critical to maintaining metabolic fitness, and gut dysbiosis can contribute to the development of obesity and insulin resistance (IR). However, how the gut microbiota regulates WAT function remains largely unknown. Here, we show that tryptophan-derived metabolites produced by the gut microbiota controlled the expression of the miR-181 family in white adipocytes in mice to regulate energy expenditure and insulin sensitivity. Moreover, dysregulation of the gut microbiota-miR-181 axis was required for the development of obesity, IR, and WAT inflammation in mice. Our results indicate that regulation of miR-181 in WAT by gut microbiota-derived metabolites is a central mechanism by which host metabolism is tuned in response to dietary and environmental changes. As we also found that MIR-181 expression in WAT and the plasma abundance of tryptophan-derived metabolites were dysregulated in a cohort of obese human children, the MIR-181 family may represent a potential therapeutic target to modulate WAT function in the context of obesity.


Conflict of interest statement

COMPETING INTERESTS

E.J.W. has consulting agreements with and is on the scientific advisory boards for Merck, Roche, Pieris, Elstar, and Surface Oncology. E.J.W. has a patent licensing agreement on the PD-1 pathway with Roche/Genentech: “Methods and Compositions for the treatment of persistent infections and cancer by inhibiting the programmed cell death (PD-1) pathway”, US patent number 14/144,304. S. E. H. has advised for Horizon Pharma.

Figures
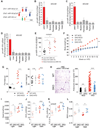
Figure 1.
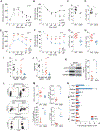
Figure 1.. The miR-181 family is a critical regulator of adipose tissue function.
(A) Genomic location of the three miR-181 clusters (miR-181a1-b1, miR-181a2-b2, and miR-181c-d) in mice. (B-D) Expression of pri-miR-181 clusters relative to Hprt in tissue from mice fed a normocaloric diet (NCD) or a high-fat diet (HFD), shown as fold change relative to NCD-fed values (n=3 per group, two independent experiments). (E) Human pri-MIR-181A2-B2 expression in lean subcutaneous (BMI<24; n=12), obese subcutaneous (BMI>30; n=7), and obese visceral WAT (BMI>30; n=7). Each dot represents a single donor. (F) Body weights of wild-type (WT) and miR-181a1-b1−/−; miR-181a2-b2−/− (DKO) mice fed a NCD or HFD from 6 to 18 weeks of age (WT NCD n=10, DKO NCD n=5, WT HFD n=10, DKO HFD n=8). (G) Body composition by magnetic resonance imaging (MRI) of WT and DKO mice fed a NCD or HFD from 6 to 18 weeks of age (one dot per mouse; WT NCD n=10, DKO NCD n=5, WT HFD n=10, DKO HFD n=8). (H) Representative hematoxylin and eosin (H&E) images of epididymal white adipose tissue (eWAT) from WT and DKO mice after 12 weeks of HFD; scale bar, 50 μm. Quantification of individual adipocytes within a 20x field (one dot per cell; WT NCD n=5, DKO NCD n=4, WT HFD n=5, DKO HFD n=3). (I-L) Evaluation of whole-body metabolism by Comprehensive Laboratory Animal Monitoring System (CLAMS) of WT (n=5) and DKO (n=4) mice fed a HFD for 6 weeks starting at 8–10 weeks of age. (I) Average calculated heat production, (J) rate of CO2 elimination, (K) rate of O2 consumption, and (L) calculated respiratory exchange ratio (RER). One dot per mouse. Error bars indicate mean ± SEM. Two-tailed Student’s t test (B, D, I, J, K, L), one-way ANOVA (E), two-way ANOVA (F), or Mann-Whitney test (C, G, H) , *p < 0.05, **p < 0.01, and ***p < 0.001.
Figure 2.
Figure 2.. The miR-181 family regulates insulin sensitivity and promotes a pro-inflammatory status in WAT during obesity.
(A) Glucose tolerance test (GTT) of wild-type (WT) and miR-181a1-b1−/−; miR-181a2-b2−/− (DKO) mice fed a NCD. (B) Insulin tolerance test (ITT) of WT and DKO mice fed a NCD. (C) GTT area under the curve (AUC) values for WT (n=10) and DKO (n=5) NCD mice. (D) ITT AUC values for WT (n=10) and DKO (n=4) NCD mice. (E) GTT of WT and DKO mice fed a HFD from age 6 to 18 weeks. (F) ITT of WT and DKO mice fed a HFD at age 6 to 18 weeks. (G) GTT AUC values for WT (n=10) and DKO (n=8) HFD mice. (H) ITT AUC values for WT (n=9) and DKO (n=7) HFD mice. One dot per mouse. (I) Serum insulin and (J) homeostatic model assessment-insulin resistance (HOMA-IR) index values for WT and DKO mice fed a NCD or HFD for 12 weeks. (One dot per mouse; WT NCD n=8, DKO NCD n=7, WT HFD n=9 and DKO HFD n=7). (K) Representative western blot for p-AKT, AKT, and GAPDH protein in eWAT of WT (n=5) and DKO (n=3) mice fed a HFD from 6 to 18 weeks of age. Mice were fasted for 4 hours prior to i.p. insulin injection and after 15 minutes, eWAT was snap frozen. p-AKT expression is shown normalized by total AKT and GAPDH. One dot per mouse per lane. a.u. = arbitrary unit. (L) Representative flow cytometry plots of group 2 innate lymphoid cells (ILC2), eosinophils, and T-regulatory cells (Tregs) isolated from eWAT of WT and DKO mice fed a HFD from 6 to 18 weeks of age. (M) Quantification of (L) total lymphocytes per gram of adipose tissue (AT) and percentage of indicated cell types within the CD45+ immune cell population. (One dot per mouse; WT HFD n=5–10, DKO HFD n=3–6). (N) Expression of M1 and M2 genes in eWAT of HFD-fed mice (WT n=5, DKO n=4) normalized to Hprt and shown as fold change relative to WT. Error bars show mean ± SEM. Two-tailed Student’s t-test (D, G, H, K, N), two-way ANOVA (A, B, E, F), or Mann-Whitney test (C, I, J, M), *p < 0.05, **p < 0.01, ***p < 0.001.
Figure 3.
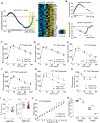
Figure 3.. Adipocyte-specific expression of the miR-181 family impacts glucose homeostasis and body weight.
(A-B) RNA sequencing analysis of eWAT from HFD-fed WT and DKO mice. (A) Gene set enrichment analysis (GSEA) of predicted miR-181 targets (normalized enrichment score [NES] −1.11, [ES] −0.24; FDR q 0.32), with heatmap of the top predicted targets that were significantly differentially expressed (FDR <0.05) in WT (n=4) or DKO (n=4) HFD mice. Orange indicates genes implicated in adipose tissue development and function. Pink indicates genes implicated in regulation of or response to insulin signaling. (B) GSEA of inflammatory ([NES] 1.54, [ES] −0.57; FDR q 0.26) and oxidative phosphorylation ([NES] −1.09, [ES] −0.33; FDR q 0.71) gene sets. (C-G) GTT of triple conditional knockout (TcKO) mice fed a HFD from 6 to 18 weeks of age and expressing Cre-recombinase under the control of the following promoters: (C) Cluster of differentiation 4 (CD4) promoter (T cells; Cre- n=8, Cre+ n=19, 5 independent experiments), (D) Forkhead box P3 (FoxP3) promoter (Tregs; Cre- n=5, Cre+ n=12, 4 independent experiments), (E) Lysozyme 2 (LyzM) promoter (macrophages; Cre- n=8, Cre+ n=8, 2 independent experiments), (F) Albumin promoter (hepatocytes; Cre- n=8, Cre+ n=8), or (G) Fatty acid binding protein 4 (Fabp4;) promoter (adipocytes; Cre- n=11, Cre+ n=10, 2 independent experiments). (H) ITT of Fabp4 TcKO mice fed a HFD from 6 to 18 weeks of age; Fabp4: Cre- n=24 Cre+ n=29, 3 independent experiments. (I) AUC of data from (G) and (H). (J) Body weights of Fabp4 TcKO mice fed a HFD from 6 to 18 weeks of age (Fabp4 Cre- n=11, Fabp4 Cre+ n=17, 4 independent experiments). (K) Quantification of adipocyte-specific insulin sensitivity via suppression of free fatty acid (FFA) production during fasting-refeeding. NCD-fed WT (n=5) and DKO mice (n=4–5) were fasted for 18h, then given NCD ad libitum for 4h. Serum FFAs were measured after fasting and refeeding periods. One dot per mouse. Error bars indicate mean ± SEM. Two-tailed Student’s t-test (I, K), or two-way ANOVA (C-H, J), *p < 0.05, ****p < 0.0001.
Figure 4.
Figure 4.. Microbiota-derived metabolites regulate the miR-181 family in white adipocytes to control progression to obesity.
(A, B) Expression of mature (A) miR-181a or (B) miR-181b from adipocyte and stromal-vascular fractions of eWAT from specific pathogen-free (SPF) mice fed a NCD and germ-free (GF) mice fed a NCD or HFD. Expression was normalized to U6 and is shown as fold change relative to NCD GF (NCD SPF n=8, NCD GF n=6, HFD GF n=6, two independent experiments). (C) Expression of mature miR-181a or miR-181b from the adipocyte fraction of eWAT of GF mice (n=6) and cohoused GF (n=6) and SPF (n=6) mice for 8 weeks. Expression was normalized to U6 and is shown as fold change relative to GF. (D) Volcano plot of metabolite abundance in the cecal contents of NCD- or HFD-fed mice. Plotted as relative abundance in HFD compared to NCD mice. Metabolites related to tryptophan metabolism are plotted in red. (E) Heat map of the 10 metabolites from (D) most significantly altered in HFD-fed mice compared to NCD-fed mice. (F) Schematic of the conversion of tryptophan to indole, indole-3-carboxylic acid, and indoxyl sulfate showing the role of tryptophanase. (G) Concentrations of indoxyl sulfate determined by mass spectrometry in plasma from 7–9-week-old SPF and GF mice fed a NCD or HFD for 5 weeks. (H) Abundance of plasma indole determined by mass spectrometry from children stratified by obesity status. Using BMI percentiles for age and gender, individuals were binned into healthy weight (<85th percentile, n=19), class I obesity (100–120% of 95th percentile, n=10), class II obesity (120–140% of 95th percentile, n=6) and class III obesity (>140% of 95th percentile, n=3). (I) Lipid accumulation in cultured adipocytes following 6-day treatment with tryptophan-derived metabolites (200μM). Plotted as percentage change in Oil Red O staining in metabolite-treated relative to DMSO-treated cells. 4 independent experiments, 3–6 biological replicates per group. Trp = tryptophan, N-A-Trp = N-acetyl-tryptophan, ILA = indole lactic acid, IAA = indole acetic acid, 5-HT = 5-hydroxytryptamine (serotonin), KYN = kynurenine, KYNA = kynurenic acid, XA = xanthurenate, I3CA = indole-3-carboxylic acid, IS = indoxyl sulfate. (J) Representative image of cultured adipocytes treated with DMSO or indole (200μM) and stained with Oil Red O. Scale bar, 2.5 mM. (K) Expression of mature miR-181a and miR-181b in differentiated 3T3-L1 cells following 2-day treatment with indole (100μM). (L) Body weight and (M) GTT of HFD-fed mice i.p. injected with indole (50mg/kg; n=4–5) or solvent control (n=7). Weights measured 3 times/week and pooled. (N, O) Expression of mature (N) miR-181a or (O) miR-181b from adipocyte fractions of eWAT from mice in (L, M), normalized to U6 and shown as fold change relative to solvent-injected mice (one dot per mouse). (P) GTT of miR-181 TcKO Fabp4 HFD-fed mice i.p. injected with indole (50mg/kg; n=3) or solvent control (n=3) 3 times per week for 7 weeks. (Q, R) Expression of mature miR-181a (Q) or miR-181b (R) from adipocyte fractions of eWAT of SPF mice maintained fed a tryptophan-sufficient (Trp-suff., n=10) or tryptophan-deficient (Trp-def., n=10) diet. Expression was normalized to U6 and is shown as fold change relative to Trp-suff. diet; two independent experiments. (S) Body weight and (T) GTT of mice colonized with a WT parental Escherichia coli (E. coli) strain or tryptophanase E. coli knockout (tnaA KO) (n=4/group). Error bars show mean ± SEM. Two-tailed Student’s t-test (G, I, N, O, R), one-way ANOVA (A, B, C, H), two-way ANOVA (L, M, P, S, T), or Mann-Whitney test (K, Q) *p < 0.05, **p < 0.01, ***p < 0.001 ****p < 0.0001.

References

    1. Gesta S, Tseng YH, Kahn CR, Developmental origin of fat: tracking obesity to its source. Cell 131, 242–256 (2007). - PubMed
    1. Hajer GR, van Haeften TW, Visseren FL, Adipose tissue dysfunction in obesity, diabetes, and vascular diseases. European heart journal 29, 2959–2971 (2008). - PubMed
    1. Suarez-Zamorano N. et al., Microbiota depletion promotes browning of white adipose tissue and reduces obesity. Nat Med 21, 1497–1501 (2015). - PMC - PubMed
    1. Backhed F. et al., The gut microbiota as an environmental factor that regulates fat storage. Proc Natl Acad Sci U S A 101, 15718–15723 (2004). - PMC - PubMed
    1. Backhed F, Manchester JK, Semenkovich CF, Gordon JI, Mechanisms underlying the resistance to diet-induced obesity in germ-free mice. Proc Natl Acad Sci U S A 104, 979–984 (2007). - PMC - PubMed

Publication types