. 2019 Jun 12;10(1):2569.
doi: 10.1038/s41467-019-10489-2.

A pan-cancer analysis of synonymous mutations

Affiliations

A pan-cancer analysis of synonymous mutations

Yogita Sharma et al. Nat Commun. .

Abstract

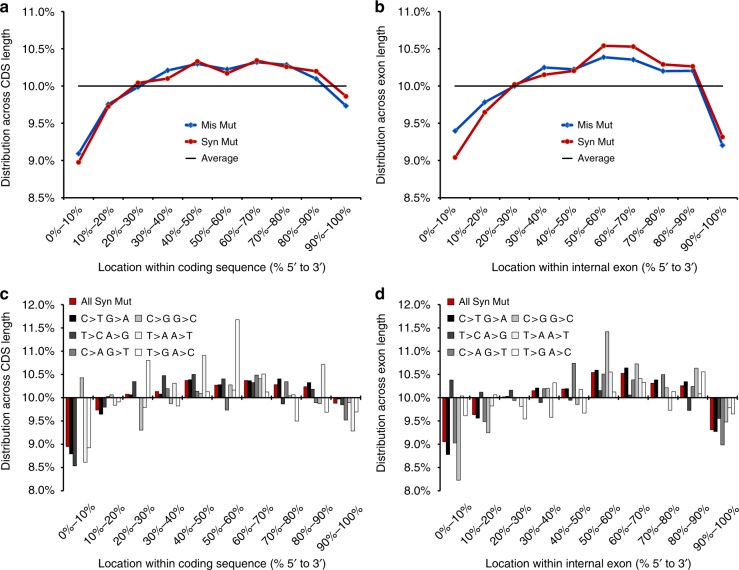
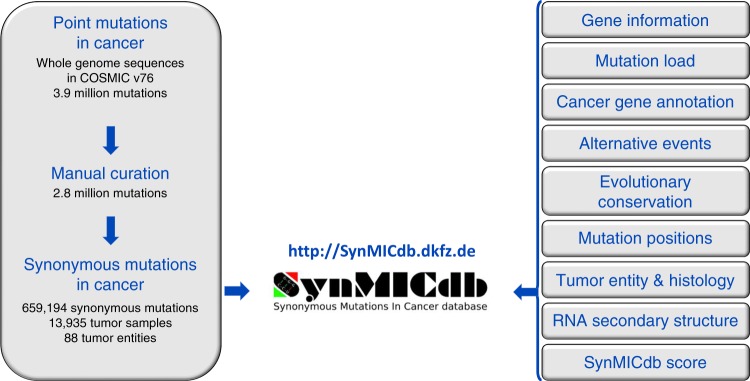
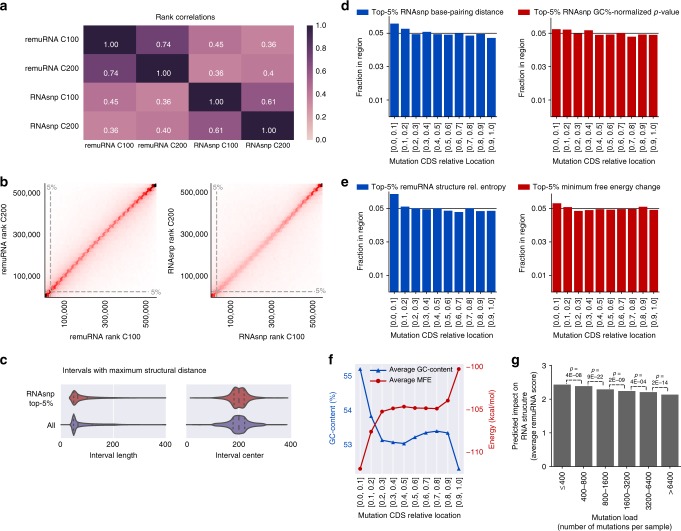
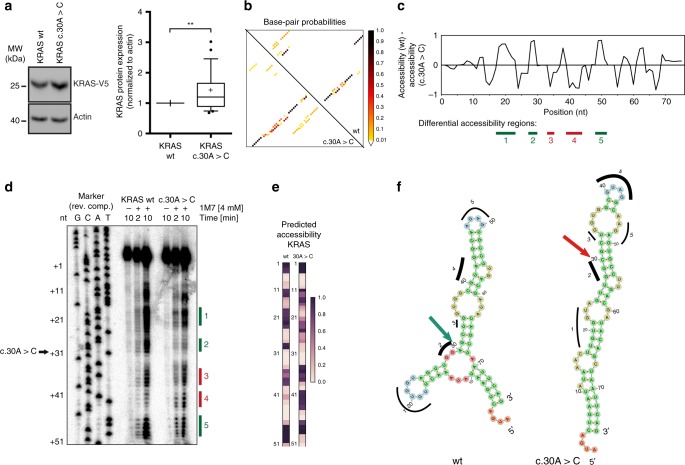
Synonymous mutations have been viewed as silent mutations, since they only affect the DNA and mRNA, but not the amino acid sequence of the resulting protein. Nonetheless, recent studies suggest their significant impact on splicing, RNA stability, RNA folding, translation or co-translational protein folding. Hence, we compile 659194 synonymous mutations found in human cancer and characterize their properties. We provide the user-friendly, comprehensive resource for synonymous mutations in cancer, SynMICdb ( http://SynMICdb.dkfz.de ), which also contains orthogonal information about gene annotation, recurrence, mutation loads, cancer association, conservation, alternative events, impact on mRNA structure and a SynMICdb score. Notably, synonymous and missense mutations are depleted at the 5'-end of the coding sequence as well as at the ends of internal exons independent of mutational signatures. For patient-derived synonymous mutations in the oncogene KRAS, we indicate that single point mutations can have a relevant impact on expression as well as on mRNA secondary structure.


Conflict of interest statement

S.D. is co-owner of the siTOOLs Biotech GmbH, Martinsried, Germany, without any relation to this study or competing financial interests. The remaining authors declare no competing interests.

Figures

Fig. 1
Fig. 1
Properties of synonymous mutations in cancer. a Synonymous mutations are the second most frequent class of point mutations in cancer. b Synonymous mutations (Syn Mut) and missense mutations (Mis Mut) are enriched in cancer-associated genes compared with the proportion of annotated cancer genes among all human coding genes (All Genes). c Synonymous mutations (Syn Mut) display a similar recurrence pattern as missense mutations (Mis Mut) with more than 25% of mutations found recurrently in more than one sample. d The violin plot depicts the distribution of the mutation loads of the samples associated with different frequencies of the synonymous mutations with the median indicated by a dot. e The fraction of synonymous mutations in known cancer-associated genes increases for highly recurrent synonymous mutations. f The frequency of synonymous mutations (Syn Mut) and missense mutations (Mis Mut) are normalized to a mutation signature to account for the mutation bias in cancer cells
Fig. 2
Fig. 2
Depletion of mutations towards the ends of coding regions and exons. a The distribution of the positions within the coding region of all mutations in all affected genes independent of their length is depicted in 5'-to-3' direction. The black line at 10% frequency would indicate equal distribution along the 10 bins of the coding sequence length. Synonymous mutations (Syn Mut), as well as missense mutations (Mis Mut) are depleted towards the 5'-end of the coding region. b The distribution of mutations within internal exons of multiexonic transcripts is depicted in 5'-to-3' direction. The black line at 10% frequency would indicate equal distribution along the 10 bins along the internal exon length. Synonymous mutations (Syn Mut), as well as missense mutations (Mis Mut) are depleted towards both ends of the exon. c The distribution of synonymous mutations along the coding sequence is depicted separately for six groups of possible nucleotide changes in point mutations. A 10% frequency would indicate equal distribution along the 10 bins of the coding sequence length. d The distribution of synonymous mutations along the length of internal exons is depicted separately for six groups of possible nucleotide changes. A 10% frequency would indicate equal distribution along the 10 bins of the internal exon length
Fig. 3
Fig. 3
The SynMICdb Score. a Nine parameters are integrated into the SynMICdb score for the estimated impact of a synonymous mutation. b Synonymous mutations in known cancer genes rank higher in the SynMICdb score than mutations in other genes. Depicted is the fraction of synonymous mutations in cancer genes (red) vs. no cancer genes (blue) in 10% bins of the SynMICdb score ranking (the cancer gene parameter was excluded from the score). A 10% frequency would indicate equal distribution along the 10 bins of the SynMICdb score ranks. Comparing the score rank averages between the group of non-cancer genes and cancer genes revealed a highly significant difference (t-test, p < 0.001). c The average SynMICdb score is depicted along the length of the coding sequence in 10% bins. Significance: *p < 0.05, **p < 0.01, **p < 0.001 (t-test). d The average SynMICdb score is depicted along the length of the internal exons in 10% bins. Significance: *p < 0.05, **p < 0.001 (t-test). bd Bars represent the difference from the average (x-axis) and the whiskers indicate the standard error (SEM). e The SynMICdb score, as well as multiple of its individual parameters are compared for 78,278 synonymous mutations falling into annotated cassette exons vs. all other synonymous mutations with the significance (log10 p-value t-test, left) and relative difference (% difference of average between both groups, right) depicted
Fig. 4
Fig. 4
SynMICdb. The Synonymous Mutations in Cancer database provides easy access to 659194 somatic synonymous mutations found in human cancer combined with information about their gene annotation, recurrence, signature-normalized frequency, mutation load, affected tumor entities, evolutionary conservation, structural impact, association with alternative events and the SynMICdb score found at http://SynMICdb.dkfz.de
Fig. 5
Fig. 5
RNA secondary structure analysis of synonymous mutations. a Spearman’s rank correlation between the selected scoring metrics remuRNA score (relative entropy of ensembles of structure formations) and RNAsnp (base-pairing distance p-value) for two different context lengths C100 (−/+100 nt) and C200 (−/+200 nt). b Correlation of the mutation rankings of secondary structure aberrations for the two context lengths C100 or C200 for remuRNA (left) and RNAsnp (right). c For each input sequence and mutation, RNAsnp reported the subsequence interval accommodating the largest structural change in terms of maximum base-pair probability distance. For the context length of −/+200 nt around each SNP, the distributions of the interval lengths (left) and the middle positions of the intervals (right) are depicted. d Fraction of synonymous mutations with the strongest secondary structure aberrations (top 5th percentile of all synonymous mutations calculated by RNAsnp) within each coding sequence region based on base-pairing distance (left) or p-value of base-pairing distance normalized for GC-content (right) are depicted for all synonymous mutations relative to their position in the coding region (10% bins). If mutations would be uniformly distributed along the transcript, the fraction in each region would be 0.05. e Fraction of synonymous mutations with the strongest secondary structure aberrations (top 5th percentile of all synonymous mutations calculated by remuRNA) within each coding sequence region based on relative entropy (left) or minimum free energy change (right) are depicted for all synonymous mutations relative to their position in the coding region (10% bins). Again, the expected fraction of a random distribution would be 0.05 for each region. f Average GC-content and minimum free energy (MFE) of the RNA secondary structure associated with the context window of 200 nt upstream and downstream of the synonymous mutation are depicted for all synonymous mutations relative to their position in the coding region (10% bins). g The predicted impact on the RNA secondary structure (average of remuRNA score) is depicted for different bins of mutation loads with a higher remuRNA score for synonymous mutations found in samples with lower number of mutations in total (significance: t-test)
Fig. 6
Fig. 6
KRAS c.30 A > C affects the transcript secondary structure. a Left: HEK293 cells were transfected with the indicated KRAS-V5 constructs. Expression of the constructs was evaluated by western blotting using anti-V5 and anti-Actin antibodies. Left: a representative experiment is shown. Right: quantification of the western blot from biological replicates (n = 25). V5 signals were normalized to Actin signals presented as boxplot. **p < 0.01 (t-test). b Base-pairing probabilities of the wildtype and mutant sequences are shown. The mutation introduces a stable rod-like duplex (bottom-left), while the stable structure in the wildtype forms branching stems (top-right). c The change in nucleotide accessibility is depicted by the difference between the predicted accessibility along the KRAS wildtype vs. mutant transcripts. d In vitro SHAPE probing of KRAS wildtype (WT) and c.30 A > C mutant KRAS using 1M7 shows differential nucleotide accessibility profiles. Lanes 5–7 and lanes 8–10 indicate the SHAPE profile of wildtype KRAS and mutant KRAS (c.30 A > C), respectively. RNA shown in lanes 5 and 8 are treated with DMSO for 10 min and lanes 6/9 and lanes 7/10 correspond to RNA treated with SHAPE reagent 1M7 (4 mM final concentration) for 2 min and 10 min, respectively. Numbered rectangular boxes correspond to regions of predicted local structural accessibility changes as shown in Fig. 6c. Lanes 1–4 represent the sequencing ladder prepared from KRAS DNA as template in complementary sequence. e Heatmaps of nucleotide-wise accessibility predicted in silico for comparison with SHAPE. f Representation of the secondary structures with minimum free energy by RNAfold for KRAS wildtype and mutant RNAs used for SHAPE
Fig. 7
Fig. 7
Synonymous mutations in KRAS codon 12 impact its expression. a Left: Schematic representation of the cancer-derived KRAS mutations analyzed in this study. Right: KRAS synonymous mutation counts in COSMIC database v82 and in SynMICdb. b HEK293 cells were transfected with the indicated KRAS-V5 mutants. Top: Expression of the constructs was evaluated by Western blotting using V5 and ACTB antibodies. A representative experiment is shown. Bottom: Quantification of the Western blot signals obtained as in top panel. V5 signals were normalized to ACTB signals. c Measurement of KRAS-V5 mRNA levels in the samples described in b after RNA isolation and RT-qPCR. V5 signals were normalized to ACTB signals. d KRAS-V5 codon 12 mutants relative expression was obtained after normalization of the protein signals for each mutant on their respective mRNA levels. bd Mean of four independent experiments is presented. Error bars: SEM. *p ≤ 0.05 (t-test)

References

    1. Ferlay J, et al. Cancer incidence and mortality worldwide: sources, methods and major patterns in GLOBOCAN 2012. Int J. Cancer. 2015;136:E359–E386. doi: 10.1002/ijc.29210. - DOI - PubMed
    1. Cancer Genome Atlas Research, N.. Comprehensive genomic characterization of squamous cell lung cancers. Nature. 2012;489:519–525. doi: 10.1038/nature11404. - DOI - PMC - PubMed
    1. International Cancer Genome, C.. et al. International network of cancer genome projects. Nature. 2010;464:993–998. doi: 10.1038/nature08987. - DOI - PMC - PubMed
    1. Northcott PA, et al. The whole-genome landscape of medulloblastoma subtypes. Nature. 2017;547:311–317. doi: 10.1038/nature22973. - DOI - PMC - PubMed
    1. Bamford S, et al. The COSMIC (Catalogue of Somatic Mutations in Cancer) database and website. Br. J. Cancer. 2004;91:355–358. doi: 10.1038/sj.bjc.6601894. - DOI - PMC - PubMed

Publication types

MeSH terms