. 2019 Jun 12;10(1):2573.
doi: 10.1038/s41467-019-10581-7.

Electric field dynamics in the brain during multi-electrode transcranial electric stimulation

Affiliations

Electric field dynamics in the brain during multi-electrode transcranial electric stimulation

Ivan Alekseichuk et al. Nat Commun. .

Abstract

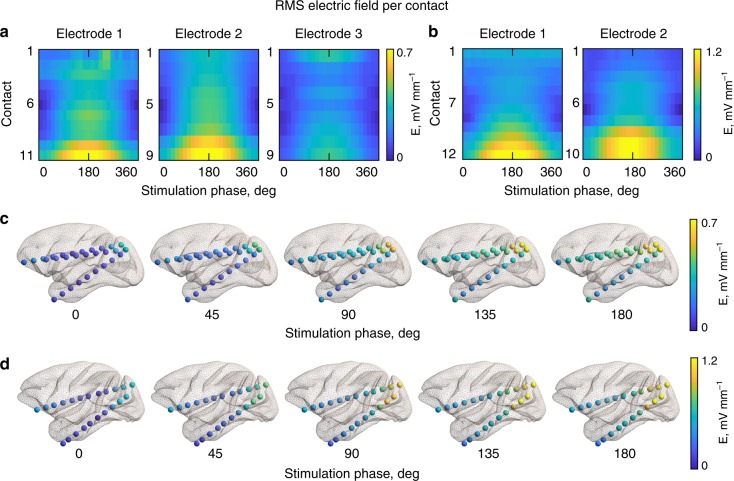
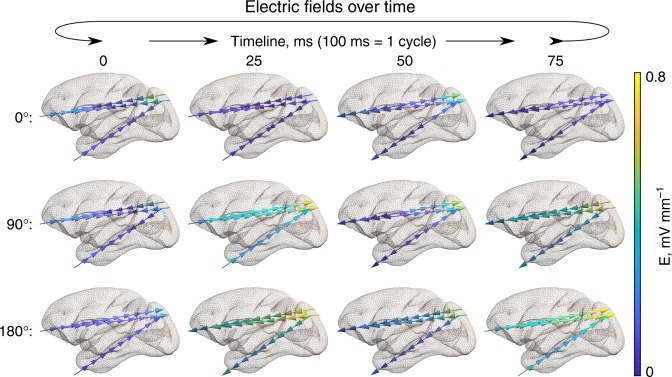
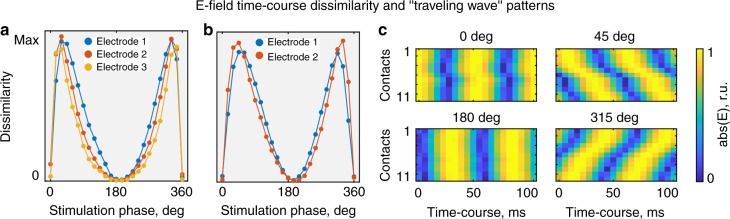
Neural oscillations play a crucial role in communication between remote brain areas. Transcranial electric stimulation with alternating currents (TACS) can manipulate these brain oscillations in a non-invasive manner. Recently, TACS using multiple electrodes with phase shifted stimulation currents were developed to alter long-range connectivity. Typically, an increase in coordination between two areas is assumed when they experience an in-phase stimulation and a disorganization through an anti-phase stimulation. However, the underlying biophysics of multi-electrode TACS has not been studied in detail. Here, we leverage direct invasive recordings from two non-human primates during multi-electrode TACS to characterize electric field magnitude and phase as a function of the phase of stimulation currents. Further, we report a novel "traveling wave" stimulation where the location of the electric field maximum changes over the stimulation cycle. Our results provide a mechanistic understanding of the biophysics of multi-electrode TACS and enable future developments of novel stimulation protocols.


Conflict of interest statement

A.O. is an inventor on patents and patent applications describing methods and devices for noninvasive brain stimulation. The remaining authors declare no competing interests.

Figures

Fig. 1
Fig. 1
Experimental design. Two nonhuman primates with recording electrodes implanted along the anterior-posterior plane receive transcranial electric stimulation (TES). For subject 1 we analyze three recording electrodes with 29 contacts altogether, and for subject 2—two recording electrodes with 22 contacts. Two TES stimulation electrodes are placed on the scalp at anterior (blue) and posterior (red) locations, with the return electrode (black) over the temporal area. Alternating current stimulation was applied at 10 Hz and fixed intensity at the stimulation electrodes, while the phase of the stimulation currents between them varied from 0° to 360° in 15° steps (25 phase conditions in total). See Supplementary Movie 1 for a 3D animation
Fig. 2
Fig. 2
Voltage distribution during TES for different stimulation conditions. a Heatmaps of the maximum voltage for each recording electrode for subject 1 (left) and subject 2 (right, b). The x-axis indicates the applied phase difference between the anterior and posterior stimulation electrodes from 0° to 360° in 15° steps, and the y-axis corresponds to the recording contacts (from the first—most anterior contact, to the last—most posterior contact). c Voltage gradients for select stimulation conditions for subject 1 and subject 2 (d) visualized at their recorded anatomical locations
Fig. 3
Fig. 3
TES electric field distribution for different stimulation conditions. a Heatmaps of the root mean square magnitude (RMS) of the electric field for each recording electrode for subject 1 (left) and subject 2 (right, b). The x-axis indicates the applied phase difference between the anterior and posterior stimulation electrodes from 0° to 360° in 15° steps, and the y-axis corresponds to the recording contacts (from the first—most anterior contact, to the last—most posterior contact). c Electric field distributions in the brain for select stimulation conditions for subject 1 and subject 2 (d). See also Supplementary Fig. 4 for further details
Fig. 4
Fig. 4
Voltage and electric field phases in the brain during TES for a given stimulation condition. a The difference between the voltage phases recorded from the most anterior and most posterior contact (ΔφV) per each electrode. The left figure corresponds to subject 1, and the right figure to subject 2. b Same as panel a, but for the electric field phase differences (ΔφE). c 3D visualizations of the voltage phases (φV) in the brain for the primary stimulation conditions at all recording contacts for subject 1 and subject 2 (d). e, f Same as panels c and d, but for the electric field phase (φE). See also Supplementary Figs. 5–7 for further details
Fig. 5
Fig. 5
Electric fields in the brain over time during TES for a given stimulation condition. The panel depicts the main conditions (0°, 90°, and 180° stimulation phase differences) for subject 1. Arrows indicate the electric field direction, and the color encodes the electric field magnitude. See Supplementary Fig. 9 for subject 2 and Supplementary Movies 2 and 3 for more details
Fig. 6
Fig. 6
Traveling wave stimulation. Electric field time-courses across different recording contacts ( = anatomical locations) are identical for 0°/360° and 180° stimulation conditions but demonstrate traveling wave properties for intermediate stimulation conditions, e.g., 45°. a, b Dissimilarity (mean square difference) between the electric field time-courses at different contacts. The left figure corresponds to subject 1, and the right figure to subject 2. c Absolute normalized (per location) electric field time-courses for subject 1 and electrode 1 in the relative units (r.u.). The first contact in the electrode corresponds to the most anterior location, and the last contact—to the most posterior location. While for 0° and 180° the maxima across contacts occur at the same time point, they occur at different time points for the 45° condition ( = traveling wave). Other electrodes demonstrate a similar pattern. See Supplementary Fig. 9 for corresponding nonnormalized data and Supplementary Movie 4 for a 3D animation
Fig. 7
Fig. 7
Computer model of the electric field on the gray matter surface during conventional stimulation with 0° and 180° phase difference and during “traveling wave” stimulation (45° phase difference). Panel a depicts the changes throughout the time (one half cycle of stimulation), and panel b highlights two time-points at the begging and end of half-cycle. See Supplementary Movies 5–7 and Supplementary Fig. 11 for more details

Similar articles

Cited by

References

    1. Buzsáki G, Anastassiou CA, Koch C. The origin of extracellular fields and currents—EEG, ECoG, LFP and spikes. Nat. Rev. Neurosci. 2012;13:407–420. doi: 10.1038/nrn3241. - DOI - PMC - PubMed
    1. Siegel M, Donner TH, Engel AK. Spectral fingerprints of large-scale neuronal interactions. Nat. Rev. Neurosci. 2012;13:121–134. doi: 10.1038/nrn3137. - DOI - PubMed
    1. Canolty RT, Knight RT. The functional role of cross-frequency coupling. Trends Cogn. Sci. 2010;14:506–515. doi: 10.1016/j.tics.2010.09.001. - DOI - PMC - PubMed
    1. Schroeder CE, Lakatos P. Low-frequency neuronal oscillations as instruments of sensory selection. Trends Neurosci. 2009;32:9–18. doi: 10.1016/j.tins.2008.09.012. - DOI - PMC - PubMed
    1. Buzsáki G, Logothetis N, Singer W. Scaling brain size, keeping timing: evolutionary preservation of brain rhythms. Neuron. 2013;80:751–764. doi: 10.1016/j.neuron.2013.10.002. - DOI - PMC - PubMed

Publication types