. 2019 Jun 12;9(1):8524.
doi: 10.1038/s41598-019-44317-w.

"Dual Disease" TgAD/GSS mice exhibit enhanced Alzheimer's disease pathology and reveal PrPC-dependent secretion of Aβ

Affiliations

"Dual Disease" TgAD/GSS mice exhibit enhanced Alzheimer's disease pathology and reveal PrPC-dependent secretion of Aβ

Kefeng Qin et al. Sci Rep. .

Abstract

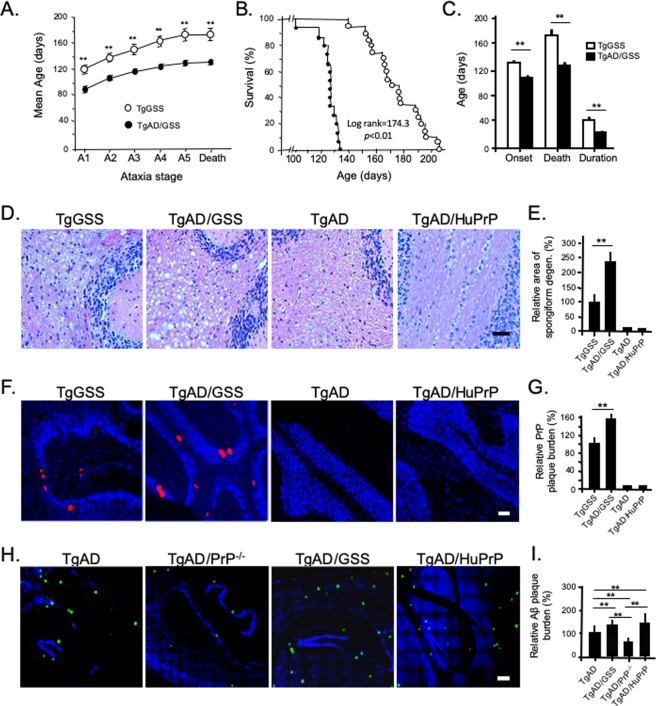
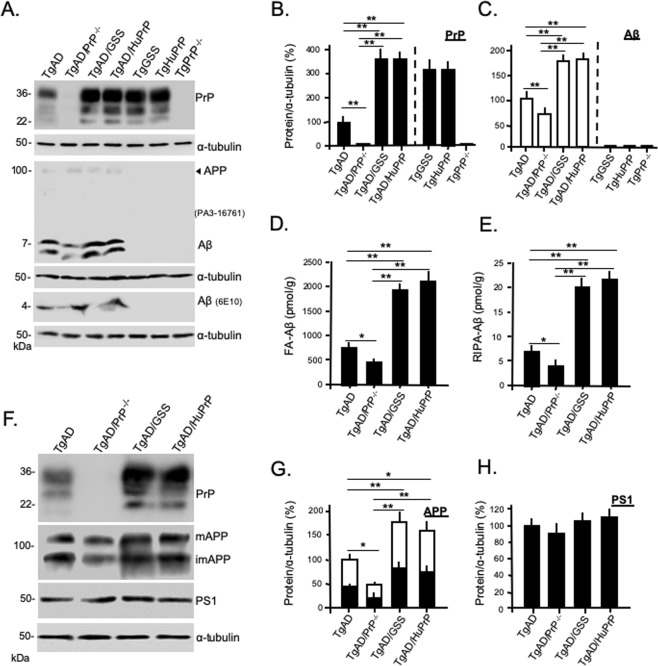
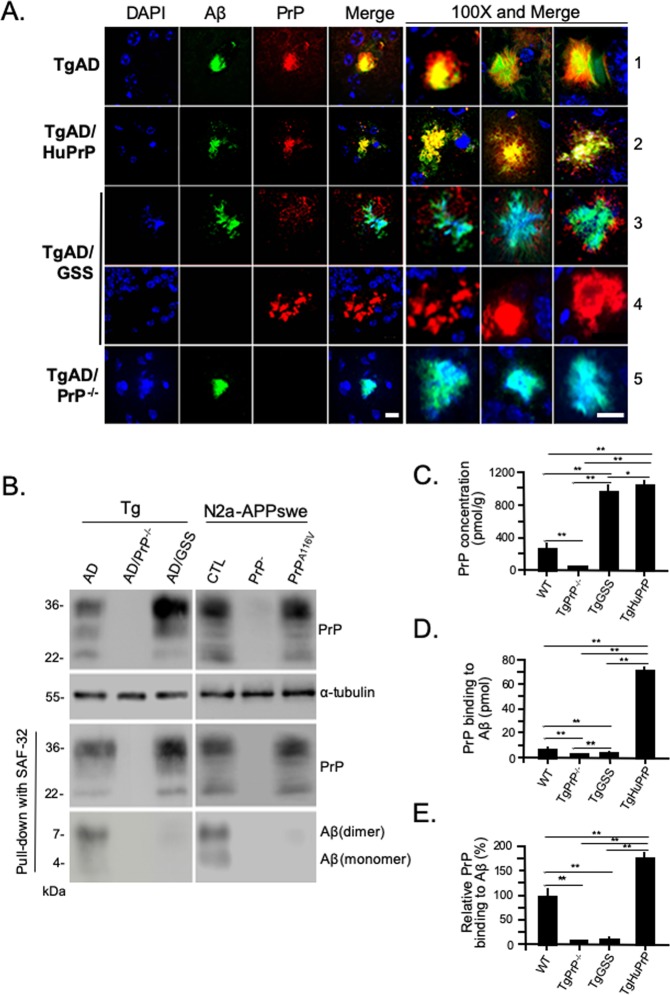
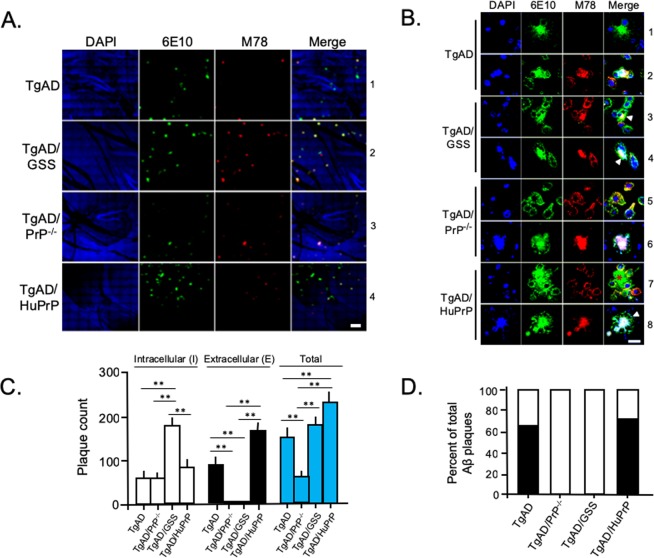
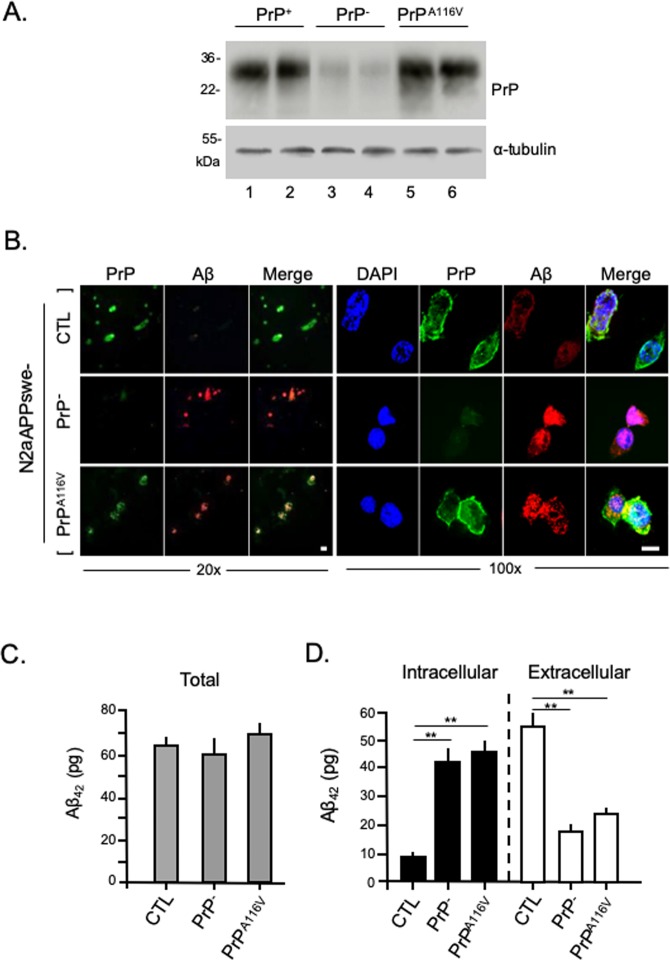
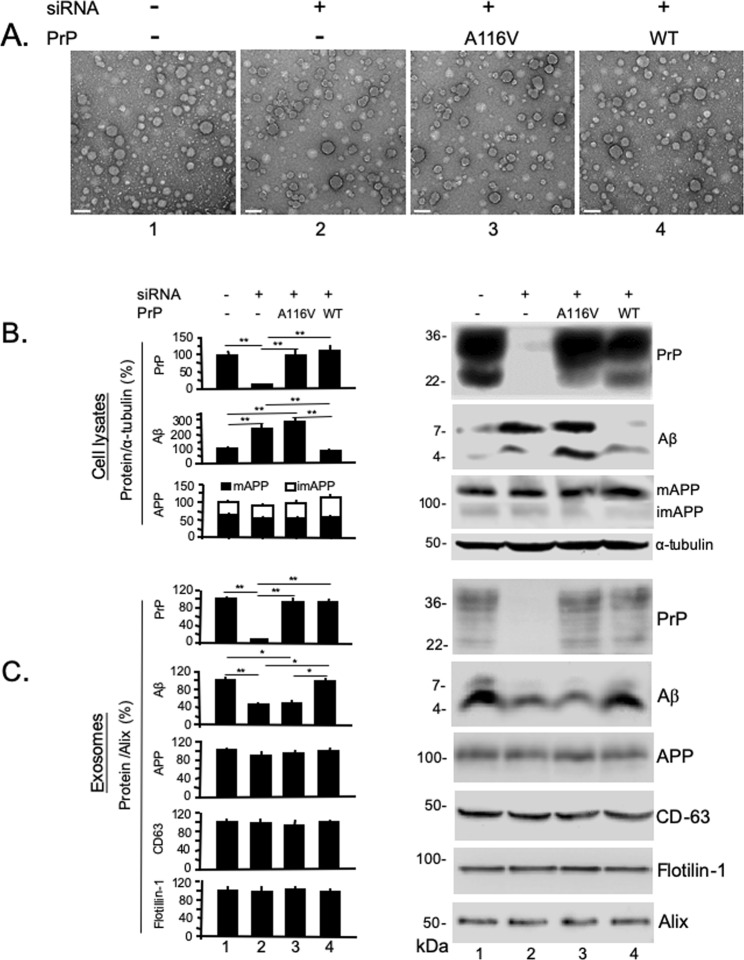
To address the question of cross-talk between prion protein (PrP) and Alzheimer's disease (AD), we generated TgAD/GSS mice that develop amyloid-β (Aβ) plaques of AD and PrP (specifically mutated PrPA116V) plaques of Gerstmann-Sträussler-Scheinker disease (GSS) and compared plaque-related features in these mice to AD mice that express normal (TgAD), high (TgAD/HuPrP), or no (TgAD/PrP-/-) PrPC. In contrast to PrPC, PrPA116V weakly co-localized to Aβ plaques, did not co-immunoprecipitate with Aβ, and poorly bound to Aβ in an ELISA-based binding assay. Despite the reduced association of PrPA116V with Aβ, TgAD/GSS and TgAD/HuPrP mice that express comparable levels of PrPA116V and PrPC respectively, displayed similar increases in Aβ plaque burden and steady state levels of Aβ and its precursor APP compared with TgAD mice. Our Tg mouse lines also revealed a predominance of intracellular Aβ plaques in mice lacking PrPC (TgAD/PrP-/-, TgAD/GSS) compared with an extracellular predominance in PrPC-expressing mice (TgAD, TgAD/HuPrP). Parallel studies in N2aAPPswe cells revealed a direct dependence on PrPC but not PrPA116V for exosome-related secretion of Aβ. Overall, our findings are two-fold; they suggest that PrP expression augments Aβ plaque production, at least in part by an indirect mechanism, perhaps by increasing steady state levels of APP, while they also provide support for a fundamental role of PrPC to bind to and deliver intraneuronal Aβ to exosomes for secretion.


Conflict of interest statement

The authors declare no competing interests.

Figures

Figure 1
Figure 1
Reduced survival and enhanced AD and PrD pathology in TgAD/GSS mice. (A) Mean age at which TgGSS (open circles, n = 20) and TgAD/GSS (closed circles, n = 15) mice reach each clinical stage of ataxia (see Methods). **p < 0.01, Student’s t-test applied to each stage. See Supplemental Table 1A for actual values. (B) Kaplan-Meier survival curve of TgGSS (open circles) and TgAD/GSS (closed circles) mice. X2 (log rank) = 174.3, p < 0.01. (C) Bar graph comparing age at onset ± S.D in TgGSS (open bars, n = 20) vs TgAD/GSS (closed bars, n = 15) mice (132.1 ± 12.7 vs 106.1 ± 6.0 d), age at death ± S.D. (174.6 ± 18.4 vs 126.0 ± 8.2 d), and disease duration ± S.D. (42.5 ± 10.6 to 21.8 ± 5.8 days) (**p < 0.01), Student’s t-test applied to each group. (D) Representative H&E stained sections of cerebellum from age-matched (~126 ± 8 day-old, i.e. ~4.2 month-old) mice of each Tg line showing differences in spongiform degeneration within the cerebellum. Magnification 20x. Scale bar = 50 µm. (E) Bar graph comparing the relative area of spongiform degeneration from each line displayed in D, normalized to the TgGSS group. Brain sections were prepared as a parasagittal slice that included cortex, hippocampus, and cerebellar structures. The relative area of spongiform degeneration was calculated as a fraction of the total area of brain section using NIH ImageJ (see Methods). **p < 0.01, ANOVA and post hoc multiple comparisons test. Actual values: TgGSS = 100 ± 25.7%, TgAD/GSS = 241.4 ± 45.6%, TgAD = 0, TgAD/HuPrP = 0 (n = 6 mice per group, 3 brain sections per mouse). (F) Representative full thickness confocal immunofluorescence images of fixed cerebellar sections from ~4.2 month-old Tg mice from each line labeled with anti-PrP SAF-32 mAb to visualize PrP plaques. Nuclei were stained with DAPI (blue). Sections were 5 μm thick. Original magnification 20x. Scale bar = 100 µm. (G) Bar graph comparing the relative plaque burden (%) within each mouse line normalized to TgGSS mice. Area of PrP plaque immunofluorescence was calculated as the fraction of total brain section area, using an NIH ImageJ plugin (see Methods). **p < 0.01, ANOVA and post hoc multiple comparisons test. Actual values: TgGSS = 100 ± 24.5%, TgAD/GSS = 154.1 ± 15.3%, TgAD = 0, TgAD/HuPrP = 0 (n = 6 mice per group, 3 sections per mouse brain). (H) Representative confocal immunofluorescence images of mouse brain show Aβ plaques within the cortical/hippocampal region of ~4.2 month-old mouse lines with AD transgenes and differing PrP transgenes. Aβ was detected using rabbit anti-Aβ42 antibody (PA3-16761). Original magnification 20x. Scale bar = 100 µm. (I) Bar graph comparing Aβ plaque burden in each Tg mouse line. The area of anti-Aβ antibody staining relative to the total area of brain section was determined using NIH ImageJ and plotted as a percentage normalized to TgAD mice. **p < 0.01, ANOVA and post hoc multiple comparisons test, (n = 6 mice per group, 3 sections per mouse brain). See Supplemental Table 1B for actual values.
Figure 2
Figure 2
Steady state levels of AD and PrD related proteins in Tg lines. (A) Western blots comparing PrP and Aβ steady state levels in each mouse line at ~4.2 months. Freshly harvested brain from mice was homogenized and 30 μg of total protein from each was separated on 12.5% SDS-PAGE to assess PrP and α-tubulin as a loading control. To detect Aβ42, 80 μg of total protein was separated on a discontinuous (6%/16.5%) tricine-tris gel. Antibodies used were mAb SAF-32 (PrP) and PA3-16761 or 6E10 (Aβ). Predicted APP position is labeled by arrowhead to demonstrate the selectivity of PA3-16761 for Aβ over APP. Each blot represents 1 of 3 replicates prepared from 3 mice per Tg mouse line. The same samples were run for each of the 3 gels displayed and each gel was re-probed with α-tubulin antibody as a loading control. The densitometric signals of PrP (B) and Aβ (PA3-16761) (C) were measured using Quantity One software (Bio-Rad) and normalized to signals of α-tubulin. The values were plotted as a relative percentage using age-matched TgAD mice as the reference (i.e. 100%). Bars are means ± S.D. of 3 independent experiments, as in A. See Supplemental Table 2A for actual values. (D,E) Bar graphs comparing ELISA measurements (see Methods) of Aβ concentrations from brain homogenates of TgAD, TgAD/PrP−/−, TgAD/GSS and TgAD/HuPrP mice following extraction with formic acid (D) or RIPA buffer (E) (n = 3 mouse brains per group, 3 dilutions per experiment, and 2 independent experiments). See Supplemental Table 2B for actual values of FA-Aβ and RIPA-Aβ concentrations. (F) Western blots prepared as in A to assess relative levels of PrP (SAF-32), immature APP (imAPP), mature APP (mAPP) (mAb 22 C11), and PS1 (ab38323) in ~4.2 month-old TgAD mice with differing PrP expression levels and/or sequences. Each blot represents 1 of 3 replicates prepared from 3 mice per Tg line. Samples were loaded on one gel to probe for PrP, stripped, then re-probed for APP, PS1 and α-tubulin. (G) Bar graph comparing the total densitometric signals of APP, with immAPP (open bar) and mAPP (solid bar) fractions represented within each bar, measured with Quantity One (Bio-Rad) software and normalized to α-tubulin signals. Values were plotted as the relative percent of the corresponding signal in age-matched TgAD mice. Bars are mean ± S.D. of values from blots prepared from 3 mice, as in (F). (H) Bar graph comparing densitometric signals of steady state PS1, as in (F) and expressed as the relative percent of the corresponding signal in age-matched TgAD mice. Bars are mean ± S.D. of values from blots prepared from 3 mice, as in (F). See Supplemential Table 2C for actual values. For all above bar graphs, ANOVA and post hoc multiple comparisons tests were performed on each, and bars with asterisks represent differences between the specific groups *p < 0.05, **p < 0.01.
Figure 3
Figure 3
Impaired interaction between PrPA116V and Aβ. (A) Representative confocal immunofluorescence images of plaque deposits from each mouse line at ~4.2 months, immunostained for Aβ42 and PrP. Nuclei were stained with DAPI. Separate channels are displayed, along with merged images of representative plaques from each line. The merged image and two additional representative merged images from each line are displayed at 100X magnification. PrPC colocalized intensely with Aβ plaques in TgAD mice (row 1) and TgAD/HuPrP mice (row 2). TgAD/GSS mice exhibited no, or extremely low, PrPA116V co-staining at the periphery of Aβ plaques (row 3). Large GSS-type plaques within the cerebellum typical of GSS plaques, were positive for PrP and not Aβ (row 4). TgAD/PrP−/− mice show Aβ staining that colocalizes with the nuclear marker, DAPI (row 5). Scale bar = 10 μm. (B) Co-immunoprecipitation of Aβ and PrP from brain homogenates of ~4.2 month-old TgAD, TgAD/PrP−/−, and TgAD/GSS mice, and N2aAPPswe mouse neuroblastoma cell lysates from cells transfected with non-silencing siRNA (CTL), cells transfected with siRNA to knock down endogenous PrPC (PrP), and cells co-transfected with siRNA and a PrPA116V-containing pCB6 expression vector. To confirm binding from the input, 30 μg of protein from each sample was separated on SDS-PAGE and probed with human Fab D13 antibody to detect PrP (top panel). For co-IP, the samples were mixed with mouse anti-PrP SAF-32 antibody and the eluates were probed with D13 or rabbit anti-Aβ42 antibody PA3-16761. ɑ-tubulin was used as a loading control. The top panel blots of PrP from Tg mouse brain and N2a-APPswe cell lysates were each re-probed with α-tubulin to assess protein loads. The blots that label PrP after co-IP were re-probed for Aβ and displayed below their respective blot. (C) ELISA measurements of PrP concentrations in wild type (WT), TgPrP−/−, TgGSS, and TgHuPrP mouse brains (see Methods). *p < 0.05, **p < 0.01, ANOVA and post hoc multiple comparisons test. Each bar represents the mean ± S.D. (n = 6 mouse brains per group). (D) ELISA measurements (mean ± S.D) of brain-derived PrP binding to Aβ peptide. Aβ42 peptide (1.4 μM) was coated in a 96-well microplate (70 pmol per well) and the amount (pmol) of PrP bound was measured following application of 10% brain homogenates prepared from WT, TgPrP−/−, TgGSS, and TgAD/HuPrP mice, as described in Methods (n = 6 brains from each group at 3 dilutions per experiment, 2 independent experiments). *p < 0.05, **p < 0.01, ANOVA and multiple comparisons post-test. (E) Binding of PrP to Aβ, relative to the binding of mouse PrPC from WT mice, corrected for the different expression levels of PrP in each mouse line. Samples as in D. **p < 0.01, ANOVA and post-test multiple comparisons, p < 0.01 between all groups, except p > 0.05 between TgPrP−/− control and TgGSS.
Figure 4
Figure 4
PrPC expression correlates inversely with intracellular Aβ accumulation. (A) Confocal fluorescence (direct + indirect) images of paraffin embedded brain sections from the cortex of each Tg mouse line at ~4.2 months, stained with Thioflavin S (ThioS), DAPI, and anti-NeuN antibody. The most commonly associated plaque-types within each Tg mouse line are displayed. Spatially separated amyloid from NeuN or DAPI stained nuclei in TgAD mice (row 1). Amyloid deposits closely associated with NeuN and DAPI-positive nuclear material in TgAD/PrP−/− mice (row 2). Nuclear marker associated amyloid in cerebrum (row 3) but not in cerebellum (row 4) of TgAD/GSS mice. Amyloid deposit distinct from NeuN or DAPI stained nuclei in TgAD/HuPrP mice (row 5). Original magnification × 100. Scale bar = 20 μm. (B) Mouse brain sections prepared as in (A), but stained with anti-Aβ antibody, ThioS, and DAPI. In TgAD mice Aβ plaques not associated with nuclear markers (row 1, lower plaque) were most prevalent whereas plaques associated with nuclear markers (row 2) were much less common. Nuclear marker-associated plaques were the only type seen in TgAD/PrP−/− mice (row 3). Aβ plaques in TgAD/HuPrP mice werepredominantly separated from nuclear markers (row 4) although some  overlapped tightly with nuclear markers (row 5). Aβ deposits associated with nuclear markers in cerebrum of TgAD/GSS mice (row 6). Amyloid plaques in cerebellum of TgAD/GSS mice not associated with nuclear markers were not labeled by Aβ antibody (row 7) but were labeled by anti-PrP antibody (row 8). Original magnification × 100. Scale bar = 20 μm. (C) Bar graph displays the fraction of plaques not associated with nuclear markers (N−, solid bars) and those associated with nuclear markers (N+, open bars) in the four Tg mouse lines. The total area of N− and N+ Aβ plaques was determined using NIH ImageJ and plotted as the relative percentage measured for each Tg line at ~4.2 months of age. Each bar represents data from 3 parasagittal whole brain sections from each of 6 mice per group. See Supplemental Table 3A for actual values. (D) Representative brain sections prepared as in (A) but stained with anti-Aβ42 (MOAB-2) and anti-Cathepsin D (CTSD) antibodies, and DAPI. TgAD mice; row 1 - a well-formed extracellular Aβ plaque distinct from nuclear staining and not associated with CTSD staining, row 2 - a small Aβ plaque (solid arrowhead) within a CTSD-labeled cytosol and closely approximating nuclear material adjacent to a larger plaque not associated with nuclear staining or CTSD labeling (open arrowhead). TgAD/PrP−/− mice; row 3 - a large Aβ plaque associated with nuclear staining surrounded by a dispersed CTSD-labeled cytosol, row 4 - a compact perinuclear Aβ plaque closely associated and partially colocalizing with CTSD-labeling, row 5 – a small plaque overlapping nuclear staining and surrounded by a CTSD densely-labeled cytosol. TgAD/GSS mice; row 6 - a dense plaque overlapping nuclear staining and surrounded by CTSD-labeled puncta, row 7- perinuclear accumulation of Aβ in cytosol with CTSD labeling in two cells, row 8- several cells with punctate Aβ within cytosol that colocalizes with CTSD puncta. TgAD/HuPrP mice; row 9 – Large extracellular Aβ-plaque distinct from nuclear material and CTSD-labeled puncta; row 10 – compact Aβ-plaque overlapping nuclear staining and surrounded by CTSD-labeled puncta. Enlarged sections from rows 4, 6, and 8 highlight colocalization of Aβ with CTSD-positive puncta. Original magnification 100X. Scale bar = 20 μm. (E) Representative Western blot of Aβ within cytosolic and nuclear fractions prepared from brain (see Methods) of TgAD, TgAD/PrP−/− and TgAD/GSS mice. (F) Bar graph below the Western blot displays the mean relative level ± S.D. of cytosolic and nuclear Aβ normalized to cytosolic Aβ in TgAD mice (n = 3 brain samples/group). Semi-quantitation of signal density was performed using Quantity One software (Bio-Rad). Supplemental Table 3B lists the plotted values. ANOVA and post hoc multiple comparison tests were performed on each, *p < 0.05, **p < 0.01.
Figure 5
Figure 5
Intracellular-type Aβ plaque accumulation in mice lacking PrPC is not reversed by PrPA116V. (A) Confocal fluorescence (direct + indirect) images of paraffin embedded mouse brain sections from the cortex of ~4.2 month-old Tg mouse lines. Sections were immunostained with M78 antibody to label intracellular fibrillar Aβ42, and 6E10 antibody to label intracellular and extracellular Aβ. Nuclei are labeled by DAPI. Separate channels and merged images are displayed. Yellow color denotes colocalization. Scale bar = 100 μm. (B) Representative confocal images (100X magnification) of brain sections from ~4.2 month-old Tg mice from panel A co-immunostained with 6E10 and M78. DAPI labeled nuclei. Extracellular Aβ plaques labeled only by 6E10 in TgAD mice (row 1) and TgAD/HuPrP mice (row 7, asterisk). Intracellular accumulation of Aβ dual-labeled with 6E10 and M78 as plaque-like accumulations in TgAD (row 2), TgAD/GSS (rows 3 and 4), mice, or diffuse accumulations, as in the example in TgAD/PrP−/− (row 5) and TgAD/HuPrP (row 7). Arrowheads in merged images in rows 3, 4, and 8 indicate 6E10 labeling of the plasma membrane that circumscribes the co-stained intracellular accumulations. Scale bar = 10 μm. (C) Graphic display of actual mean ± S.D. of intracellular (open bars), extracellular (black bars), and total (blue bars) Aβ plaque counts per section for each of the four Tg mouse lines. Plaques labeled only by 6E10 were manually counted as extracellular and those stained by both M78 and 6E10 were counted as intracellular. Six mouse brains per line, 3 parasagittal sections per brain, were analyzed. See Supplemental Table 4A for actual values. (D) Graphic display depicts the fraction of intracellular (open bars) and extracellular (solid bars) Aβ plaques within each of the four Tg mouse lines. See Supplemental Table 4B for actual values.
Figure 6
Figure 6
PrPC but not PrPA116V promotes secretion of Aβ from N2aAPPswe cells. (A) Western blot confirms PrPC knockdown and PrPA116V expression in N2aAPPswe cells used in Aβ secretion studies. Cells were transfected with a non-silencing control siRNA as control (CTL) (lanes 1 and 2), or they were transfected with anti-PrPC siRNA (lanes 2 and 3), or co-transfected with anti-PrPC siRNA and a pCB6 expression vector containing PrPA116V (lanes 5 and 6). The transfection media was removed 24 h later and the cells were incubated with OPTI-MEM I for 24 h, then lysed and harvested for Western blotting. From cell lysates, 30 μg of protein was subjected to 12.5% SDS-PAGE then transferred to PVDF membranes and probed with anti-PrP SAF-32 mAb and α-tubulin. (B) N2aAPPswe cells were grown on coverslips and transfected as in A, then prepared for immunofluorescence and labeled with anti-PrP mAb SAF-32 and anti-Aβ42 antibody PA3-16761. Confocal fluorescence images of cells are shown at 20X (left panel) and 100X (right panel) magnification. Scale bars = 10 μm. (C) Bar graph displays ELISA measurements (pg) of total Aβ from control N2aAPPswe cells (CTL), after PrP knock down (PrP−/−), and after PrP knock down combined with PrPA116V transfection. Samples used were 30 μg of protein from lysates and 5 μL of 10 mL media. Total human Aβ42 levels were calculated from the measures of total lysate and total media. Six samples per group with 2 replicates per sample were tested. See Supplemental Table 5 for actual values. ANOVA p > 0.05. (D) Intracellular (solid bars) and secreted (open bars) Aβ (pg) measured by ELISA from a fraction of cell lysate and media, respectively. Six samples per group with 2 replicates each were tested. See Supplemental Table 5 for actual values. ANOVA results for intracellular Aβ in cell lysates: p < 0.01, post hoc multiple comparisons test, **p < 0.01 between CTL and PrP, CTL and PrPA116V; p > 0.05 between PrP and PrPA116V cells. Aβ in media, p < 0.01 ANOVA, post hoc multiple comparisons test, **p < 0.01 between CTL and PrP, and PrPA116V; p > 0.05 between PrP and PrPA116V cells.
Figure 7
Figure 7
PrPC but not PrPA116V is co-secreted with Aβ in exosomes. (A) Transmission electron microscopy (TEM) of exosomes isolated from media of N2a-APPswe cells mock-transfected (1), transfected with siRNA against PrPC (2), siRNA against PrPC plus pCB6-PrPA116V (3), or siRNA against PrPC plus pCB6-WT-PrP (4). Exosomes were isolated and purified by ExoQuick-TC ULTRA EV Isolation Kit for Tissue Culture Media (SBI), then applied to copper grids, stained with uranyl acetate prior to visualization with TEM. Vesicular morphology in the size range of ~20–70 nm is consistent with exosomes and each prep had similar densities. (B,C) Semi-quantitation of PrP, Aβ, and APP in cell lysates and exosomes prepared from N2a-APPswe cells. Representative Western blots are adjacent to the corresponding bar graph. Cells were harvested 48 h after transfection and exosomes prepared as described in Methods. Lane 1) mock-transfected, Lane 2) transfected with anti-PrPC siRNA, Lane 3) cotransfected with anti-PrPC siRNA and pCB6 vector carrying PrPA116V, Lane 4) cotransfected with anti-PrPC siRNA and pCB6 vector carrying WT PrPC. Antibodies were SAF-32 (PrP), anti-Alix mAb, anti-flotillin-1 mAb, anti-CD63 mAb, anti-Aβ42 antibody, 22C11 (APP), and α-tubulin antibody. To detect Aβ, preps were loaded onto 6% and 16.5% discontinuous tricine-tris SDS-PAGE gels with SDS loading buffer without β-ME, otherwise 12% SDS gels with β-ME. PrP, APP and α-tubulin were individually probed on the same blot and displayed separately for cell lysates and exosome fractions. Because a discontinuous gel was necessary to probe for Aβ, it was run on a separate Western and re-probed for α-tubulin from cell lysates. Westerns of exosome samples were initially probed for Aβ, then reprobed for flotillin-1, alix, and CD63. Signal Intensities of PrP, APP, Aβ, CD63, and flotillin-1 were normalized to signals of α-tubulin (cell lysates) or Alix (exosomes) and presented as the percentage change from untreated N2a-APPswe cells. Bars are means ± S.D. of 3 independent experiments. See Supplemental Tables 6A (lysates) and 6B (exosomes) for actual values plotted. ANOVA and post hoc multiple comparisons test, *p < 0.05 and **p < 0.01.

Similar articles

Cited by

References

    1. Hardy J, Allsop D. Amyloid deposition as the central event in the aetiology of Alzheimer’s disease. Trends in pharmacological sciences. 1991;12:383–388. doi: 10.1016/0165-6147(91)90609-V. - DOI - PubMed
    1. Mudher A, Lovestone S. Alzheimer’s disease-do tauists and baptists finally shake hands? Trends Neurosci. 2002;25:22–26. doi: 10.1016/S0166-2236(00)02031-2. - DOI - PubMed
    1. Schwarze-Eicker K, et al. Prion protein (PrPc) promotes beta-amyloid plaque formation. Neurobiol Aging. 2005;26:1177–1182. doi: 10.1016/j.neurobiolaging.2004.10.004. - DOI - PubMed
    1. Gimbel DA, et al. Memory impairment in transgenic Alzheimer mice requires cellular prion protein. The Journal of neuroscience: the official journal of the Society for Neuroscience. 2010;30:6367–6374. doi: 10.1523/JNEUROSCI.0395-10.2010. - DOI - PMC - PubMed
    1. Parkin ET, et al. Cellular prion protein regulates beta-secretase cleavage of the Alzheimer’s amyloid precursor protein. Proc Natl Acad Sci USA. 2007;104:11062–11067. doi: 10.1073/pnas.0609621104. - DOI - PMC - PubMed

Publication types

MeSH terms