. 2019 Jun;570(7761):338-343.
doi: 10.1038/s41586-019-1295-z. Epub 2019 Jun 12.

Structural mechanism for NEK7-licensed activation of NLRP3 inflammasome

Affiliations

Structural mechanism for NEK7-licensed activation of NLRP3 inflammasome

Humayun Sharif et al. Nature. 2019 Jun.

Abstract

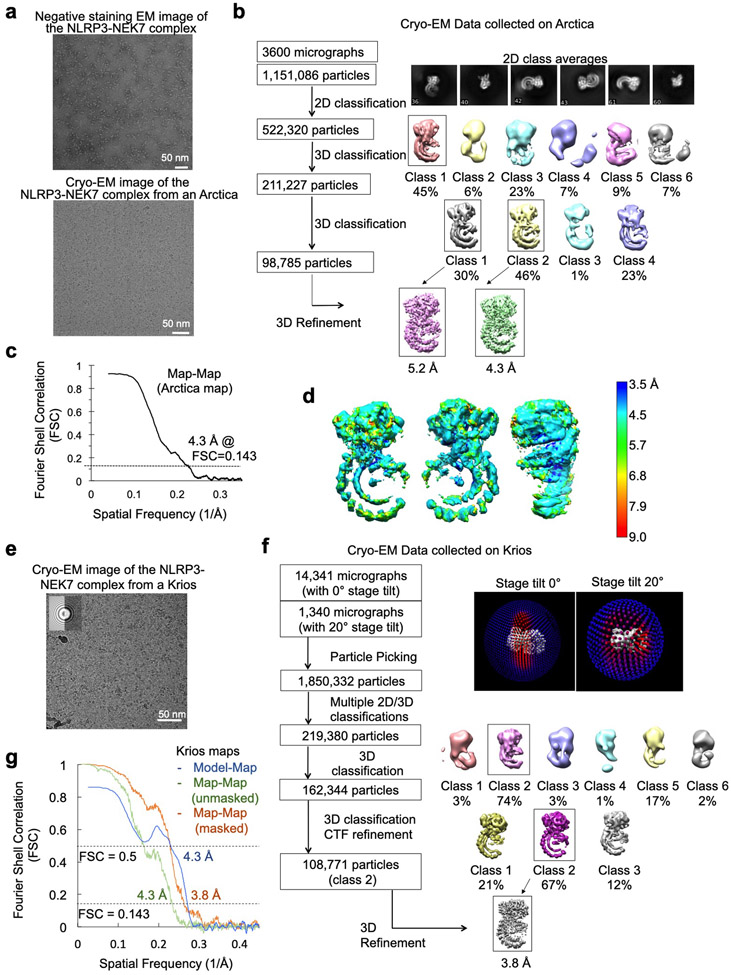
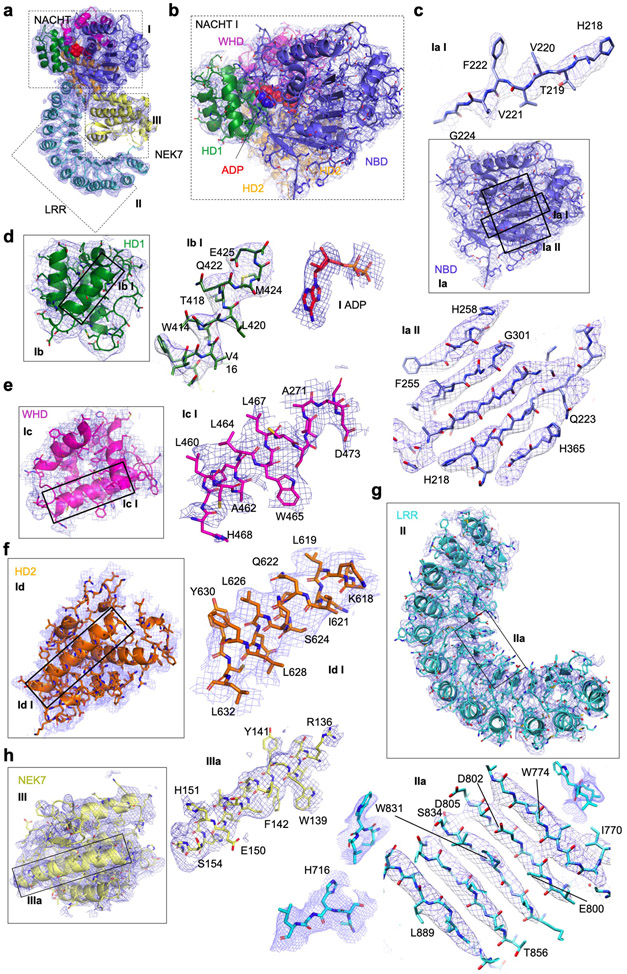
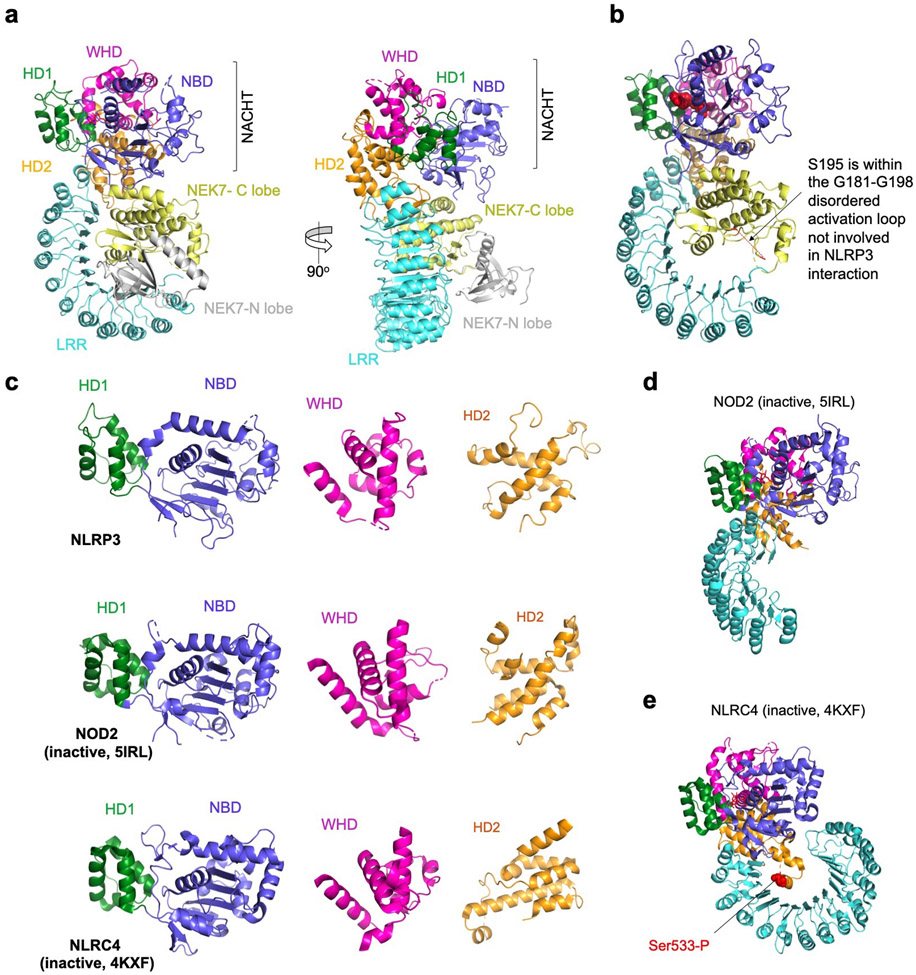
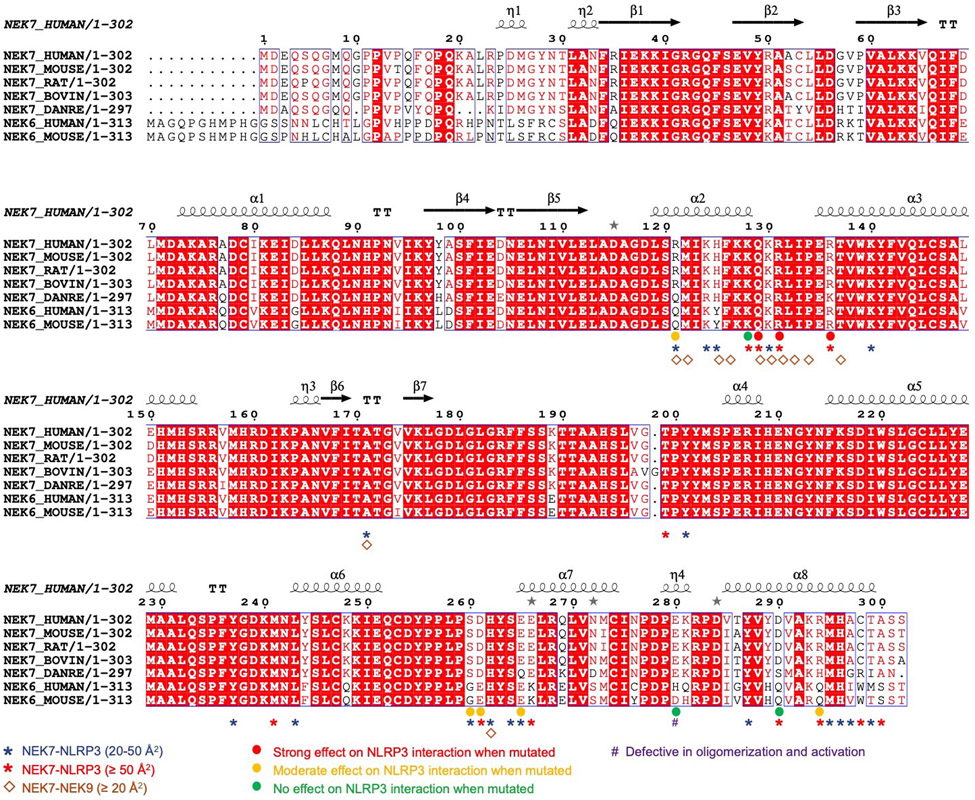
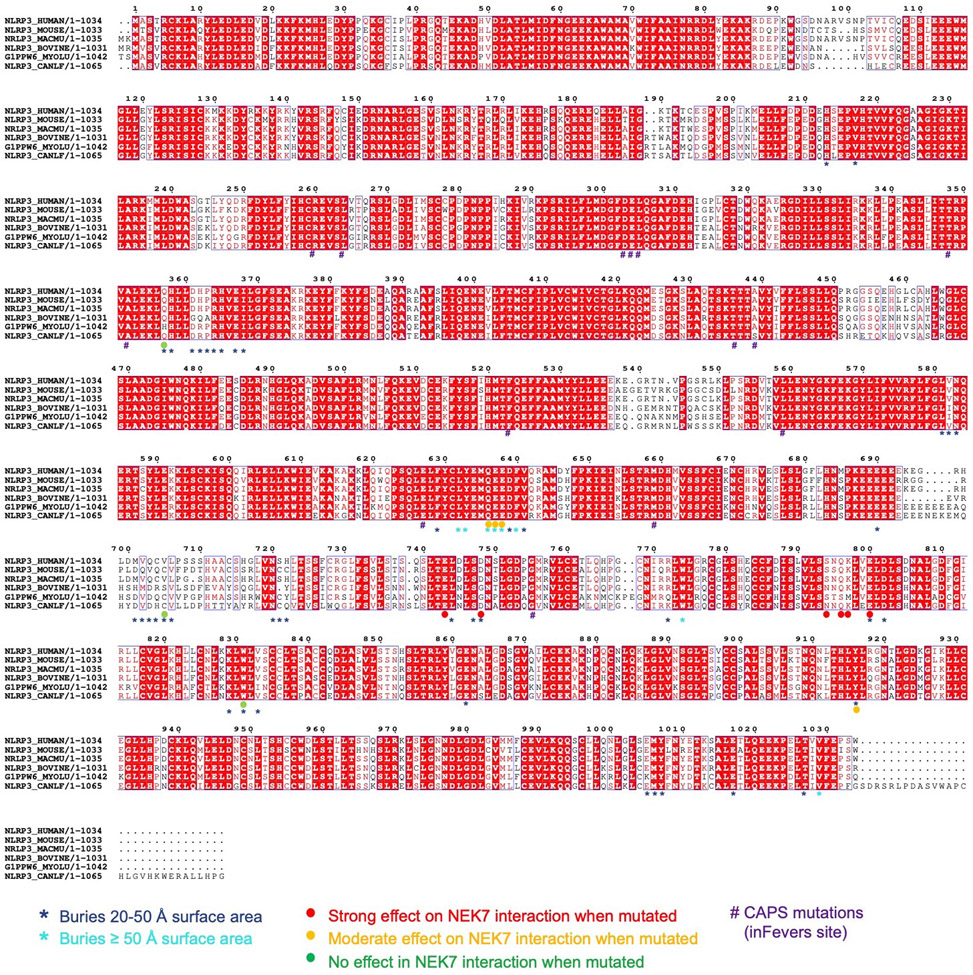
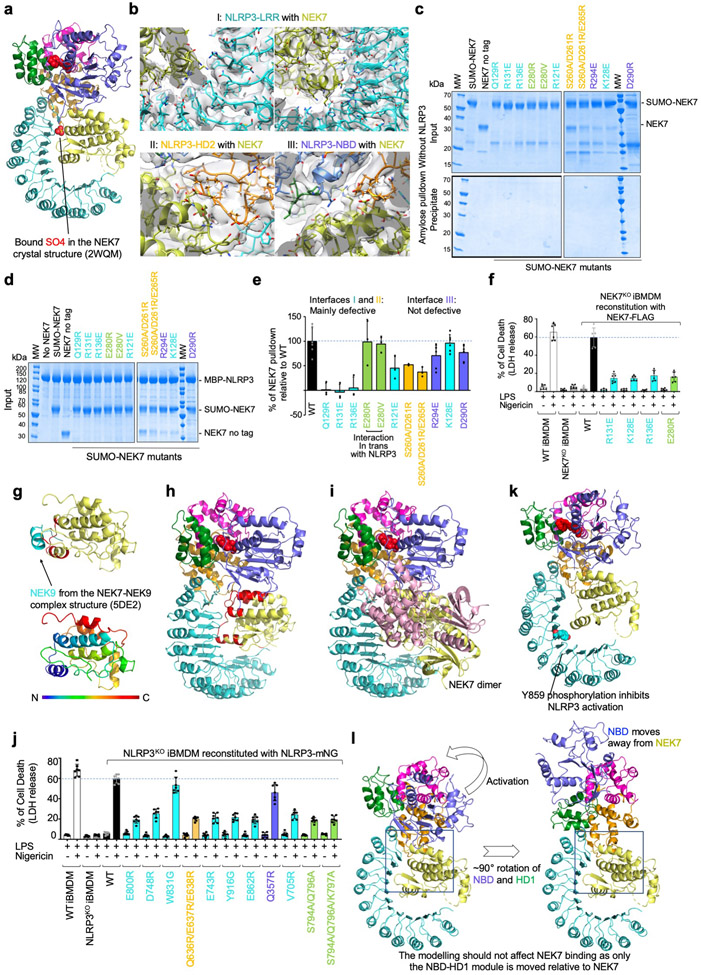
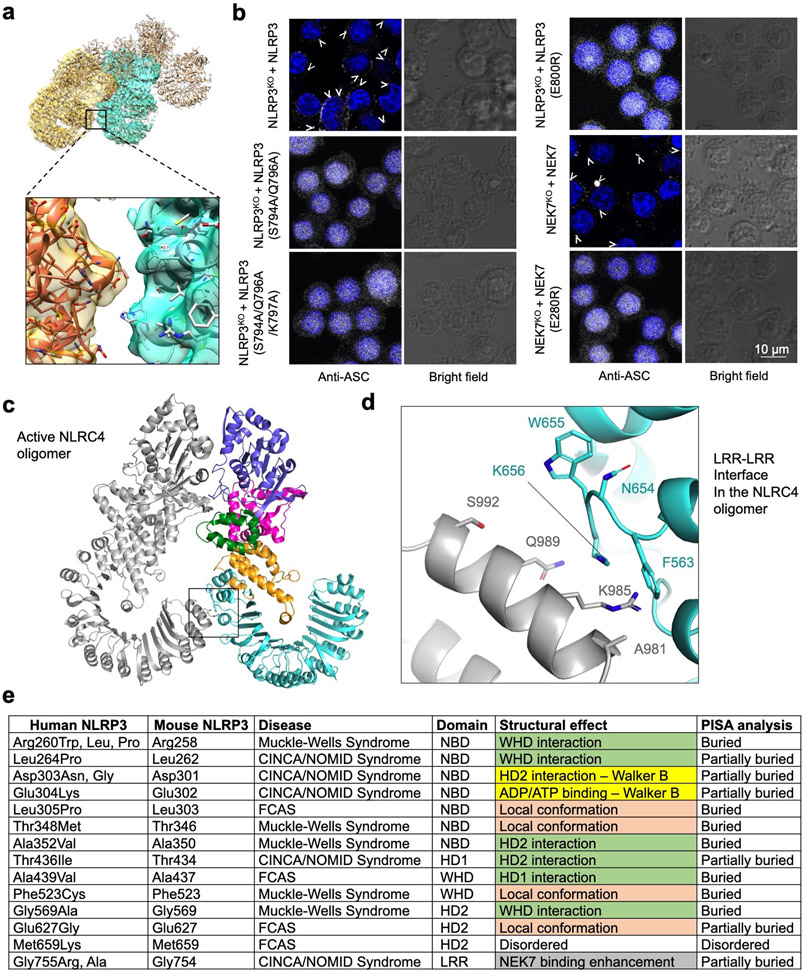
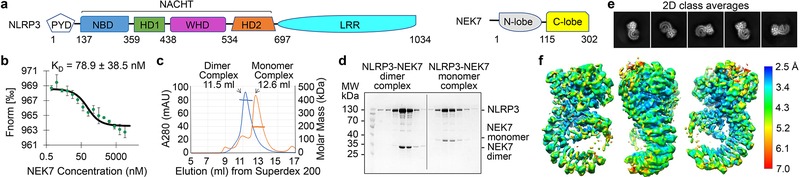
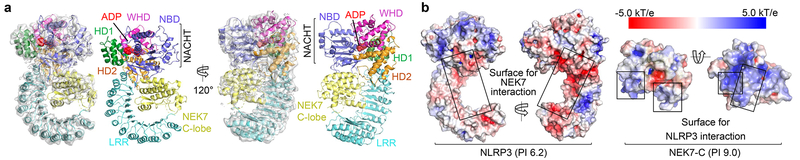
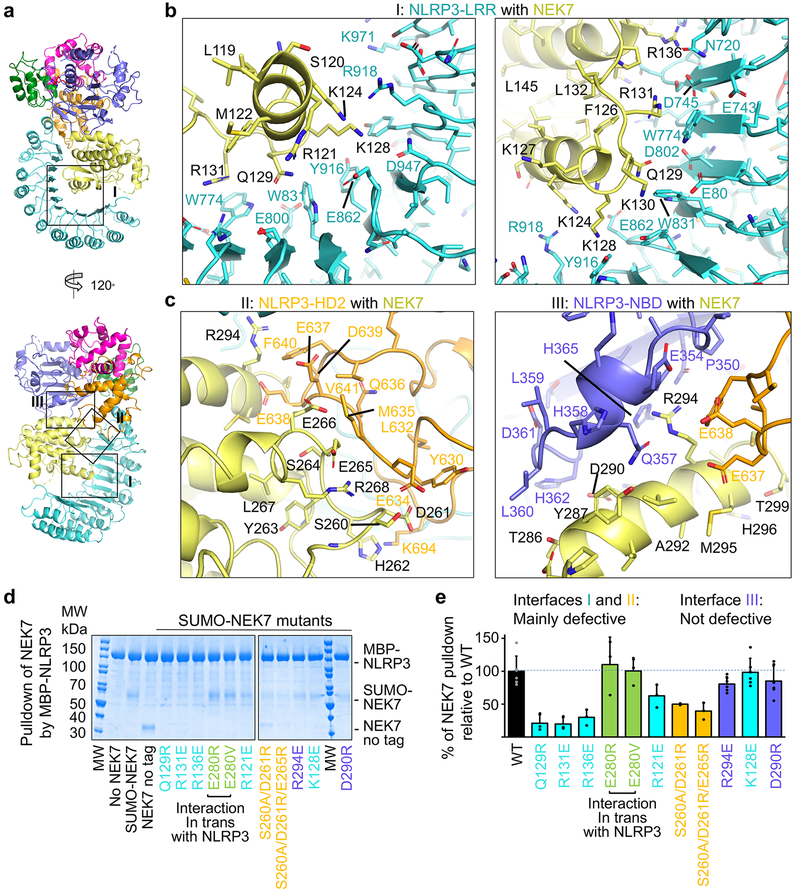
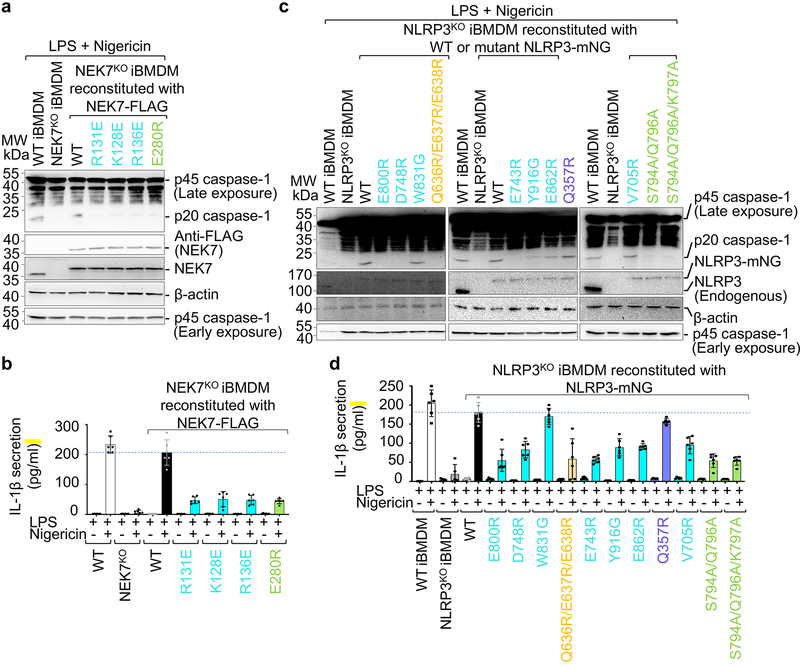
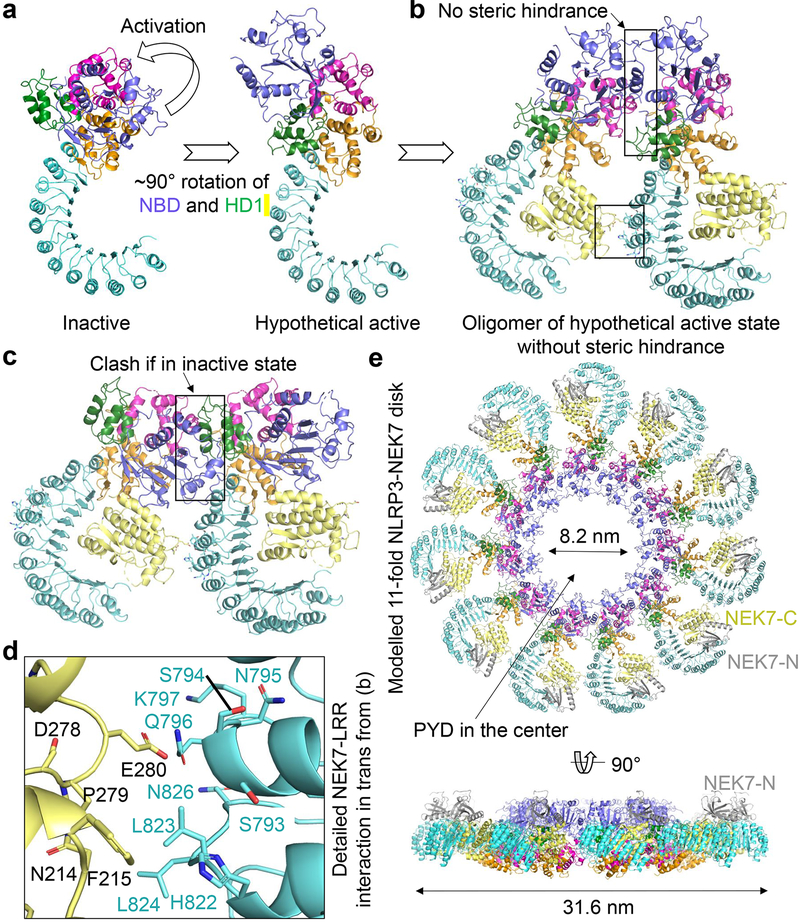
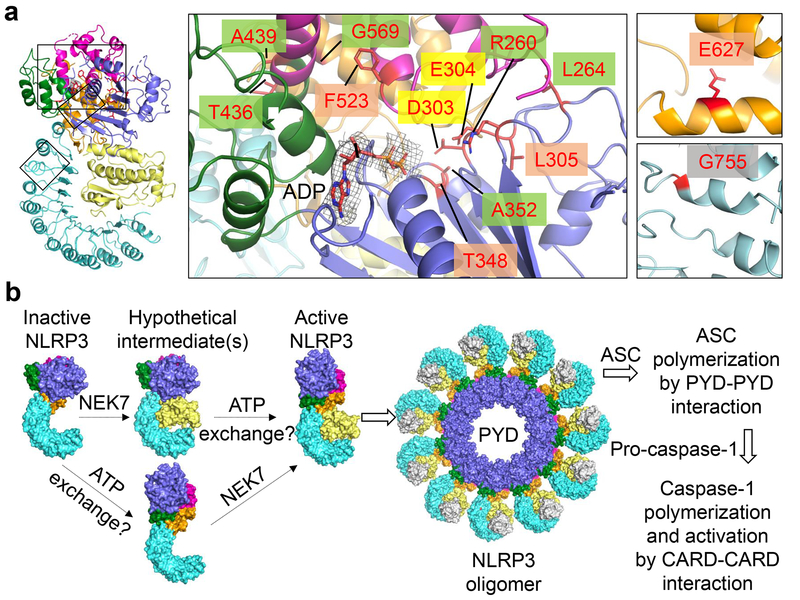
The NLRP3 inflammasome can be activated by stimuli that include nigericin, uric acid crystals, amyloid-β fibrils and extracellular ATP. The mitotic kinase NEK7 licenses the assembly and activation of the NLRP3 inflammasome in interphase. Here we report a cryo-electron microscopy structure of inactive human NLRP3 in complex with NEK7, at a resolution of 3.8 Å. The earring-shaped NLRP3 consists of curved leucine-rich-repeat and globular NACHT domains, and the C-terminal lobe of NEK7 nestles against both NLRP3 domains. Structural recognition between NLRP3 and NEK7 is confirmed by mutagenesis both in vitro and in cells. Modelling of an active NLRP3-NEK7 conformation based on the NLRC4 inflammasome predicts an additional contact between an NLRP3-bound NEK7 and a neighbouring NLRP3. Mutations to this interface abolish the ability of NEK7 or NLRP3 to rescue NLRP3 activation in NEK7-knockout or NLRP3-knockout cells. These data suggest that NEK7 bridges adjacent NLRP3 subunits with bipartite interactions to mediate the activation of the NLRP3 inflammasome.


Figures

Extended Data Fig. 1 |
Extended Data Fig. 1 |. NLRP3-NEK7 protein purification and characterization.
a, Raw traces (of three independent replicates) of MST measurements corresponding to titration of NEK7 against Alexa488-labelled NLRP3. b-d, Representative thermal denaturation curves of NLRP3 (b), NEK7 (c) and complex (d), alone and in the presence of ADP and/or MCC950. The peak minima of the derivative curves correspond to the protein melting temperatures (Tm) (repeated ≥ 3 times). e, Gel filtration profile of WT NEK7 (monomer) and engineered NEK7 dimer on Superdex 200 column (repeated ≥ 5 times). f, Molecular masses of NLRP3-NEK7 dimer and monomer complexes measured by in-line multi-angle light scattering (MALS).
Extended Data Fig. 2 |
Extended Data Fig. 2 |. Analysis and work flow for cryo-EM data collected on a Talos Arctica and on a Titan Krios.
a A negative staining EM image (top, one among a few hundred images) and a cryo-EM micrograph (bottom, one among a few thousand images) of the NLRP3-NEK7 complex from a Talos Arctica. Scale bars equal 50 nm. b, Work flow of cryo-EM data analysis of the Arctica data performed in Relion 3.0 and cisTEM. c, Gold-standard FSC curve between two half maps from the Arctica data. d, Local resolution estimation of the Arctica map generated by ResMap, coloured on the cryo-EM density (8σ). Highest resolution is observed where NEK7 interacts with NLRP3. e, A cryo-EM micrograph of the NLRP3-NEK7 complex from a Titan Krios (one among a few thousand images). Scale bar in the micrograph is 50 nm. The inset shows the modelled (left) and actual (right) Thon rings. f, Work flow of cryo-EM data analysis of the Krios data done in Relion 3.0 and ROME1.1. The upper right insets show the orientation distributions of the particles from the dataset of tilt 0° and tilt 20° respectively. g, Gold-standard FSC curves between two half maps from the Krios data with mask (orange) and without mask (green), and between map and model (blue).
Extended Data Fig. 3 |
Extended Data Fig. 3 |. Local density fitted with NLRP3 and NEK7.
All zoom-in views are labelled with domain names and selected segment residue numbers. Densities are shown at 3σ.
Extended Data Fig. 4 |
Extended Data Fig. 4 |. Predicted and cryo-EM-derived secondary structures of the NLRP3-LRR domains aligned to NLRP3 and NAIP5 sequences.
12 LRRs in NLRP3 were predicted by the Phyre2 server.
Extended Data Fig. 5 |
Extended Data Fig. 5 |. The NLRP3-NEK7 complex structure showing the modelled full length NEK7 and NLRP3 domain comparisons.
a, Two views of the NLRP3-NEK7 complex structure with the NEK7-N lobe (gray) modelled from the NEK7 crystal structure (2WQM). b, The disordered activation loop including S195 in the NLRP3-NEK7 complex, which is not involved in NLRP3 interaction. c, NBD-HD1, WHD and HD2 of NLRP3, NOD2 (5IRL) and NLRC4 (4KXF) superimposed and shown side by side for comparison. d-e, NOD2 (d) and NLRC4 (e) structures, in inactive conformations and in the orientation of NLRP3 (a) by superposing on the NBD-HD1 domains. Location of phosphorylated Ser533 of NLRC4 is labeled.
Extended Data Fig. 6 |
Extended Data Fig. 6 |. Multiple sequence alignment of NEK7 and NEK6.
Multiple sequence alignment was performed by the eScript server. Annotations are based on the PISA server analysis and mutational data from Fig. 3 and Fig. 4.
Extended Data Fig. 7 |
Extended Data Fig. 7 |. Multiple sequence alignment of NLRP3.
Multiple sequence alignment was performed by the eScript server. Annotations are based on the PISA server analysis and mutational data from Fig. 3 and Fig. 4.
Extended Data Fig. 8 |
Extended Data Fig. 8 |. Structural analysis, mutagenesis tests and overlap between the NEK9- and NLRP3-binding sites on NEK7.
a, Position of the bound SO4 ion as in the NEK7 crystal structure, superimposed here in the NLRP3-NEK7 complex structure. b, Cryo-EM densities (5σ) at the NLRP3-NEK7 interfaces. Views correspond to those of Fig. 3b–c. c, Amylose pulldown of WT and mutant NEK7 without NLRP3, showing input and precipitate gels, which serve as negative controls for Fig. 3d. Experiments were repeated 3–6 times. d, Input gel for amylose pulldown of WT and mutant NEK7 shown in Fig. 3d. Experiments were repeated 3–6 times. e, Alternative calculation of the % of NEK7 pulldown relative to WT by subtracting the NEK7/NLRP3 ratio in the absence of NEK7 from the observed NEK7/NLRP3 ratio (shown as mean ± s.d. for n=3–6) f, Cytoplasmic LDH released into the supernatant quantified by comparison with total intracellular LDH of untreated cells (Triton X-lysed). Data are presented as mean ± s.d. for n=3 from two independent experiments. g, Top: Mapping the NEK9-binding site onto the NEK7-NEK9 complex structure (5DE2). NEK7 and NEK9 are shown in yellow and cyan, respectively, with the NEK9-binding residues of NEK7 highlighted in red. Bottom: A rainbow coloured NEK7 structure showing that the NEK9-binding residues are from the first part of the NEK7 C-lobe. h, Mapping the NLRP3-binding site (red) onto NEK7 in the NLRP3-NEK7 structure. The NLRP3-binding site overlaps with the NEK9-binding site on NEK7. i, Superposition of NEK7 back-to-back dimer (yellow and pink) in the NEK7-NEK9 complex structure (5DE2) onto the NEK7 monomer in the NLRP3-NEK7 structure. The pink monomer in the NEK7 dimer clashes with NLRP3, suggesting that NEK7 dimerization cannot occur in the NLRP3-NEK7 complex. j, NLRP3KO iBMDMs were reconstituted with WT or mutant human mNeonGreen-tagged NLRP3, primed by LPS (4 hours) and stimulated by nigericin (30 min). LDH release were analysed as in Extended Data Fig. 8f. Dots: individual data points. Data are presented as mean ± s.d. for n=3 from two independent experiments. k, LRR phosphorylation at Y859 that might cause steric and charge repulsion with NEK7. l, NLRP3 activation model and NEK7 interactions. The hypothetical ~90° rotation of NBD-HD1 of NLRP3 upon activation moves NBD away from the NEK7 interaction region indicated by a box.
Extended Data Fig. 9 |
Extended Data Fig. 9 |. NLRP3-NEK7 interaction in trans and NLRP3 CAPS mutations.
a, Cryo-EM density (5σ) fitted to the oligomeric model, zoomed in at an NLRP3-NEK7 interface in trans. b, Immunofluorescence imaging for assessing ASC speck formation. NLRP3KO and NEK7KO iBMDMs were reconstituted with WT and mutant constructs as depicted. ASC speck formation upon nigericin activation was analysed by anti-ASC antibody. Nucleus was stained by Hoechst 33342. Scale bar 10 μm. Images are representative of two independent experiments c, An active NLRC4 oligomer structure shown for the LRR-LRR interaction. d, Zoom-in view showing the detailed LRR-LRR interaction in trans boxed in (c). e, Mapping of pathogenic disease mutations onto the NLRP3 structure. CAPS-associated pathogenic mutations derived from the Infevers database are shown with predicted effect based on the NLRP3 structure. Green: disruption of inter-domain interactions in the inactive conformation; mauve: change of local conformation by mutating residues buried within the domains; yellow: alteration in key residues in the Walker B motif; grey: enhancement of NEK7 binding.
Fig. 1 |
Fig. 1 |. Biochemical characterization and cryo-EM structure determination.
a, Schematic domain representation of human NLRP3 and NEK7, with labelled domain boundary defined from this work. b, MST analysis of NEK7 binding to NLRP3. A dissociation constant of 78.9 ± 38.5 nM was calculated from three independent replicates (shown as mean ± s.d.). c, Reconstitution of NLRP3-NEK7 dimer and monomer complexes on Superdex 200 gel filtration column (repeated ≥ 5 times). Molecular mass distribution within each peak was calculated from in-line MALS measurements, and shown in blue and orange for the dimer and monomer complexes, respectively (Performed once). d, SDS-PAGE gels of eluted fractions of dimer and monomer complexes (repeated ≥ 5 times). e, Representative 2D class averages from the 300 keV cryo-EM dataset, selected amongst 100 classes. f, The final cryo-EM density map (shown at 6σ) in three orientations and coloured with local resolutions by ResMap.
Fig. 2 |
Fig. 2 |. Cryo-EM structure overview.
a Ribbon diagrams of the complex, shown with and without the cryo-EM map (grey, 5σ) in two orientations. Domains are colour coded as in Fig. 1a and the bound ADP is in sphere rendering. b, Electrostatic surface representation of NLRP3 and NEK7, colour coded according to electrostatic potential from red (−5.0 kT/e, negatively charged) to blue (+5.0 kT/e, positively charged).
Fig. 3 |
Fig. 3 |. Structural insights into NEK7 interaction with NLRP3.
a, The NLRP3-NEK7 complex in two orientations to denote the three interaction regions (I, II and III). b-c, Zoom-in views of interaction interfaces between NEK7 and LRR of NLRP3 (b) and between NEK7 and HD2 and NBD of NLRP3 (c), with main chains in cartoons and side chains in sticks. d, Pulldown of purified WT and mutant His-SUMO-tagged NEK7 by purified MBP-tagged WT NLRP3 using amylose resin. Experiments were performed three to six times. NEK7 mutants are coloured by the domain of NLRP3 that they contact with as in (a-c). MW: molecular weight markers. e, Quantification of mutant NEK7 binding to NLRP3 relative to WT NEK7 (shown as mean ± s.d. with n = 3–6). Dots: individual data points. For gel source data, see Supplementary Figure 1.
Fig. 4 |
Fig. 4 |. Structure-guided mutations of NLRP3 and NEK7 on inflammasome activation.
NEK7 and NLRP3 mutations are coloured as in Fig. 3d–e except that mutations on interactions in trans are coloured in green. a-b, NEK7KO iBMDMs were reconstituted with WT or mutant FLAG-tagged human NEK7, primed by LPS (4 hours) and stimulated by nigericin (30 min). Cells were analysed by Western blot for caspase-1 processing using a specific anti-caspase-1 antibody (repeated 3 times) (a). The full-length caspase-1 (p45) and processed large subunit of caspase-1 (p20) are labelled (first blot from the top). Caspase-1 p45 was also analysed by an early exposure to show equal loading (fifth blot). Reconstituted NEK7 was probed by anti-NEK7 and anti-FLAG antibodies (second and third blots), and loading was analysed by an anti-β-actin antibody (fourth blot). Mature IL-1β released in the supernatant was measured by ELISA (b). Data are presented as mean ± s.d. for n=3 each from two independent experiments. Dots: individual data points. c-d, NLRP3KO iBMDMs were reconstituted with WT or mutant human mNeonGreen-tagged NLRP3, primed by LPS (4 hours) and stimulated by nigericin (30 min). Caspase-1 processing (repeated 3 times) (c) and IL-1β release (shown as mean ± s.d. with n=3 each from two independent experiments) (d) were analysed as in (a-b). Dots: individual data points. For gel source data, see Supplementary Figure 1.
Fig. 5 |
Fig. 5 |. Modelling of active NLRP3 conformation and oligomerization.
a Modelled active NLRP3 (right) from its inactive structure (left) using the activation mechanism of NLRC4 in which NBD-HD1 module rotates by 90° relative to WHD-HD2-LRR module,. b, A dimer model of the active NLRP3-NEK7 complex based on the NLRC4 disk. Interaction surfaces are boxed. c, A hypothetical inactive NLRP3 dimer would have created steric clashes at multiple sites in the NACHT domain. d, Zoom-in view showing the detailed NEK7-LRR interaction in trans boxed in (b). Mutations at this interface compromised NLRP3 inflammasome activation as in Fig. 4. e, NLRP3-NEK7 inflammasome disk modelled after the NLRC4 11-subunit disk structure, shown in two orientations.
Fig. 6 |
Fig. 6 |. NLRP3 CAPS mutations and model of NEK7-mediated NLRP3 inflammasome activation.
a Structure mapping of all validated pathogenic mutations of NLRP3 from the Infevers website, highlighted by background colours behind residue labels. Density for ADP is shown (3σ). Green: disruption of inter-domain interactions in the inactive conformation; mauve: change of local conformation by mutating residues buried within the domains; yellow: alteration in key residues in the Walker B motif; grey: enhancement of NEK7 binding. b, A proposed two-step NLRP3 inflammasome activation model.

Comment in

  • Enzymes that detoxify marine toxins.
    McCallum ME, Balskus EP. McCallum ME, et al. Nature. 2019 Jun;570(7761):315-316. doi: 10.1038/d41586-019-01742-1. Nature. 2019. PMID: 31213676 No abstract available.
  • A licence to kill during inflammation.
    Nozaki K, Miao EA. Nozaki K, et al. Nature. 2019 Jun;570(7761):316-317. doi: 10.1038/d41586-019-01764-9. Nature. 2019. PMID: 31213677 No abstract available.

References

    1. Lamkanfi M & Dixit VM Mechanisms and functions of inflammasomes. Cell 157, 1013–1022 (2014). - PubMed
    1. Broz P & Dixit VM Inflammasomes: mechanism of assembly, regulation and signalling. Nat Rev Immunol 16, 407–420 (2016). - PubMed
    1. Guo H, Callaway JB & Ting JP Inflammasomes: mechanism of action, role in disease, and therapeutics. Nat Med 21, 677–687 (2015). - PMC - PubMed
    1. Shi J, Gao W & Shao F Pyroptosis: Gasdermin-Mediated Programmed Necrotic Cell Death. Trends Biochem Sci (2016). - PubMed
    1. Liu X et al. Inflammasome-activated gasdermin D causes pyroptosis by forming membrane pores. Nature 535, 153–158 (2016). - PMC - PubMed

Publication types

MeSH terms