. 2019 Jun 12;9(1):8568.
doi: 10.1038/s41598-019-45012-6.

Infiltrating CCR2+ monocytes and their progenies, fibrocytes, contribute to colon fibrosis by inhibiting collagen degradation through the production of TIMP-1

Affiliations

Infiltrating CCR2+ monocytes and their progenies, fibrocytes, contribute to colon fibrosis by inhibiting collagen degradation through the production of TIMP-1

Naoki Kuroda et al. Sci Rep. .

Abstract

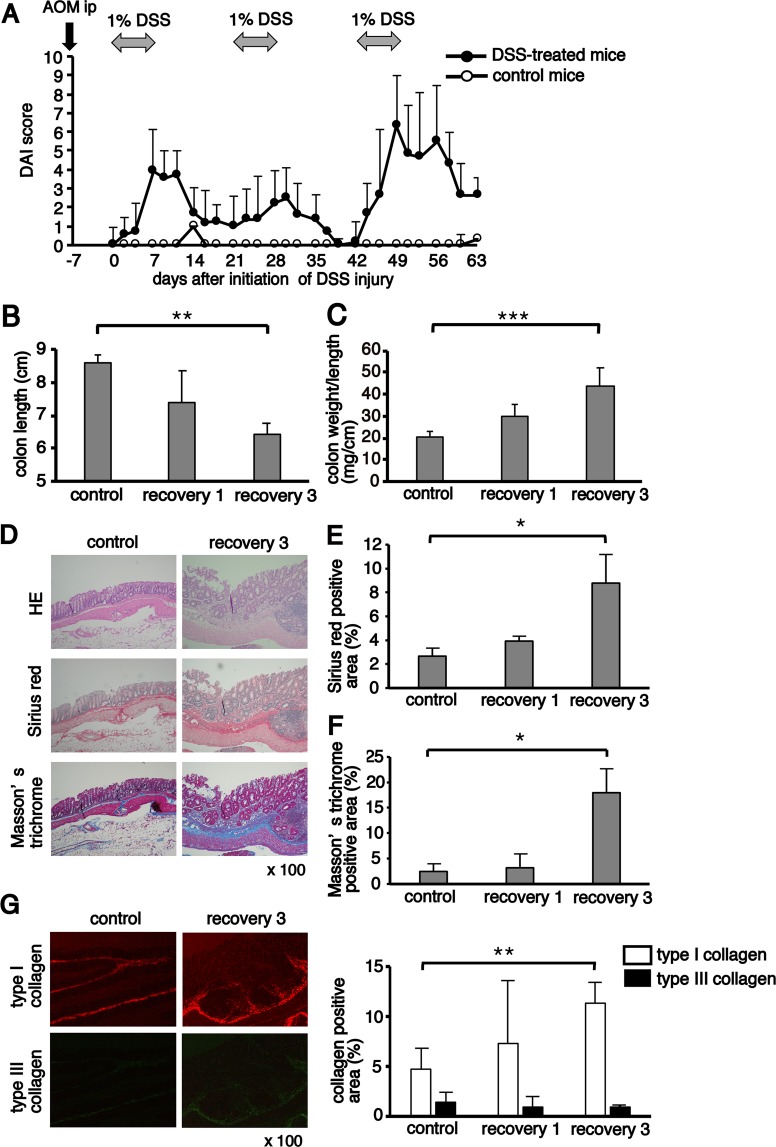
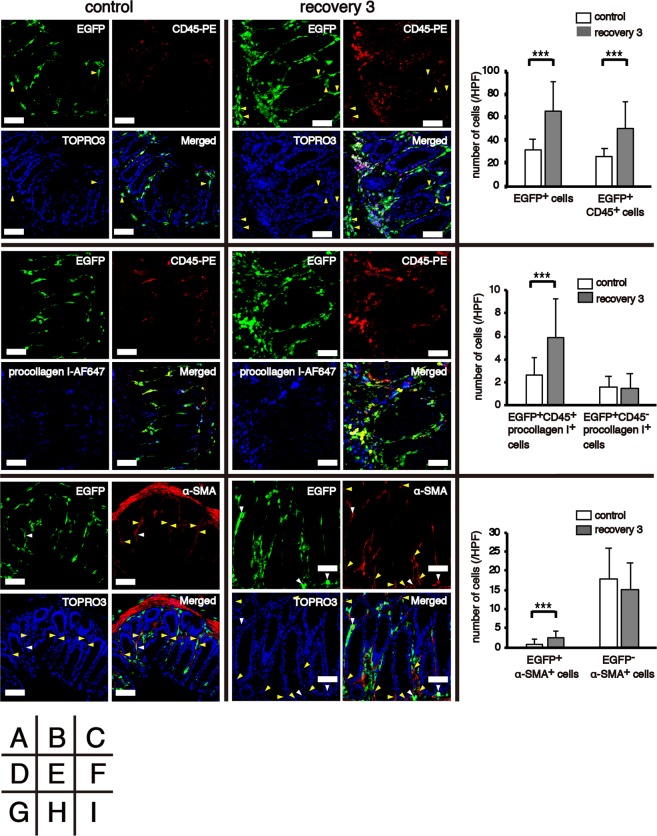
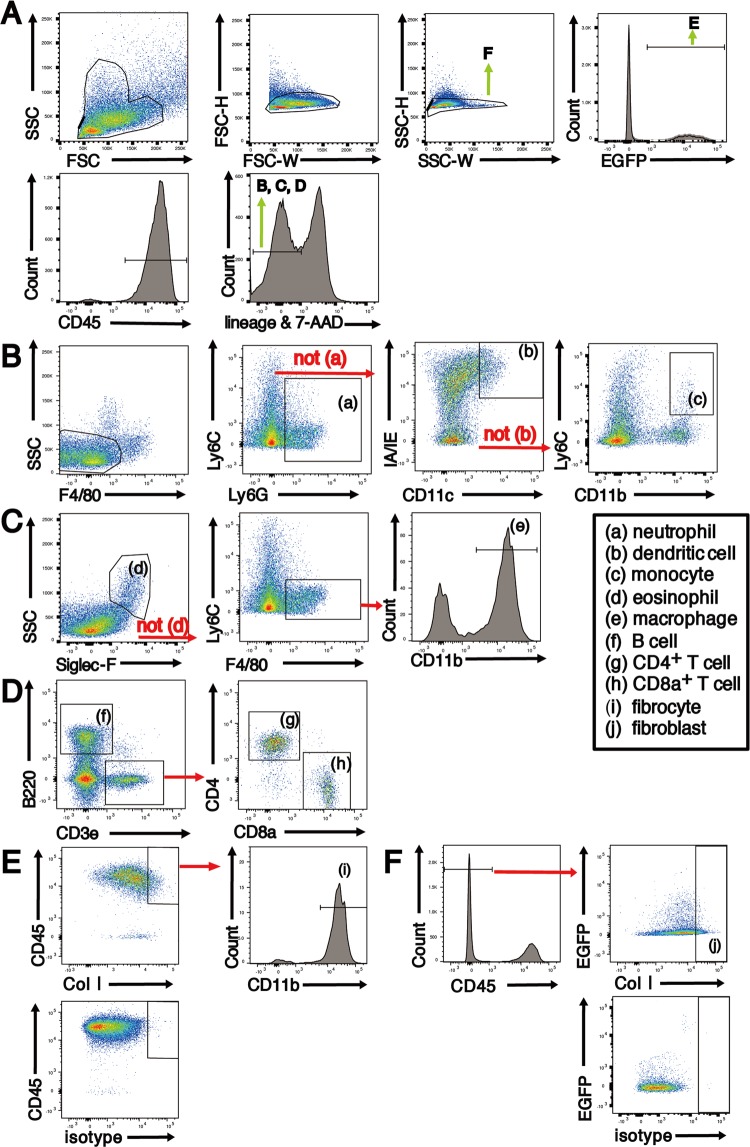
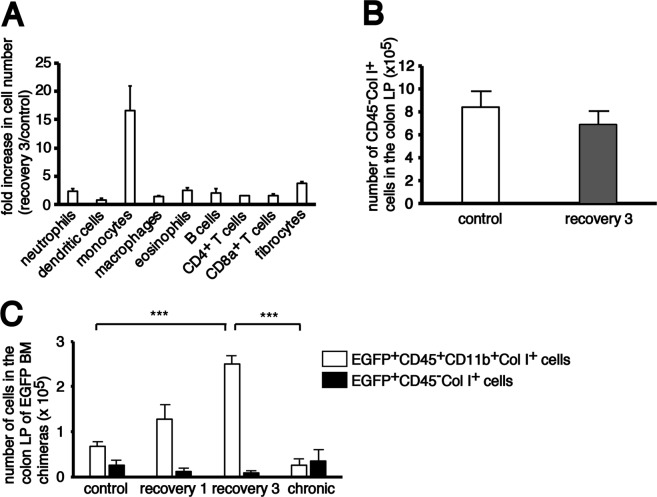
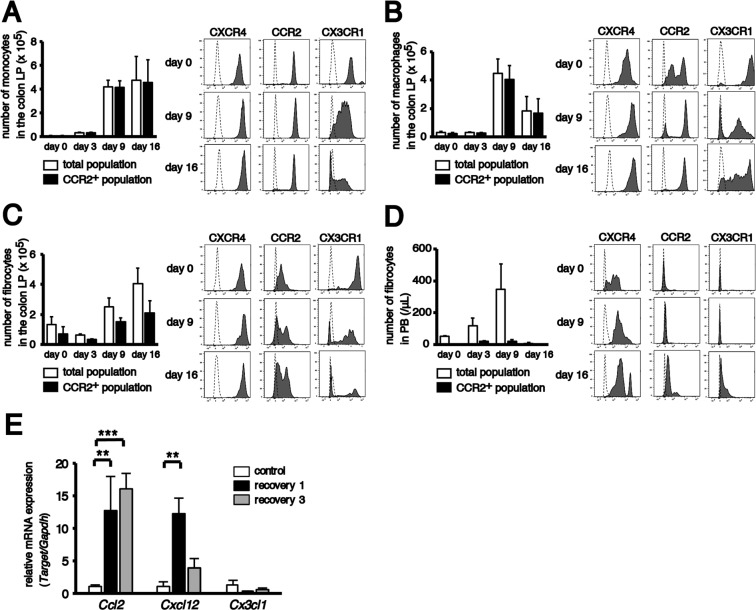
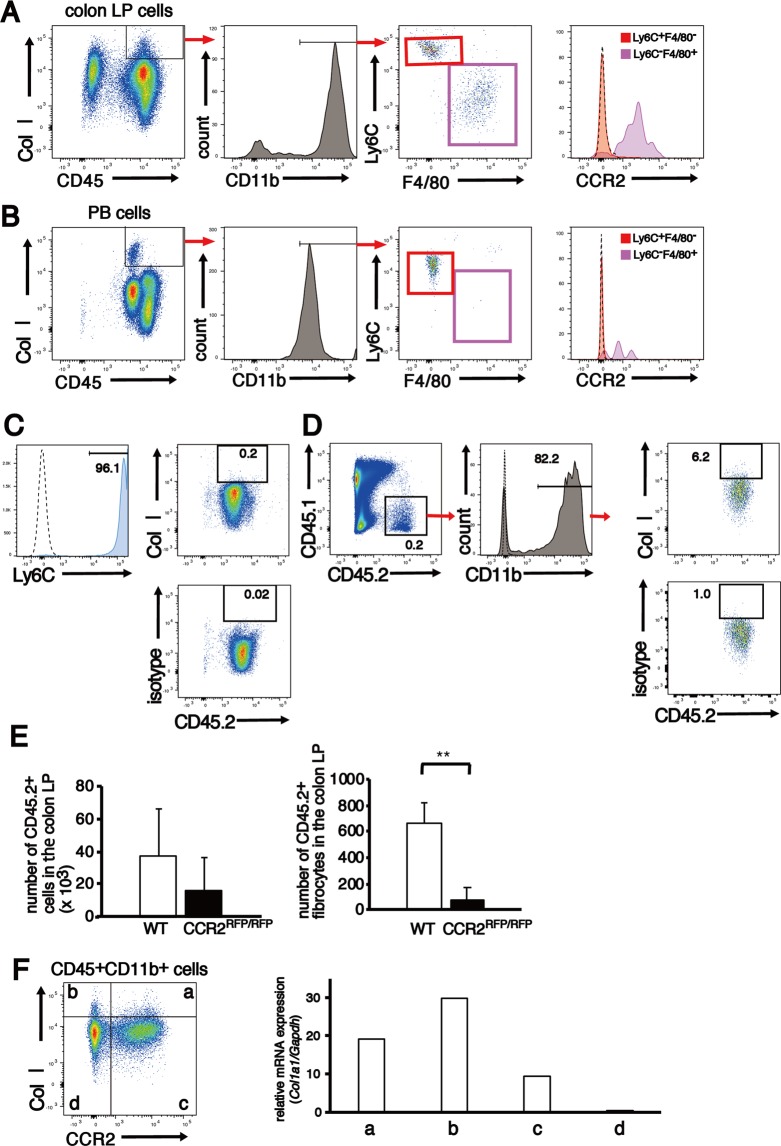
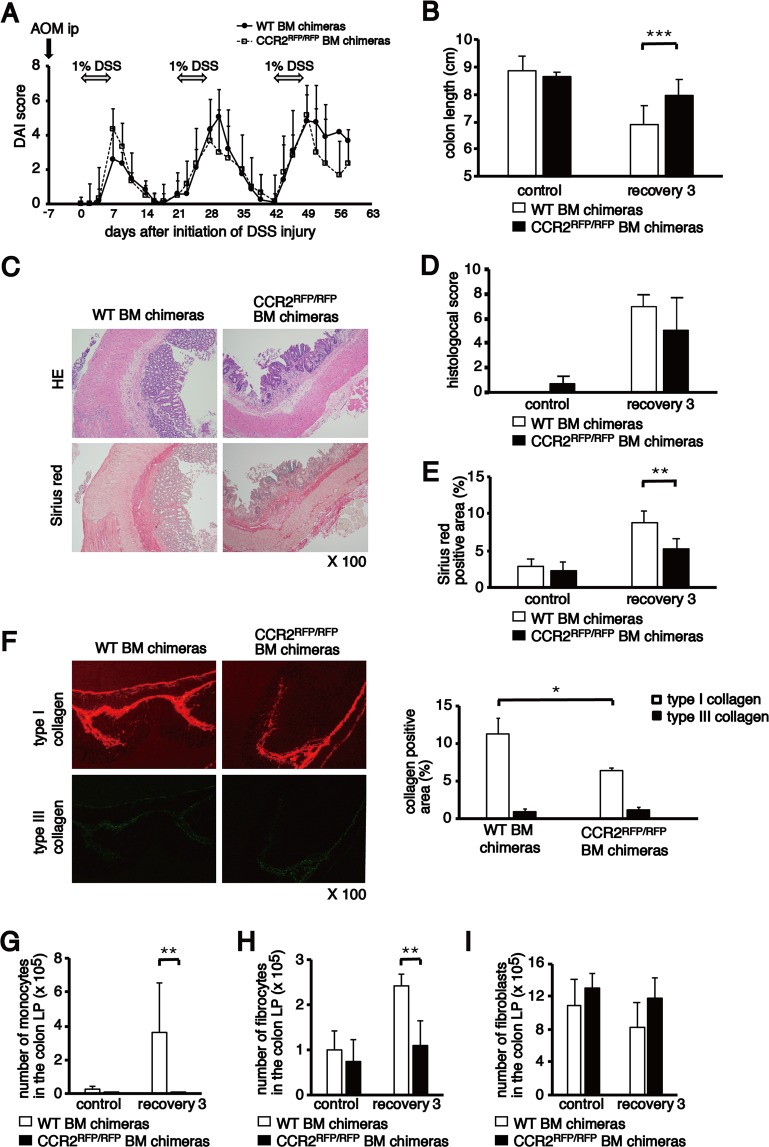
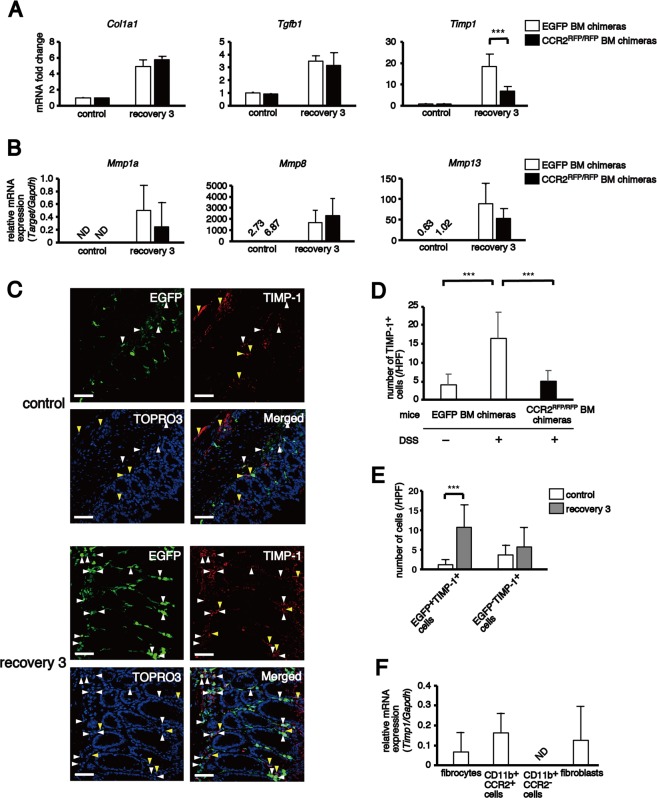
Intestinal fibrosis is a serious complication in inflammatory bowel disease (IBD). Despite the remarkable success of recent anti-inflammatory therapies for IBD, incidence of intestinal fibrosis and need for bowel resection have not significantly changed. To clarify the contribution of haematopoietic-derived cells in intestinal fibrosis, we prepared bone marrow (BM) chimeric mice (chimeras), which were reconstituted with BM cells derived from enhanced green fluorescent protein (EGFP)-transgenic mice or CC chemokine receptor 2 (CCR2)-deficient mice. After 2 months of transplantation, BM chimeras were treated with azoxymethane/dextran sodium sulphate. During chronic inflammation, CCR2+ BM-derived monocyte and fibrocyte infiltration into the colon and CC chemokine ligand 2 production increased, leading to colon fibrosis in EGFP BM chimeras. In CCR2-deficient BM chimeras, monocyte and fibrocyte numbers in the colonic lamina propria significantly decreased, and colon fibrosis was attenuated. In colon tissue, mRNA expression of tissue inhibitor of metalloproteinase (TIMP)-1 but not of collagen I, transforming growth factor-β1 or matrix metalloproteinases was significantly different between the two chimeras. CCR2+ monocytes and fibrocytes showed high Timp1 mRNA expression. Our results suggest that infiltrating CCR2+ monocytes and their progenies, fibrocytes, promote colon fibrosis by inhibiting collagen degradation through TIMP-1 production.


Conflict of interest statement

The authors declare no competing interests.

Figures

Figure 1
Figure 1
Colon fibrosis after chronic azoxymethane/dextran sodium sulphate (AOM/DSS) treatment. (A) Enhanced green fluorescent protein bone marrow (EGFP BM) chimeras were treated with a single intraperitoneal injection of AOM, followed by three cycles of 1% DSS for seven days in drinking water. Control mice received regular drinking water. The disease activity index (DAI) scores in DSS-treated (n = 11) and control mice (n = 3) were monitored three times per week. (B,C) The colon length and weight to length ratio were measured on days 17 (recovery 1) and 59 (recovery 3) from the start of DSS. The sample size for each group was n = 6. (D) Paraffin-embedded colon sections obtained from untreated (control) mice (n = 3) and chronically DSS-treated (recovery 3) mice (n = 3) were stained with haematoxylin and eosin (HE; upper), Sirius red (middle) and Masson’s trichrome (lower). Original magnification, ×100. (E,F) Quantification of Sirius red- and Masson’s trichrome-positive areas. (G) Sections stained with Sirius red were analysed using polarised microscopy to quantify type I and type III collagen. Quantification of type I and type III collagen-positive areas. The histograms show the mean percentage of the staining area per total colon area. The experiments were performed at least twice, yielding similar results. Data are expressed as the mean ± SD. *p < 0.05, **p < 0.01 and ***p < 0.001 by Kruskal–Wallis test followed by Dunn’s multiple comparison test.
Figure 2
Figure 2
Identification of bone marrow (BM)-derived cells in the colon. Frozen colon sections obtained from untreated (control; n = 3) and chronically treated (recovery 3; n = 3) EGFP BM chimeras were subjected to immunofluorescent staining. (A,B) The panels show EGFP as green, CD45 as red and TOPRO3 as blue. Yellow triangles indicate EGFP+CD45 cells. (C) The histograms show the mean number of EGFP+ cells and EGFP+CD45+ cells in a high-power field (HPF). (D,E) The panels show EGFP as green, CD45 as red and procollagen I as blue. (F) The histograms show the mean number of EGFP+CD45+procollagen I+ and EGFP+CD45procollagen I+ cells in a HPF. (G,H) The panels show EGFP as green, α-SMA as red and TOPRO3 as blue. White and yellow triangles indicate EGFP+α-SMA+ and EGFPα-SMA+ cells, respectively. (I) The histograms show the mean number of EGFP+α-SMA+ and EGFPα-SMA+ cells in a HPF. The experiments were performed at least twice and yielded similar results. Data are expressed as the mean ± SD. ***p < 0.001 by Mann–Whitney U test. Original magnification, ×400. Scale bars, 50 µm.
Figure 3
Figure 3
Representative flow cytometry gating strategy for the identification of major immune cell populations in the colon LP of EGFP BM chimeras. (A) Isolated colon LP cells were first gated on size, singularity and positive expression of EGFP and CD45. Next, lineage- and 7-AAD positive cells were eliminated. The lineage antibody cocktail was different depending on the cell type that was analysed. (B) The lineage antibody cocktail for cell surface staining of (a) neutrophils, (b) dendritic cells and (c) monocytes included anti-B220, anti-CD3e, anti-NK1.1, anti-TER119 and anti-Siglec F antibodies. (C) The lineage antibody cocktail for (d) eosinophils and (e) macrophages included anti-B220, anti-CD3e, anti-NK1.1 and anti-TER119 antibodies. (D) No lineage antibody cocktail was used for cell surface staining of (f) B cells, (g) CD4+ T cells and (h) CD8+ T cells. (E,F) To identify fibrocytes and fibroblasts, intracellular staining for Col I and surface staining for CD45 and CD11b were performed. BM-derived fibrocytes (i) and fibroblasts (j) were identified as EGFP+CD45+CD11b+Col I+ and CD45Col I+ cells, respectively.
Figure 4
Figure 4
Flow cytometry analysis of BM-derived cells in the colonic lamina propria (LP). (A) Fold increase in cell number of different cell fractions in the colonic LP of recovery 3 mice (n = 3) compared with control mice (n = 3). The quantitative data were obtained using flow cytometry. (B) The histograms show the mean number of total CD45collagen I+ cells in the colonic LP of both control and recovery 3 mice. (C) The histograms show the mean number of BM-derived EGFP+CD45+CD11b+Col I+ fibrocytes and EGFP+CD45Col I+ fibroblasts in the colonic LP of EGFP BM chimeras chronically treated with AOM/DSS. The sample size for each group was n = 3. The experiments were performed twice and yielded similar results. Data are expressed as mean ± SD. ***p < 0.001 statistical significance using Kruskal–Wallis test followed by Dunn’s multiple comparison test.
Figure 5
Figure 5
Expression of chemokine receptors on monocyte-lineage cells and chemokines in the colon. Colons and peripheral blood (PB) were harvested from non-transplanted CCR2RFP/+CX3CR1GFP/+ hybrid mice on days 0, 3, 9 and 16 after the initiation of 2% DSS treatment. The quantitative data were obtained using flow cytometry. The sample size for each group was n = 3. (A–D) The histograms in the left panels indicate the mean number of (A) monocytes, (B) macrophages, (C) fibrocytes in the colonic LP and (D) fibrocytes in the PB. Open bars, total population; closed bars, CCR2+ population. Representative flow cytometry analysis of the expression of CXCR4, CCR2 and CX3CR1 in each fraction are shown in the right panels. Dashed lines indicate data using the isotype control or background autofluorescence staining in WT mice. (E) The histograms show relative mRNA expression of Ccl2, Cxcl12 and Cx3cl1 in colon tissues obtained from untreated (control), acutely treated (recovery 1) and chronically treated (recovery 3) EGFP BM chimeras. The sample size for each group was n = 3. Data are expressed as the mean ± SD. **p < 0.01 and ***p < 0.001 statistical significance using Kruskal–Wallis test followed by Dunn’s multiple comparison test. The experiments were performed three times and yielded similar results.
Figure 6
Figure 6
Identification of two distinct fibrocytes in the colonic LP. (A,B) Colons and PB were harvested from non-transplanted CCR2RFP/+CX3CR1GFP/+ hybrid mice (n = 6) on day16 after the initiation of 2% DSS treatment. Representative flow cytometry analysis of the expression of Ly6C, F4/80 and CCR2 on CD45+CD11b+Col I+ cells in the colonic LP (A) and PB (B) are shown. (C–E) Adoptive transfer experiments. (C) Ly6C+ monocytes isolated from BM of C57BL/6J-Ly5.2 mice were negative for Col I. (D) Adoptively transferred CD45.2+Ly6C+ monocytes partly differentiated into Col I+ fibrocytes in the injured colon. Results are representative of two independent experiments. (E) Ly6C+ monocytes isolated from BM of CCR2RFP/RFP mice (C57BL/6J-Ly5.2 background) neither engrafted into the injured colon nor differentiated into fibrocytes in the colonic LP. The sample size for each group was n = 6. (F) CD45+CD11b+ LP cells obtained from seven pooled colons of EGFP BM chimeras chronically treated with 1% DSS were divided into four subpopulations: (a) CCR2+ fibrocytes, (b) CCR2 fibrocytes, (c) CCR2+Col I monocytes/macrophages and (d) CCR2Col I myeloid cells by Col I and CCR2 expression and they were sorted using FACSAria II. The right panel shows the mRNA expression level of Col1a1 in each subpopulation. Data are normalised to Gapdh. The experiments were performed three times and yielded similar results. Data are presented as the mean ± SD. **p < 0.01 by Mann–Whitney U test.
Figure 7
Figure 7
Reduction of colon fibrosis after AOM/DSS treatment by CCR2 deletion. (A) Change of DAI score in WT BM (n = 17) and CCR2RFP/RFP BM chimeras (n = 6) after AOM/DSS treatment. (B) Comparison of colon length between WT BM (n = 8) and CCR2RFP/RFP BM chimeras (n = 6 or 7) treated with or without 1% DSS. (C) Histological analysis of colon sections from WT BM and CCR2RFP/RFP BM chimeras on day 59 (recovery 3). Representative pictures of colon sections stained with HE (upper) and Sirius red (lower). Original magnification, ×100. (D) Comparison of histological score between WT BM (n = 6) and CCR2RFP/RFP BM chimeras (n = 6) treated with or without 1% DSS. (E) Quantification of Sirius red-positive areas in the colon of WT BM (n = 6) and CCR2RFP/RFP BM chimeras (n = 6) treated with or without AOM/DSS. (F) Quantification of collagen-positive areas in the colon of the WT BM (n = 3) and CCR2RFP/RFP BM chimeras (n = 3) treated with or without AOM/DSS. (G, H, I) The numbers of monocytes, fibrocytes and fibroblasts in the colon LP of WT BM and CCR2RFP/RFP BM chimeras treated with or without AOM/DSS were analysed using flow cytometry. The sample size for each group was n = 6. The experiments were performed at least twice, yielding similar results. Data are presented as the mean ± SD. *p < 0.05, **p < 0.01 and ***p < 0.001 by Mann–Whitney U test.
Figure 8
Figure 8
Reduction of TIMP-1 expression by CCR2 deletion. Expression levels of various genes in the colon were analysed by quantitative real-time reverse transcription polymerase chain reaction. (A) Expression levels of Col1a1, Tgfb1 and Timp1 relative to Gapdh in colon tissue were calculated and normalised to the expression levels of EGFP BM chimeras without injury. (B) Expression levels of Mmp1a, Mmp8 and Mmp13 in colon tissue were normalised to Gapdh. (C) The panels show EGFP as green, TIMP-1 as red and TOPRO3 as blue. White and yellow triangles indicate EGFP+TIMP-1+ and EGFPTIMP-1+ cells, respectively. (D) The histograms show the mean numbers of TIMP-1+ cells per HPF in the colon tissues of EGFP BM and CCR2RFP/RFP BM chimeras. (E) The histograms show the mean numbers of EGFP+TIMP-1+ and EGFPTIMP-1+ cells per HPF in the colon tissues of EGFP BM chimeras. (F) The expression levels of Timp1 in four cell populations in the colon LP. The gating strategy was as follows: fibrocytes; CD45+CD11b+Col I+ cells, CD11b+CCR2+ cells; CD45+CD11b+Col ICCR2+ cells, CD11b+CCR2 cells; CD45+CD11b+Col ICCR2- cells, fibroblasts; CD45Col I+ cells. The sample size for each group was n = 6. The experiments were performed at least twice, yielding similar results. Data are expressed as the mean ± SD. ***p < 0.001 by Mann–Whitney U test and Kruskal–Wallis test followed by Dunn’s multiple comparison test.

Similar articles

Cited by

References

    1. Bouhnik Y, et al. Efficacy of adalimumab in patients with Crohn’s disease and symptomatic small bowel stricture: a multicentre, prospective, observational cohort (CREOLE) study. Gut. 2018;67:53–60. doi: 10.1136/gutjnl-2016-312581. - DOI - PMC - PubMed
    1. Jones DW, Finlayson SR. Trends in surgery for Crohn’s disease in the era of infliximab. Ann. Surg. 2010;252:307–312. doi: 10.1097/SLA.0b013e3181e61df5. - DOI - PubMed
    1. Wynn TA. Cellular and molecular mechanisms of fibrosis. J. Pathol. 2008;214:199–210. doi: 10.1002/path.2277. - DOI - PMC - PubMed
    1. Duffield JS, Lupher M, Thannickal VJ, Wynn TA. Host responses in tissue repair and fibrosis. Annu. Rev. Pathol. Mech. Dis. 2013;8:241–276. doi: 10.1146/annurev-pathol-020712-163930. - DOI - PMC - PubMed
    1. Wick G, et al. The immunology of fibrosis. Annu. Rev. Immunol. 2013;31:107–135. doi: 10.1146/annurev-immunol-032712-095937. - DOI - PubMed

Publication types