

Hematological parameters and prevalence of anemia in white and British Indian vegetarians and nonvegetarians in the UK Biobank
- PMID: 31190054
- PMCID: PMC6669054
- DOI: 10.1093/ajcn/nqz072
Hematological parameters and prevalence of anemia in white and British Indian vegetarians and nonvegetarians in the UK Biobank
Abstract
Background: There may be differences in hematological parameters between meat-eaters and vegetarians.
Objective: The aim of this study was to perform cross-sectional analyses of hematological parameters by diet group in a large cohort in the United Kingdom.
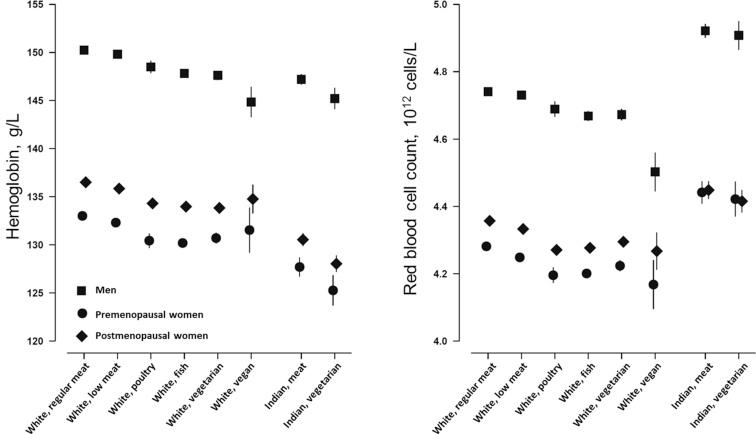
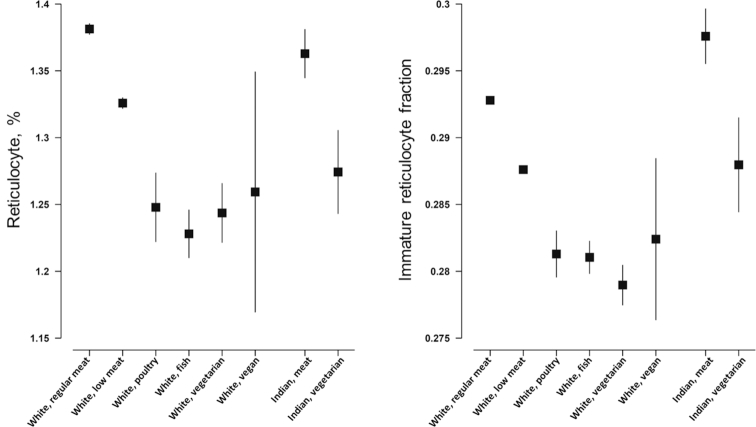
Methods: A complete blood count was carried out in all UK Biobank participants at recruitment (2006-2010). We examined hemoglobin, red and white blood cell counts, and platelet counts and volume in regular meat eaters (>3 times/wk of red/processed meat consumption, n = 212,831), low meat eaters (n = 213,092), poultry eaters (n = 4815), fish eaters (n = 10,042), vegetarians (n = 6548), and vegans (n = 398) of white ethnicity and meat eaters (n = 3875) and vegetarians (n = 1362) of British Indian ethnicity.
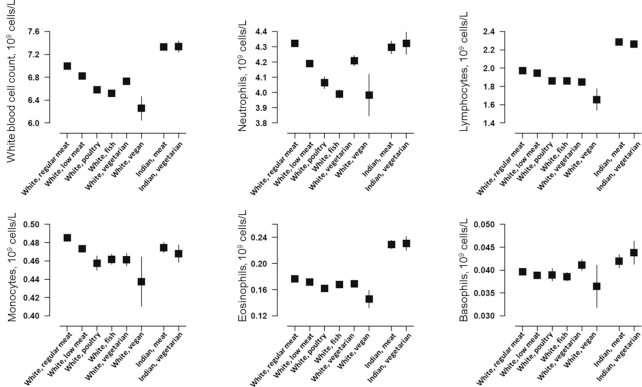
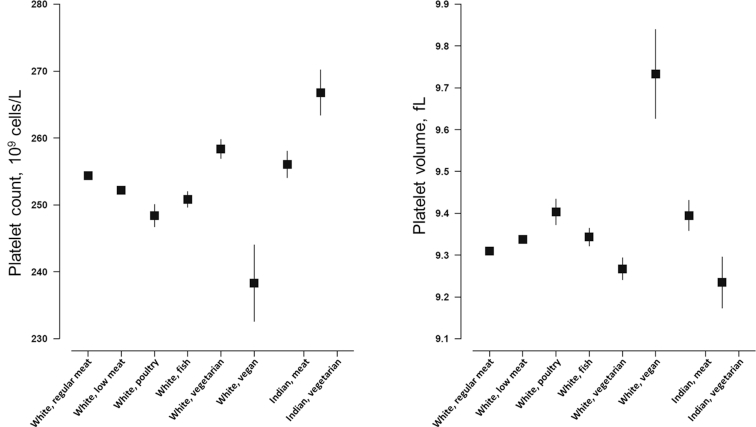
Results: In both white and British Indian populations, compared with regular meat eaters (or meat eaters in Indians), the other diet groups had up to 3.7% lower age-adjusted hemoglobin concentrations (difference not significant in white vegan women) and were generally more likely to have anemia (e.g., 8.7% of regular meat eaters compared with 12.8% of vegetarians in white premenopausal women; P < 0.05 after Bonferroni correction). In the white population, compared with regular meat eaters, all other diet groups had lower age- and sex-adjusted total white cells, neutrophils, lymphocytes, monocytes, and eosinophils (P-heterogeneity < 0.001 for all), but basophil counts were similar across diet groups; in British Indians, there was no significant difference in any of the white blood cell counts by diet group. Compared with white regular meat eaters, the low meat eaters, poultry eaters, fish eaters, and vegans had significantly lower platelet counts and higher platelet volume, whereas vegetarians had higher counts and lower volume. Compared with British Indian meat eaters, vegetarians had higher platelet count and lower volume.
Conclusions: In the UK Biobank, people with low or no red meat intake generally had lower hemoglobin concentrations and were slightly more likely to be anemic. The lower white blood cell counts observed in low and non-meat eaters, and differences in mean platelet counts and volume between diet groups, warrant further investigation. This observational study was registered at http://www.isrctn.com/ as ISRCTN10125697.
Keywords: UK Biobank; anemia; blood count; ethnicity; hematology; vegan; vegetarian.
Copyright © American Society for Nutrition 2019.
Figures
Similar articles
-
Anthropometric and physiologic characteristics in white and British Indian vegetarians and nonvegetarians in the UK Biobank.Am J Clin Nutr. 2018 Jun 1;107(6):909-920. doi: 10.1093/ajcn/nqy042. Am J Clin Nutr. 2018. PMID: 29868910 Free PMC article.
-
Biomarker Concentrations in White and British Indian Vegetarians and Nonvegetarians in the UK Biobank.J Nutr. 2021 Oct 1;151(10):3168-3179. doi: 10.1093/jn/nxab192. J Nutr. 2021. PMID: 34132352 Free PMC article.
-
Dietary Intake of High-Protein Foods and Other Major Foods in Meat-Eaters, Poultry-Eaters, Fish-Eaters, Vegetarians, and Vegans in UK Biobank.Nutrients. 2017 Dec 2;9(12):1317. doi: 10.3390/nu9121317. Nutrients. 2017. PMID: 29207491 Free PMC article.
-
Vegans, vegetarians, fish-eaters and meat-eaters in the UK show discrepant environmental impacts.Nat Food. 2023 Jul;4(7):565-574. doi: 10.1038/s43016-023-00795-w. Epub 2023 Jul 20. Nat Food. 2023. PMID: 37474804 Free PMC article. Review.
-
Nutrient Intake and Status in Adults Consuming Plant-Based Diets Compared to Meat-Eaters: A Systematic Review.Nutrients. 2021 Dec 23;14(1):29. doi: 10.3390/nu14010029. Nutrients. 2021. PMID: 35010904 Free PMC article.
Cited by
-
The magnitude and associated factors of immune hemolytic anemia among human immuno deficiency virus infected adults attending University of Gondar comprehensive specialized hospital north west Ethiopia 2021 GC, cross sectional study design.PLoS One. 2022 Oct 6;17(10):e0274464. doi: 10.1371/journal.pone.0274464. eCollection 2022. PLoS One. 2022. PMID: 36201533 Free PMC article.
-
Lifestyle Adjustments in Long-COVID Management: Potential Benefits of Plant-Based Diets.Curr Nutr Rep. 2021 Dec;10(4):352-363. doi: 10.1007/s13668-021-00369-x. Epub 2021 Sep 10. Curr Nutr Rep. 2021. PMID: 34506003 Free PMC article. Review.
-
Eating Habits in Patients with Familial Hypercholesterolemia from North-Eastern Romania.Nutrients. 2022 Jul 29;14(15):3124. doi: 10.3390/nu14153124. Nutrients. 2022. PMID: 35956302 Free PMC article.
-
Plant-based diets and long-term health: findings from the EPIC-Oxford study.Proc Nutr Soc. 2022 May;81(2):190-198. doi: 10.1017/S0029665121003748. Epub 2021 Oct 27. Proc Nutr Soc. 2022. PMID: 35934687 Free PMC article. Review.
-
Nutritional Status and the Influence of the Vegan Diet on the Gut Microbiota and Human Health.Medicina (Kaunas). 2020 Feb 22;56(2):88. doi: 10.3390/medicina56020088. Medicina (Kaunas). 2020. PMID: 32098430 Free PMC article. Review.
References
-
- Appleby PN, Davey GK, Key TJ. Hypertension and blood pressure among meat eaters, fish eaters, vegetarians and vegans in EPIC-Oxford. Public Health Nutr. 2002;5:645–54. - PubMed
-
- Pawlak R, Lester SE, Babatunde T. The prevalence of cobalamin deficiency among vegetarians assessed by serum vitamin B12: a review of literature. Eur J Clin Nutr. 2014;68:541–8. - PubMed
-
- Hunt JR. Bioavailability of iron, zinc, and other trace minerals from vegetarian diets. Am J Clin Nutr. 2003;78:633S–9S. - PubMed
Publication types
MeSH terms
Associated data
Grants and funding
LinkOut - more resources
Full Text Sources
Medical
