

The carbon footprint of breastmilk substitutes in comparison with breastfeeding
- PMID: 31190697
- PMCID: PMC6472111
- DOI: 10.1016/j.jclepro.2019.03.043
The carbon footprint of breastmilk substitutes in comparison with breastfeeding
Abstract
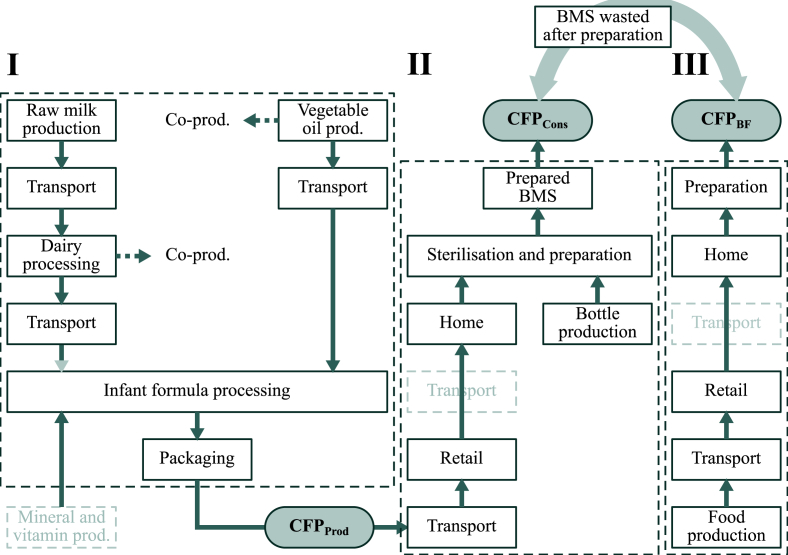
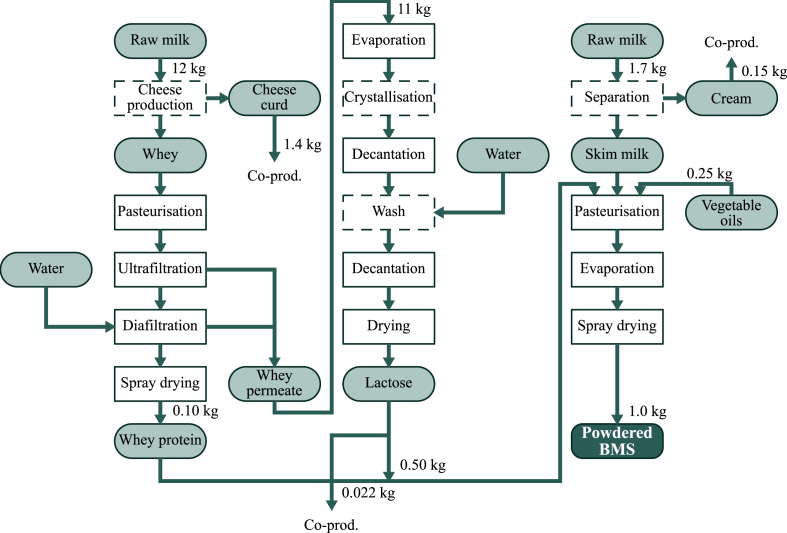
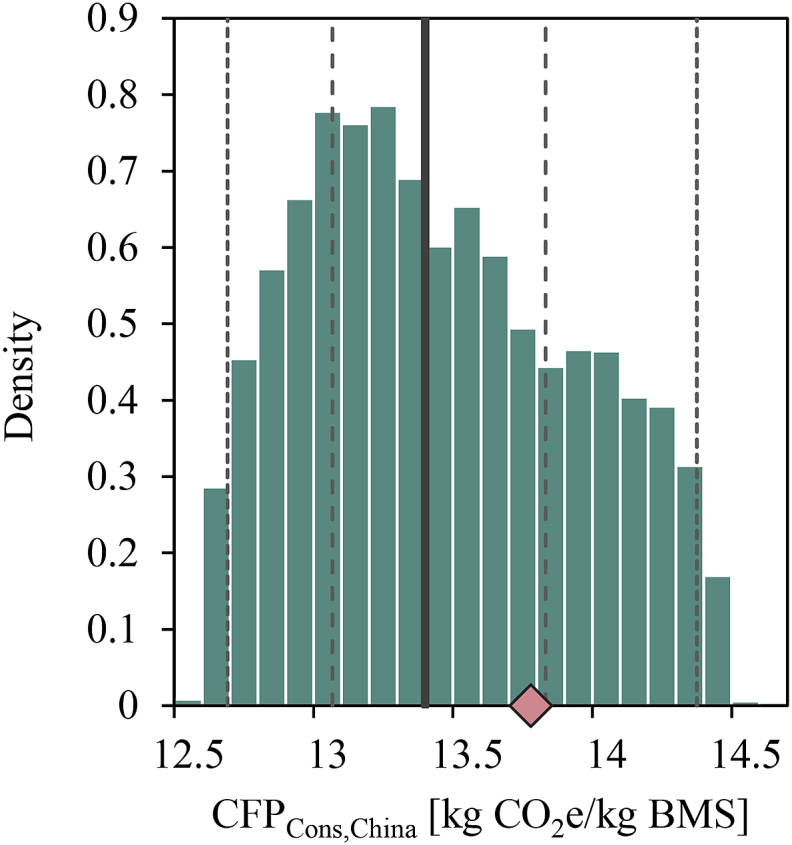
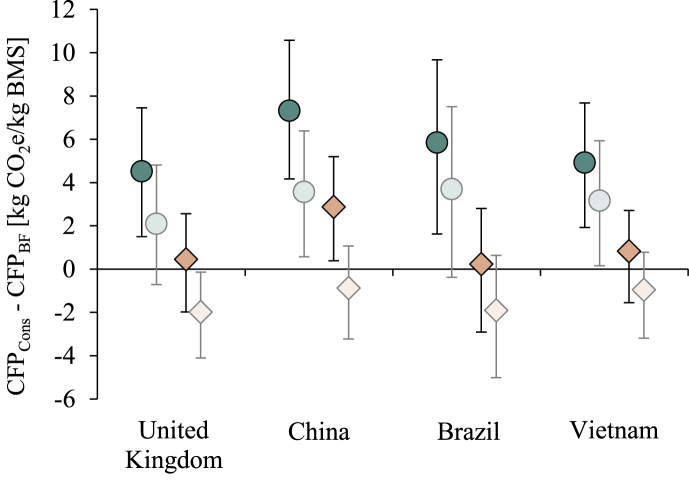
Breastfeeding is one of the foundations of child health, development and survival. Breastmilk substitutes (BMS) are associated with negative influences on breastfeeding practices and subsequent health concerns and, as with all foods, production and consumption of BMS comes with an environmental cost. The carbon footprint (CFP) of production and consumption of BMS was estimated in this study. To illustrate regional differences among the largest producers and consumers, the CFP of BMS production in New Zealand, United States (USA), Brazil and France and the CFP of BMS consumption in United Kingdom (UK), China, Brazil and Vietnam were assessed. The CFP values were then compared with the CFP of breastfeeding arising from production of the additional food needed for breastfeeding mothers to maintain energy balance (approximately 500 kcal per day). The CFP of production was estimated to be 9.2 ± 1.4, 7.0 ± 1.0, 11 ± 2 and 8.4 ± 1.3 kg CO2e per kg BMS in New Zealand, USA, Brazil and France, respectively, with the largest contribution (68-82% of the total) coming from production of raw milk. The CFP of consumption, which included BMS production, emissions from transport, production and in-home sterilisation of bottles, and preparation of BMS, was estimated to be 11 ± 1, 14 ± 2, 14 ± 2 and 11 ± 1 kg CO2e per kg BMS in UK, China, Brazil and Vietnam, respectively. Comparison of breastfeeding with feeding BMS showed a lower CFP from breastfeeding in all countries studied. However, the results were sensitive to the method used to allocate emissions from raw milk production on different dairy processing co-products (i.e. BMS, cream, cheese and lactose). Using alternative allocation methods still resulted in lower CFP from breastfeeding, but only slightly for UK, Brazil and Vietnam. Care is also needed when interpreting findings about products that are functionally different as regards child health and development.
Keywords: BMS, Breastmilk substitute; CFP, Carbon footprint; Climate impact; Infant formula; LCA; LUC, Land use change; Lifecycle assessment; Sensitivity; Uncertainty.
Figures

References
-
- Adom F., Workman C., Thoma G., Shonnard D. Carbon footprint analysis of dairy feed from a mill in Michigan, USA. Int. Dairy J. 2013;31:S21–S28. doi: 10.1016/j.idairyj.2012.09.008. - DOI
-
- Blincoe A.J. The health benefits of breastfeeding for mothers. Br. J. Midwifery. 2005;13(6):398–401. doi: 10.12968/bjom.2005.13.6.18361. - DOI
-
- Brander M., Sood A., Wylie C., Haughton A., Lovell J. 2011. Technical Paper | Electricity-specific Emission Factors for Grid Electricity. Econometrica.https://ecometrica.com/assets/Electricity-specific-emission-factors-for-...
-
- Carlsson-Kanyama A., Boström-Carlsson K. Stockholm University; 2001. Energy Use for Cooking and Other Stages in the Life Cycle of Food A Study of Wheat, Spaghetti, Pasta, Barley, Rice, Potatoes, Couscous and Mashed Potatoes. (Fms No 160, Report)
-
- Cederberg C., Stadig M. System expansion and allocation in life cycle assessment of milk and beef production. Int. J. Life Cycle Assess. 2003;8(6):350–356. doi: 10.1007/BF02978508. - DOI
Grants and funding
LinkOut - more resources
Full Text Sources
Research Materials
Miscellaneous