

Long noncoding RNA expression analysis reveals the regulatory effects of nitinol-based nanotubular coatings on human coronary artery endothelial cells
- PMID: 31190794
- PMCID: PMC6519025
- DOI: 10.2147/IJN.S204067
Long noncoding RNA expression analysis reveals the regulatory effects of nitinol-based nanotubular coatings on human coronary artery endothelial cells
Abstract
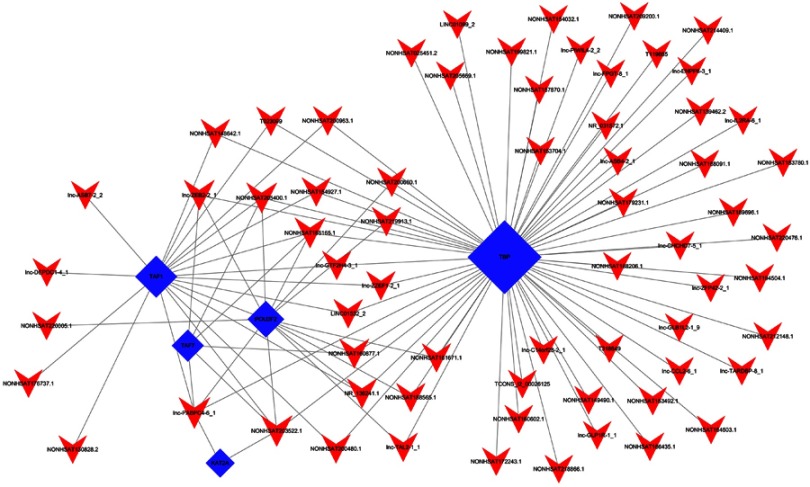
Background: Cardiovascular disease (CVD) is the leading cause of mortality all over the world. Vascular stents are used to ameliorate vascular stenosis and recover vascular function. The application of nanotubular coatings has been confirmed to promote endothelial cell (EC) proliferation and function. However, the regulatory mechanisms involved in cellular responses to the nanotubular topography have not been defined. In the present study, a microarray analysis was performed to explore the expression patterns of long noncoding RNAs (lncRNAs) in human coronary artery endothelial cells (HCAECs) that were differentially expressed in response to nitinol-based nanotubular coatings. Materials and methods: First, anodization was performed to synthesize nitinol-based nanotubular coatings. Then, HCAECs were cultured on the samples for 24 h to evaluate cell cytoskeleton organization. Next, total RNA was extracted and synthesized into cRNA, which was hybridized onto the microarray. GO analysis and KEGG pathway analysis were performed to investigate the roles of differentially expressed messenger RNAs (mRNAs). Quantitative real-time reverse-transcription polymerase chain reaction (qRT-PCR) was performed to validate the expression of randomly selected lncRNAs. Coexpression networks were created to identify the interactions among lncRNAs and the protein-coding genes involved in nanotubular topography-induced biological and molecular pathways. Independent Student's t-test was applied for comparisons between two groups with statistical significance set at p<0.05. Results: 1085 lncRNAs and 227 mRNAs were significantly differentially expressed in the nitinol-based nanotubular coating group. Bioinformatics analysis revealed that extracellular matrix receptor interactions and cell adhesion molecules play critical roles in the sensing of nitinol-based nanotubular coatings by HCAECs. The TATA-binding protein (TBP) and TBP-associated transfactor 1 (TAF1) are important molecules in EC responses to substrate topography. Conclusion: This study suggests that nanotubular substrate topography regulates ECs by differentially expressed lncRNAs involved extracellular matrix receptor interactions and cell adhesion molecules.
Keywords: RNA sequencing; long noncoding RNA; molecular networks; nanotopography; nitinol titanium dioxide nanotubes.
Conflict of interest statement
The authors declare that they have no competing interests in this work.
Figures


Similar articles
-
Analysis of Long Noncoding RNA Expression Profile in Human Pulmonary Microvascular Endothelial Cells Exposed to Lipopolysaccharide.Cell Physiol Biochem. 2019;52(4):653-667. doi: 10.33594/000000046. Cell Physiol Biochem. 2019. PMID: 30921505
-
Transcriptome analysis identified a novel 3-LncRNA regulatory network of transthyretin attenuating glucose induced hRECs dysfunction in diabetic retinopathy.BMC Med Genomics. 2019 Oct 15;12(1):134. doi: 10.1186/s12920-019-0596-2. BMC Med Genomics. 2019. PMID: 31615521 Free PMC article.
-
Aberrantly expressed long noncoding RNAs in hypertrophic scar fibroblasts in vitro: A microarray study.Int J Mol Med. 2018 Apr;41(4):1917-1930. doi: 10.3892/ijmm.2018.3430. Epub 2018 Jan 26. Int J Mol Med. 2018. PMID: 29393369 Free PMC article.
-
Emerging roles of long non-coding RNAs in the toxicology of environmental chemicals.J Appl Toxicol. 2018 Jul;38(7):934-943. doi: 10.1002/jat.3595. Epub 2018 Feb 1. J Appl Toxicol. 2018. PMID: 29388697 Review.
-
[Acting mechanisms and research methods of long noncoding RNAs].Yi Chuan. 2013 Mar;35(3):269-80. doi: 10.3724/sp.j.1005.2013.00269. Yi Chuan. 2013. PMID: 23575533 Review. Chinese.
Cited by
-
Advancing Nitinol: From heat treatment to surface functionalization for nickel-titanium (NiTi) instruments in endodontics.Bioact Mater. 2022 Sep 27;22:91-111. doi: 10.1016/j.bioactmat.2022.09.008. eCollection 2023 Apr. Bioact Mater. 2022. PMID: 36203965 Free PMC article.
-
Exosomal lncRNA HOTAIR Promotes the Progression and Angiogenesis of Endometriosis via the miR-761/HDAC1 Axis and Activation of STAT3-Mediated Inflammation.Int J Nanomedicine. 2022 Mar 16;17:1155-1170. doi: 10.2147/IJN.S354314. eCollection 2022. Int J Nanomedicine. 2022. PMID: 35321026 Free PMC article.
-
Biocompatibility and efficacy of prostatic urethral lift in benign prostate hyperplasia: an in vivo and in vitro study.Sci Rep. 2023 Aug 24;13(1):13828. doi: 10.1038/s41598-023-40889-w. Sci Rep. 2023. PMID: 37620451 Free PMC article.
References
MeSH terms
Substances
LinkOut - more resources
Full Text Sources
