

Covariate random effects on the CD4 count variation during HIV disease progression in women
- PMID: 31191037
- PMCID: PMC6535671
- DOI: 10.2147/HIV.S193652
Covariate random effects on the CD4 count variation during HIV disease progression in women
Abstract
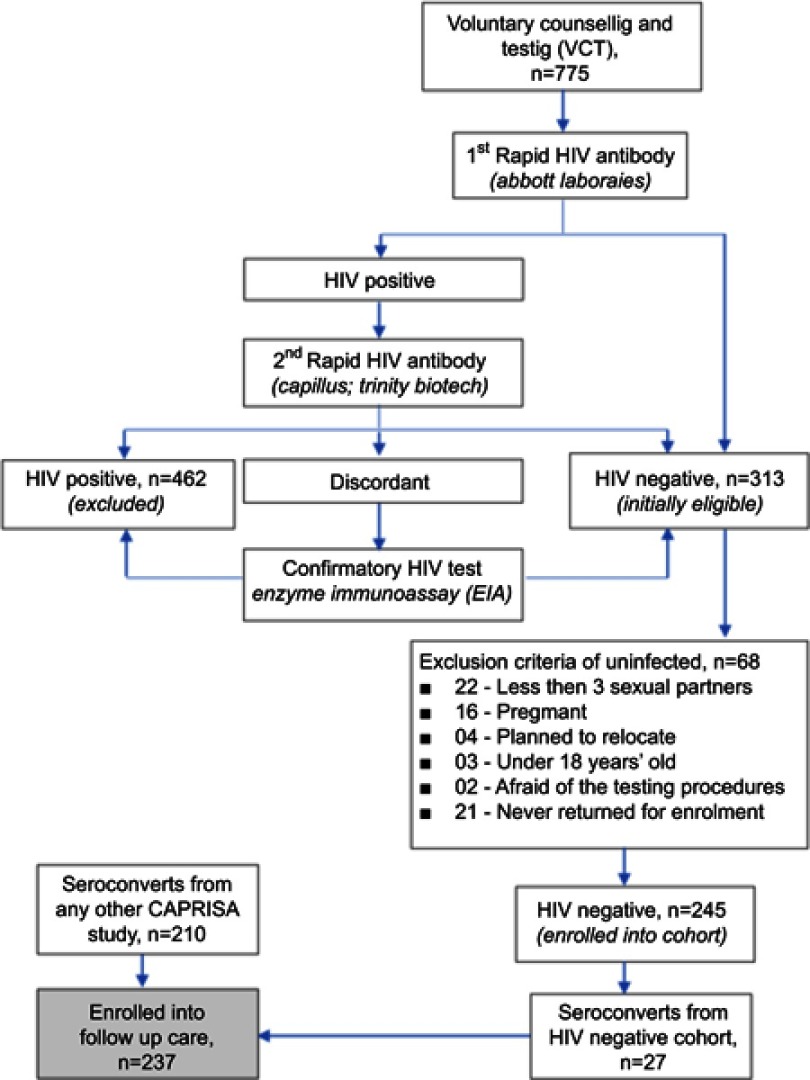
Purpose: To investigate the variation in CD4 count between HIV positive patients due to clinical covariates at each phase of the HIV disease progression. Patients and methods: The Centre for the AIDS Programme of Research in South Africa (CAPRISA) conducted different studies in which female patients were initially enrolled in HIV negative cohorts (phase 1). Seroconverts were further followed-up weekly to fortnightly visits up to 3 months (phase 2: acute infection), monthly visits from 3 to 12 months (phase 3: early infection), quarterly visits thereafter (phase 4: established infection) until antiretroviral therapy (ART) initiation (phase 5). Results: Eighteen out of the 46 CD4 count covariates investigated were significant. Low average CD4 counts at acute and early phase entry improved at a faster rate than entries at higher average CD4 count. During therapy, all the 18 covariates induced significantly different patients' average CD4 counts. The rate of change of CD4 count greatly varied in response to lactate dehydrogenase during the acute phase. Red blood cells increase resulted in the patients' CD4 counts approaching a common higher level during the early phase. During therapy, the already high CD4 counts improved faster than lower ones in response to the red blood cells increase. As the monocytes increased, patients with lower average CD4 counts became worse than those with higher average CD4 counts. Conclusion: Changes in the covariates measurements either induced no variation effects in certain phases or improved the CD4 count at a faster rate for those patients whose average CD4 was already high or worsen the CD4 level which was already low or caused the patients' CD4 counts to approach the same level - higher or lower than the general cohort. The studied covariates induced wide variations in the CD4 count between HIV positive patients during the ART phase.
Keywords: between variation; mixOmics; mixed models; parallel plot; partial least squares; redundant features.
Conflict of interest statement
The authors report no conflicts of interest in this work.
Figures


Similar articles
-
An Evaluation to Determine the Strongest CD4 Count Covariates during HIV Disease Progression in Women in South Africa.Infect Dis Ther. 2019 Jun;8(2):269-284. doi: 10.1007/s40121-019-0235-4. Epub 2019 Feb 12. Infect Dis Ther. 2019. PMID: 30756260 Free PMC article.
-
Low blood CD8+ T-lymphocytes and high circulating monocytes are predictors of HIV-1-associated progressive encephalopathy in children.Pediatrics. 2003 Feb;111(2):E168-75. doi: 10.1542/peds.111.2.e168. Pediatrics. 2003. PMID: 12563091
-
Trends and Adaptive Optimal Set Points of CD4+ Count Clinical Covariates at Each Phase of the HIV Disease Progression.AIDS Res Treat. 2020 Mar 1;2020:1379676. doi: 10.1155/2020/1379676. eCollection 2020. AIDS Res Treat. 2020. PMID: 32190387 Free PMC article.
-
Disease progression and mortality with untreated HIV infection: evidence synthesis of HIV seroconverter cohorts, antiretroviral treatment clinical cohorts and population-based survey data.J Int AIDS Soc. 2021 Sep;24 Suppl 5(Suppl 5):e25784. doi: 10.1002/jia2.25784. J Int AIDS Soc. 2021. PMID: 34546644 Free PMC article.
-
[Recommendations from the GESIDA/Spanish AIDS Plan regarding antiretroviral treatment in adults with human immunodeficiency virus infection (update February 2009)].Enferm Infecc Microbiol Clin. 2009 Apr;27(4):222-35. doi: 10.1016/j.eimc.2008.11.002. Epub 2009 Feb 26. Enferm Infecc Microbiol Clin. 2009. PMID: 19246124 Spanish.
Cited by
-
Multilevel ordinal model for CD4 count trends in seroconversion among South Africa women.BMC Infect Dis. 2020 Jun 23;20(1):447. doi: 10.1186/s12879-020-05159-4. BMC Infect Dis. 2020. PMID: 32576220 Free PMC article.
References
-
- Kelly G. Body temperature variability (Part 1): a review of the history of body temperature and its variability due to site selection, biological rhythms, fitness, and aging. Altern Med Rev. 2006;11(4):278–293. - PubMed
-
- Mohajan HK. Two criteria for good measurements in research: validity and reliability. Ann Spiru Haret Univ. 2017;17(3):58–82.
-
- Bajpai S, Bajpai R. Goodness of measurement: reliability and validity. Int J Med Sci Public Health. 2014;3(1):173–176. doi:10.5455/ijmsph.2013.191120133 - DOI
-
- Alexander LK, Lopes B, Ricchetti-Masterson K, Yeatts KB. Cohort Studies; 2015.
LinkOut - more resources
Full Text Sources
Research Materials
